International Journal of Innovative Technology and Exploring Engineering (IJITEE) ISSN: 2278-3075, Volume-8 Issue-9, July 2019
Abstract: Terrorist network analysis is a crucial topic of research nowadays. It helps law enforcement agencies to find the clear picture of crime in the early investigation. Several domains of computer science are useful for this research like graph traversal, graph optimization and multi criteria decision making In this paper one of the multi criteria decision making (MCDM) algorithm TOPSIS (technique for order preference by similarity to ideal solution) is used to find principal node in the graph. Its ease of use characteristic, make it fast and useful for all related analysis. We examine the 26/11 Mumbai attack terrorist network dataset using TOPSIS method. TOPSIS is found good method to analyze such type of problems.
Keywords: Terrorist Networks Mining, Social Network Analysis (SNA), TOPSIS (technique for order preference by similarity to ideal solution).
I. INTRODUCTION
Terrorism has become a detrimental affair worldwide. It is a critical issue that is causing a major vandalization to the whole community. The terrorist networks consist of thoroughgoing discrete soul or group of people who can commit aggressive movements. Due to extreme elevation in science and technology, the intruders have been continuously increasing their devastating potential. Hence inclusive skills are essentially needed for organizing and investigating the raw data to expose condemnatory information.The ideal purpose of the social network is to make a social interaction between the common people groups and to strengthen their personal relationships. These social networks websites are dedicated to form a chain network of the ideal thought peoples and to share their information, comments, messages etc. But now days the terrorism groups are also exploiting the features of the social networks and to form a chain network to strengthen their communication between without any puzzles. Hence the analysis of the social network data-set finds its importance to get the essential details through their analysis to identify the unwanted groups in social networks. Characteristics of node are important factors to judge the importance of node. Well known characteristics of node in graph are degree centrality, closeness centrality, Betweenness centrality, page rank centrality and eigenvector centrality. Degree centrality shows how many neighbors are associated to node. Closeness centrality describe how close the node to rest of the nodes in network.
Betweenness centrality defined as a how many times a node lie on path between other nodes.PageRank centrality shows support of node from other nodes. It uses Google Page Rank
Revised Manuscript Received on July 05, 2019
Saurabh Singh, computer science Engineering, Jabalpur Engineering College, India.
Shashikant Verma, computer science engineering, GBPEC Pauri Garwal, India.
Akhilesh Tiwari, computer science & IT, MITS Gwalior, India.
algorithm to calculate it. Eigenvector centrality of node defined as how a node can influence to other nodes in network. So there are several criterions available to be included in research. It requires Multi Criterion Decision Making algorithm to analyze the importance of node.Multi Criterion Decision Making (MCDM) approach is used to take decision which close to accuracy. We have different alternatives to process, using multiple criteria to find out best alternative. Multi-criteria decision making methods, which are closed to accuracy, are available to be used. Technique for Order Preference by Similarity to Ideal Solution (TOPSIS) displays results in 180 degree platform where positive ideal solution at one end and negative ideal solution at other end A dossier [1] from Indian government to Pakistan as a data set is used in this research note. The nodes in Fig 2 show the terrorists network as a result of ORA-LITE software using discussed dataset.
II. LITERATURE SURVEY
Social Network Analysis (SNA) is a major topic of research in the recent years. In current scenario it is also used in field of criminal investigation. There are methods to fetch and process information from a network. Some of the works associated with TOPSIS, SNA and their application for terrorist networks are listed below.Chances of application of network investigation techniques for identification of sensitivity in different type of criminal organization are examined in [3].To increase national security various technological techniques to discover various terrorist networks are discussed introductorily in [8]. V. E Krebs discussed mapping of networks of attacker in 9/11 attack in [4].
A mechanism for subgroup detection and terrorist agility analysis is created by Memon and co-authors in literature [7]. To find the order of a group and the master of the group the techniques make use of centrality measures as well as data mining techniques with mathematical model for the finding of mater nodes in the network were used by Fox and co-authors in [16]. Methods for the ranking of each node and determination of the most important path in the network are suggested in [15]. To find out important node on terrorist network promethee method is implemented in [19]In 1981 Hwang and Yoon developed TOPSIS method [10] which was further advanced by Yoon in 1987 [13]. In 2006[14] zavadskas and zakarevicius presented ranking of solution in MCDM.To find the important node in the 26/11 Mumbai attack network we apply the TOPSIS decision making frame work in this paper.
III. METHODOLOGY In 1981 Hwang and Yoon
developed TOPSIS method. It is specially used when
Identification of Pivotal node in Terrorist
Network using TOPSIS Method
Published By: multiple criteria is available to take decision.
Two approaches are made in the TOPSIS method-
1)Positive ideal solution- one which has the highest positive attribute values
2)Negative ideal solution- one which has the highest negative attribute values
TOPSIS finds the solution that is nearest to positive ideal solution and farthest from negative ideal solution. A table that is used to make selection from a list of option is called as selection matrix.
The following steps are executed to get the solution in TOPSIS method-
Step 1- Standardizing columns of selection matrix: For standardizing each column of selection matrix, is divided by root of sum of square of respective row.
Step 2- Weight multiplication: A weighted standardized selection matrix is obtained by multiplying attribute weight to each.
Step 3- Obtaining positive ideal solution and negative ideal solution: A set of minimum values for each criteria or row is negative solution. A set of maximum values for each criteria or row is positive solution.
Step 4- Obtaining separation from positive ideal solution- Separation can be obtained by subtracting the maximum value row wise and finding its square followed by adding the maximum value column wise and then finding its square root. Step 5- Obtaining separation from negative ideal solution- Separation can be obtained by subtracting the minimum value row wise and finding its square followed by adding the minimum value column wise and then finding its square root. Step 6- Obtaining relative closeness to Negative ideal solution- Suppose x1 is a set of separation from positive ideal solution in the end of step 4 and x2 is a set of separation from negative ideal solution in the end of step 5. Now find (x1+x2) column wise then find x2/(x1+x2), it gives separation from negative ideal solution. Column has maximum value, is solution because it is separated maximum from negative ideal solution and closest to positive ideal solution.
In [Fig.1] a general approach of TOPSIS method is visualized. Here s1, s2…s6 are solutions. TOPSIS helps to find the distance from positive and negative ideal UNITS
Fig 1 A visual approach of TOPSIS
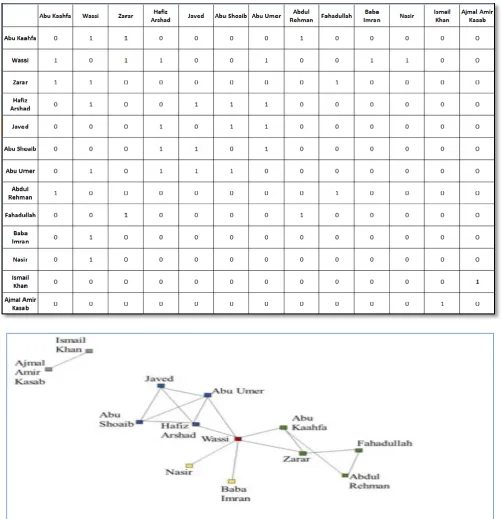
IV. METHOD IMPLEMENTATION AND RESULTS 26/11 Mumbai terrorist attacks dataset [1] is used in this research. A dossier [18] from Indian government to Pakistan is studied here. After carefully observation of this report, links between terrorists are found. Using these links a data set in form of adjacency matrix is created and analyzed, as shown in Table1.
Social network simulator ORA-LITE software is very good to illuminate the network. It is also useful to calculate network centrality measures. Out of 13 t terrorists, this method is applied on 5 most deserving candidates for key leader named: wassi, hafiz arshad, abu kaahfa, abu shoaib and abu umer. Here selection of candidates is done on the basis of ORA-LITE ranking.
International Journal of Innovative Technology and Exploring Engineering (IJITEE) ISSN: 2278-3075, Volume-8 Issue-9, July 2019
Fig 2 (26/11) Mumbai
Terrorist
Attacks Network Out of several criteria of graph properties four most importantcriteria are used here.
I. Betweenness Centrality (BC): Suppose there are several nodes in a graph. So to calculate betweenness centrality of node n, we get shortest path between all nodes and try to find out how many times shortest paths goes through n. In real life example a broker of public service has high between centrality.
II. Closeness Centrality (CC): Closeness Centrality is a term used to denote closeness centrality of node n in a fashion that how close node n to all other nodes of network. So if node position is centralized then it is a chance to become high closeness centrality node. In railway high closeness centrality station is generally used to become junction cum station.
III. Eigenvector Centrality (EC): Eigenvector Centrality is a criterion of the influence of a node in a network. Its working comprises of assignment of relative scores to each node I
the network based on the notion that connections to high-earning nodes contribute more to the score of the node
in question than equal connections to low-earning nodes. Usually, the chief of such organizations or cliques are those people connected to nodes having high eigenvector i.e. are
themselves connected to major important nodes. IV. PageRank Centrality (PC): PageRank is a slight variation of
[image:3.595.47.550.49.569.2]Published By: to itself but also important nodes not in its direct
connection. A node’s PageRank is calculated by the link counts it obtains, the link disposition of the linkers, and the arrangement of the linkers.
[image:4.595.305.549.49.280.2]ORA–LITE software visualizes data in the fabric of Betweenness centrality, PageRank centrality, Eigenvector centrality and Closeness centrality. Before applying TOPSIS method, it is important to normalize data to scale 1 to 9 especially here, as it is easy to handle.
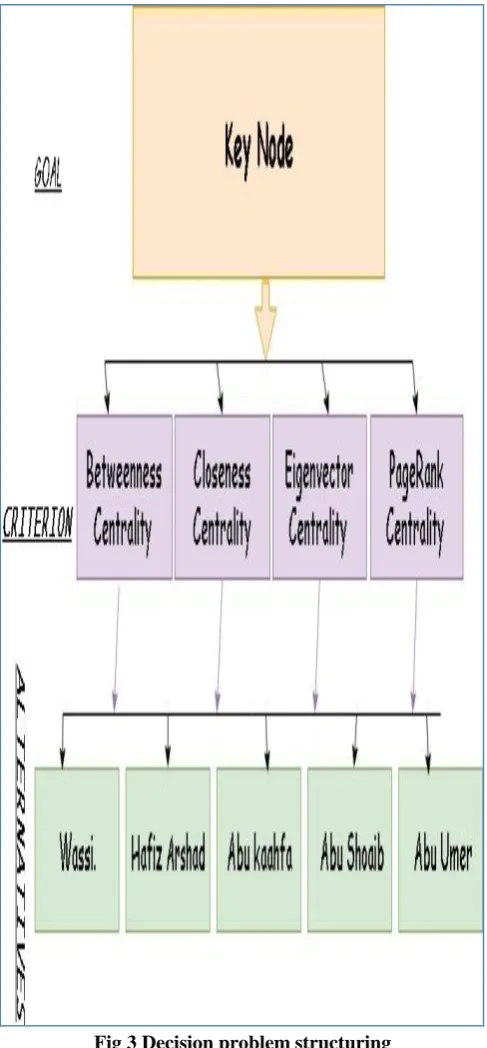
Fig 3 Decision problem structuring
The normalized calculations are arranged in different tables’ criteria wise. Values of 5 alternatives on a Betweenness Centrality criterion are displayed in Table 2.
Table 2 Normalized data of Betweenness centrality
Alternative s
Betweenness centrality
As per ORA-LITE
Betweenness centrality
Scale(1-9)
Wassi
0.503 9
Hafiz
Arshad 0.003 1.047
Abu kaahfa 0.136 3.163
Abu Shoaib 0 1
Abu Umer
0.003 1.047
[image:4.595.47.291.184.709.2]Closeness Centrality for five terrorists is displayed in Table 3. Table 3 Normalized data of Closeness centrality
Alternatives Closeness centrality As per ORA-LITE
Closeness centrality Scale(1-9) Wassi
0.308 6.844
Hafiz Arshad
0.267 5.779
Abu kaahfa
0.279 6.090
Abu Shoaib
0.267 5.779
Abu Umer
0.267 5.779
Values of 5 alternatives on an Eigenvector Centrality criterion are displayed in Table 4.
Table 4 Normalized data of Eigenvector centrality Alternatives Eigenvector centrality
As per ORA-LITE
Eigenvector centrality Scale(1-9) Wassi
0.612 9
Hafiz
Arshad 0.469 6.816
Abu kaahfa
0.246 8.412
Abu Shoaib
0.469 6.816
Abu Umer
0.469 6.816
[image:4.595.305.551.313.533.2] [image:4.595.303.550.580.832.2]International Journal of Innovative Technology and Exploring Engineering (IJITEE) ISSN: 2278-3075, Volume-8 Issue-9, July 2019
Table 5 Normalized data of Pagerank centrality Alternatives Pagerank centrality
As per ORA-LITE
Pagerank centrality Scale(1-9)
Wassi 0.187 9
Hafiz Arshad
0.089 3.974
Abu kaahfa
0.087 3.811
Abu Shoaib
0.069 2.848
Abu Umer
0.89 3.974
According to importance of criteria in terrorist mining, following weightages are set for further calculations as shown in table 6.
Table 6 Weightage of Criteria
criteria weightage
Betweenness
centrality 3
Closeness
centrality 2
Eigenvector centrality
2
Pagerank
centrality 3
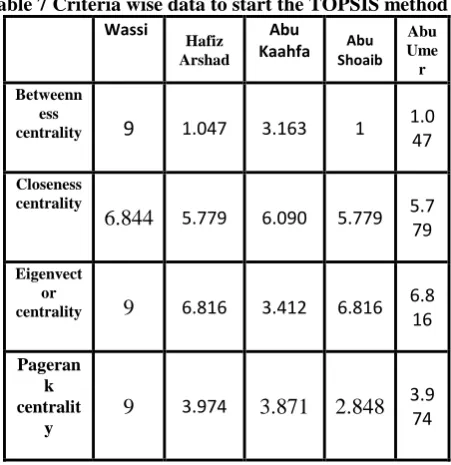
[image:5.595.55.281.495.728.2]Starting with TOPSIS, before entering step1 a selection matrix is positioned in table 7.
Table 7 Criteria wise data to start the TOPSIS method Wassi
Hafiz Arshad
Abu
Kaahfa Shoaib Abu
Abu Ume r Betweenn
ess
centrality
9
1.047 3.163 1 1.047Closeness centrality
6.844
5.779 6.090 5.779 5.779
Eigenvect or
centrality
9
6.816 3.412 6.816 6.816Pageran k centralit
y
9
3.9743.871
2.848
3.974
After step 1 standardized data in election matrix is displayed in table 8.
Table 8 Selection Matrix after step 1
Wassi
Hafiz Arshad
Abu
Kaahfa Shoaib Abu Umer Abu
Betweenn ess
centrality
0.92
7
0.107 0.325 0.103 0.107Closeness centrality
0.504
0.425 0.448 0.425 0.425Eigenvect or
centrality
0.590
0.447 0.224 0.447 0.447Pageran k centralit
y
0.771
0.3400.331
0.252
0.340Using table 5 new selection matrix is obtained by multiplying attribute weight criteria wise is computed as displayed in table 9.This is output of step 2.
Table 9 Selection Matrix after step 2 Wassi
Hafiz Arshad
Abu
Kaahfa Shoaib Abu Umer Abu Betweenne
ss centrality
2.78
1
0.321 0.975 0.309 0.321Closeness
centrality
1.008
0.85 0.896 0.825 0.85Eigenvector
centrality
1.18
0.894 0.448 0.894 0.894Pagerank
centrality
2.313
1.020.993
0.756
1.02Now a set of positive ideal solution and set of negative ideal solution are calculated according to step 3.
Positive ideal solution is displayed in equation 1 and negative ideal solution is displayed in equation 2.
Positive ideal solution = {2.781, 1.008, 1.18, 2.313} --- (1)
Negative ideal solution = {0.309, 0.85, 0.44, 0.756} --- (2)
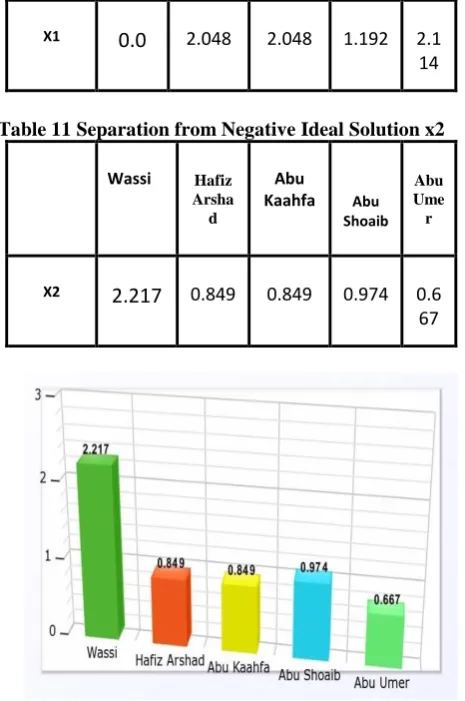
[image:5.595.303.550.719.825.2]After step 4 separation from positive ideal solution x1 is displayed in table 10. After step 5 separation from positive ideal solution x2 is displayed in table 11.
Table 10 Separation from Positive Ideal Solution x1 Wassi
Hafiz Arshad
Abu
Kaahfa Abu Shoaib
Published By:
X1
0.0
2.048 2.048 1.192 2.1 [image:6.595.48.281.51.402.2]14
Table 11 Separation from Negative Ideal Solution x2
Wassi Hafiz Arsha d
Abu
Kaahfa Abu Shoaib
Abu Ume r
X2
2.217
0.849 0.849 0.974 0.6 [image:6.595.62.275.433.609.2]67
Fig 4 Separation from Negative Ideal Solution
Fig 5 Separation from Positive Ideal Solution
Going through table 9 and table 10 it can be clearly identified that Wassi has the highest separation from negative ideal solution and very near to positive ideal solution. One more thing to be analyzed here that after displacement of Wassi; Abu Shoaib was all set to gear up role of Wassi. Results of table 10 and table 11 are visualized in Fig 4 and Fig 5.
V. CONCLUSION
In this work a novel method is shown for searching the momentous node in a criminal or terrorist network. Using various graph properties, a TOPSIS algorithm is applied to deal the desired work. Result of this research advice that
Wassi was the momentous person. It can be confirmed going through the reports [17] and data released by the Indian government [18].
Thus this method can be used to design counterterrorism plans and can be used to solve typical criminal cases in real life. In forthcoming research, solving daily life criminal investigation is main objective.
REFERENCES
1. Sarita Azad and Arvind Gupta, “A Quantitative Assessment on 26/11 Mumbai Attack using Social Network Analysis” Journal of Terrorism Research, Volume 2, Issue 2, November 2011.
2. M.E.J Newman, Networks: An Introduction, Oxford University Press, 2010.
3. M. K. Sparrow. The application of Network Analysis to criminal intelligence: An assessment of the prospects. 1991. Social Networks. Esevier13, 251-274.
4. V.E.Krebs. Mapping networks of terrorist cells. 2002. Connections 24(3): 43-52 International Network for Social Network Analysis.
5. S. Wasserman and K. Faust. Social Network Analysis: Methods and Applications, ddison-Wesley, 1994.
6. Nasrullah Memon, Henrik Legind Larsen, David L. Hicks, and Nicholas Harkiolakis. Detecting Hidden Hierarchy in Terrorist Networks: Some Case Studies. Springer-Verlag, pages 477–489, 2008.
Proceedings of the IEEE ISI 2008 PAISI, PACCF, and SOCO international workshops on Intelligence and Security Informatics.
7. Nasrullah Memon, David L. Hicks, and Henrik Legind Larsen. How Investigative Data Mining Can Help Intelligence Agencies to Discover Dependence of Nodes in Terrorist Networks. In Proceedings of the 3rd international conference on Advanced Data Mining and Applications ADMA ’07, pp. 430–441, Berlin, Heidelberg, 2007. Springer-Verlag. 8. Jennifer Xu and Hsinchun Chen. Criminal network analysis and
visualization. Commun. Association for Computing Machinery, 48:100–107, June 2005.
9. Ala Berzinji, Lisa Kaati, Ahmed Resine, Deacting Key Players in Terrorist Networks. European Intelligence and Security Informatics Conference(EISIC), 2012.
10. Hwang, C.L.; Yoon, K. Multiple Attribute Decision Making: Methods
and Applications. New York: Springer-Verlag, 1981.
11. De Keysar, Keyser,W.,Peeters,P., A note on the use of PROMETHEE multicriteria methods. European Journal of Operational Research 89, 457–461, 1996.
12. Brans J.P. and Ph. Vincke A preference ranking organization method: The PROMETHEE method. Management Science Vol. 31, 647–656, 1985
13. Yoon, K. (1987). Reconciliation among discrete compromise situations. Journal of Operational Research Society. 38. pp. 277–286. doi:10.1057/jors.1987.44
14. Zavadskas, E.K.; Zakarevicius, A.; Antucheviciene, J. (2006). "Evaluation of Ranking Accuracy in Multi-Criteria Decisions". Informatica. 17 (4): 601–618.
15. Saurabh Singh, Shashikant Verma, Akhilesh Tiwari, Divyani Indurkhya and Aditya Tiwari. An Innovative Investigation on the Importance of Link in Terrorist Network Using Prim’s Algorithm (Anti - Terrorism Approach), In Proceedings of International Conference on Recent Developments in Engineering, Science and Management, 2017.
16. Fox, William P., and Sean F. Everton. 2014. "Using Mathematical Models in Decision Making Methodologies to Find Key Nodes in the Noordin Dark Network." American Journal of Operations Research,
4, pp. 255-67.
17. Rahi Gaikwad, Mumbai attackers made two earlier attempts: Headley,
The Hindu, February 8, 2016.
18. A report on Mumbai attack, “Mumbai terrorist attack (Nov. 26-29, 2008)”, Govt. of India, 2009.
International Journal of Innovative Technology and Exploring Engineering (IJITEE) ISSN: 2278-3075, Volume-8 Issue-9, July 2019
Author-1 Photo
A uthor-2
Photo
Author-3 Photo
promethee method (Anti - Terrorism Approach")”, ,. International journal of engineering and technology, Vol7, No1, pp. 95-99. 20. DOI: https://doi.org/10.14419/ijet.v7i1.8828
AUTHORSPROFILE
Saurabh Kumar Singh ([email protected]) is assistant professor in Jabalpur engineering college and is currently working toward his Ph.D. degree at Dehradun. His research interests include Terrorist Mining, Cyber Crime as well as Mobile and Wearable device computing.
Dr ShashiKant Verma
([email protected]) is an associate professor in the department of Computer Science and Engineering, GBPEC, Pauri. His current research interests include Terrorist Mining, Computer Architecture, Microprocessor, Big data Analysis and Social Network Analysis.