Abstract: Development of financial sector has lead to an increase in financial risk. In order to prevent such risks, this study proposes a model for prediction of default cards with the help of data mining techniques. Balancing algorithms such as SMOTE and ADASYN algorithms are used to balance the imbalanced data because balanced data can be useful in increasing the efficiency of the model. Later both the balancing techniques are compared to see which one performs better. This balanced data is then taken as an input to an machine learning algorithm such as SVM to predict default credit cards. Accuracy of this model is found out by comparing it with other data models.
Index Terms: Default credit cards, prediction model, data mining, classification, machine learning.
I. INTRODUCTION
As the use of credit cards are increasing day by day the number of defaulter is also increasing. A defaulter is a customer who has skipped making the minimum payment for several months. When compared with traditional loans the debt repayment in credit card loan is minimum as compared to the credit balance which places a greater risk on the lenders. Drastic impact of default cards on state economy have prompted many researchers to explore the default issue because even small increase in the accuracy can bring huge economic profits to relevant institutions.
Data mining consists of various techniques which can be used for exploring available data and changing them into understandable format so that it can be used in the future. It is used for detecting patterns and relationship among various data on large datasets. Recently data mining has been discovered to have relevance in banking sectors. The main purpose of using data mining technique is that it can be used for building predictive models.
As default prediction is very important for risk control purpose many researchers have been working on increasing the accuracy of the model by focusing on classification and ignoring pre-processing stages. The goal of this paper is to increase the recall, ROC values, accuracy and precision of prediction model by balancing the data in the pre-processing area.
II. PROCEDUREFORPAPERSUBMISSION Many researches have been done in the field of prediction of
Revised Manuscript Received on May 10, 2019
Akanksha Shankar Shetty, Department of Computer Science and Engineering, Manipal Institute of Technology, Manipal Academy of Higher Education, Manipal, Karnataka, India .
Manoj R, Department of Computer Science and Engineering, Manipal Institute of Technology, Manipal Academy of Higher Education, Manipal, Karnataka, India.
default cards.
Danenas et al [1] has described an approach for credit risk evaluation which makes use of linear support vector machines classifiers. It makes use of particle swarm optimization technique in order to focus on imbalanced learning. This model has high accuracy but it is less stable as compared to other methods.u
Xu et al [2] has proposed an improved model called SRIPPER which is based on RIPPER algorithm to find out the default credit cards. This algorithm helps in increasing the accuracy and interpretability of the model. The models accuracy and interpretability is found out by comparing the SRIPPER model with the existing mainstream models. The problem caused by imbalance in the dataset is solved by SMOTE algorithm.
Ling-ying et al [3] has discussed several ways to extract features from raw variables to differentiate good from bad accounts. Using these features a new and a more difficult picture of cardholders behavior can be predicted.
Wah et al [4] compared three credit scoring models classification and regression tree(CART), neural network model and logistic regression to distinguish between rejected and accepted credit card applicants of a bank. The performance of these models largely depends on the structure and quality of the data. Out of the three models neural networks had slightly higher predictive accuracy.
Butaru et al [5] in this paper delinquency is predicted by applying machine learning techniques such as decision tree, logistic regression and random forest on consumer tradeline , credit bureau and macroeconomic variables. The model also compares various risk management practices but it is observed that no single model can capture the tendencies of delinquency across different banks.
Wei Li et al [6] has used principle component analysis to extract a comprehensive variable from the original data to indicate if the customers card has defaulted or not and then compared five data mining technologies such as interaction detector, chi-squared automatic, stepwise logistic model, C5.0, decision tree , neural-network for building a credit scoring model.Out of these techniques C5.0 was considered as the best model for classifying credit card applicants .
West [7] has compared the accuracy of five neural network models such as fuzzy adaptive resonance multilayer perceptron, radial basis, learning vector quantization, and mixture-of-experts. Out of these models mixture-of experts had the highest accuracy but these models are not appropriate for large datasets.
Gosain et al [8] has made use of over sampling methods such as SMOTE,
Prediction Of Default Credit Card Users Using
Data Mining Techniques
Borderline-SMOTE, ADASYN, Safe-level SMOTE in order to solve the problem of imbalance in the class. After balancing the class various classifiers are applied to the data to observe the performance metrics of these oversampling methods. Results show that as Safe-level SMOTE create large number of minority instance near safe level therefore its accuracy is better than other oversampling techniques.
Purnami et al [9] previously in many researcher papers SMOTE and tomek links were used for balancing of the data. In Synthetic minority oversampling method the balancing is done by increasing the minority sample class whereas in Tomek link method the number of majority class is reduced so that it becomes equal to the minority class. In this paper, both SMOTE and tomek Link methods are combined together along with svm classification method. It was found at that the accuracy when both the sampling techniques were combined were better as compared to when they were individually tested.
Koutanaei et al [10] has proposed an hybrid data model were feature selection as well as algorithm classification is done in 3 different stages. In the first stage the normal preprocessing is done. During second and third stage four feature selection algorithms such as genetic algorithm, information gain ratio and relief attribute evaluation have been used . Here feature selection methods parameters are set based on the accuracy of different classification algorithms and then the feature selection method which is the best for a particular classification is used. This hybrid model gave results which had good accuracy.
Viswanathan et al [11] in this paper comparison between neural network, logistic regression and credit scoring methodology takes place to demonstrate the ability of credit scoring models for an Indian based microfinance firm in order to predict default . The strengths and problems related to neural network and logistic regression has been discussed and based on these discussions it was concluded that logistic regression model was more suitable as compared to neural network for prediction purpose
Singh et al [12] in this paper feature selection and feature reduction techniques were used to study the abilities of base classifiers. Feature selection methods such as Feature filter methods and Wrapper based methods were used to get minimum number of features by removing unwanted features. Then these features were applied to different machine learning algorithms out of which SVM had greatest accuracy. Xiao et al [13] for improving prediction of recovery rates different machine learning and statistical methods were evaluated. Here the LS-SVC has been applied in 2 different ways. Firstly the LS-SVM has been directly used for prediction purpose and its results are compared with other models and it was found at that SVM could predict better as compared to logistic regression method. Secondly the SVM was combined with two-stage modeling were least squares support vector classifiers were used for classifying 0 and 1 recovery rates. It basically said that choosing correct algorithm during the separation stage is more important than choosing correct regression technique.
Xu et al [14] has proposed an improved prediction model called SPR-RIPPER which is based on RIPPER algorithm which is used to predict default credit cards. This algorithm
helps in increasing the accuracy and interpretability of the model. Feature selection methods such as RELIEF method is used for removing certain features which are not useful. The problem caused by imbalance in the dataset is solved by using SMOTE algorithm which oversamples the minority class. The models accuracy and interpretability is found out by comparing the SRIPPER model with the existing models.
Yeh et al [15] many researches have been done on predicting accuracy of the default cards but in this paper real probability of credit cards which have defaulted is found out by using Sorting smoothing method. The accuracy of classification is found by comparing accuracies of 6 data mining methods. Even though there is similarity in the error rates of these methods still out of these six neural networks had the highest accuracy.
Sain et al [16] for prediction purpose the performance of different classifiers differ when applied on different databases and situations. In this paper the prediction model is created by using Support vector machine algorithm on six different databases from different domains and it was then compared with different machine learning and statistical methods. Results showed that Support vector machine performed slightly better that statistical methods.
III. METHODOLOGY
If The diagram for the proposed methodology is shown in Fig 1. The first step to be done is collection of data. After the data has been collected we pre-process it by cleaning the data.
Later the data set is divided into training and testing data and later different data mining techniques are used on it. Then balancing techniques such as SMOTE and ADASYN are applied on the training data and then they are classified with the help of machine learning algorithm in order to predict if the credit card is defaulted or not. At the end the accuracy of this model is found out.
A. Collection of dataset
The dataset which we are using for our experiment is downloded from UCI repository website. Taiwan‘s credit card user data has been used for in this paper. This dataset consists a total of 24 attributes and 3000 instances. For predicting whether a credit card is defaulted or not these dataset contains a binary variable which is labeled as 1 if the card is defaulted otherwise it is labeled 0. The remaining variables are explanatory variables which helps in prediction purpose.
B. Data Cleaning
Data pre-processing operations are done to enhance the quality of default credit datasets and to evaluate misrepresentation of data. In the data preprocessing the first step to be done is cleaning of the data. First we check for null values and then we check if some categories of variables are mislabeled or undocumented. Then the categories are labeled correctly so that it does not lead to overfitting of models in future. Renaming of certain variables also takes place so that it is simpler to understand for
Fig. 1. Design for prediction of default cards C. Oversampling Methods
Many researchers have said that the features and data are very important elements in machine learning, the classification algorithms are important but the data is considered more important. Therefore the processing of data is very important in machine learning.
In our dataset the total number of defaulted credit cards is very small as compared to total number of non-defaulted credit cards. The class which has less number of instances is known as minority class and the class which has more number of instances are known as majority class. Due to imbalance of the data many classification algorithms tend to give more importance to the majority class which leads to decrease in classification accuracy of the minority class which in turn leads to decrease in the models interpretability. To solve this problem of imbalance for our model we are making use of oversampling class methods such as SMOTE and ADASYN.
a. SMOTE:
SMOTE (Synthetic Minority oversampling approach) is an oversampling approach in which rather than replacing the existing samples here new samples are synthetically generated. The algorithm for SMOTE is:
1. We find the k-nearest neighbors for our minority class instance Y by applying Euclidean distance to find the distance between the instance Y and others in the same class.
2. Based on the sampling ratio, an instance among k- nearest neighbors is randomly selected. Here Yn, represents
the selected nearest samples which vary from 1 to sampling ratio(N).
3. Here the new synthetic data is created by taking the difference between chosen k-nearest neighbor and current data and then multiplying it with the random numbers which vary from 0 to 1
Ysyn = Y+ ( Yn – Y ) * rand - (1)
Here rand - stands for random numbers. The steps for executing this algorithm can be seen in Fig 2.
Fig. 2. SMOTE algorithm for balancing of data
b. ADASYN:
Adaptive synthetic minority oversampling technique is considered as modification to the SMOTE algorithm. Here the minority samples are created on the basis of density distribution method. The difference between Smote and ADASYN is that in SMOTE the total number of synthetic data that has been created will always be equal for every minority instance. However the ADASYN algorithm makes use of density function which decides how many number of synthetic data has to be generated for every minority instance. This algorithm provides different weights to different minority samples to create synthetic data. ADASYN is basically mostly used for creating synthetic data samples for the minority class samples which were difficult to learn.
D. Classification Methods
1) Support Vector machines:
A Support Vector Machine (SVM) is a supervised model which can be used for regression as well as classification tasks. The algorithms associated with SVM are used to recognize and analyze different patterns for the purpose of classification. The fundamental idea behind SVM is finding an optimal hyperplane that could separate two classes instances which are support vectors. But as some data are linearly inseperable new concept of kernel functions was introduced. This functions
are used to transform a low dimensional input space into high dimension input space Collection of data
Pre-Processing
Training data Testing data
Balancing (SMOTE and
ADASYN)
Classification
Evaluation
Results
Choose an minority class instance
Choose an minority class instance Choose an minority class
instance Choose an minority class
instance
Find k-nearest neighbor for this instance
Select an instance among k-nearest neighbor
randomly
which means that it is used to solve the problem of linearly inseperable data. In this paper we are making use of a kernal function know as radial basis function (RBF) to solve complex problems. The RBF kernel makes use of two important parameters such as C and gamma where C is the penalty. parameter which by default is kept as 1.0 and gamma is a kernel coefficient.
2) K Nearest Neighbor(KNN):
K Nearest Neighbor is onother supervised learning method is used for classification of non-defaulted and defaulted credit card. In this method a new data point is predicted on the basis of the data set which is already available. In the KNN model the letter ‗K‘ is the total number of nearest neighbours. If a large number of ‗K‘ neighbours of the new class belong to particular class then other newly predicted data points will also be places in that class. The distance between every single data point in the class and the new predicted data point can be calculated using Manhattan, Hamming distance and Euclidean distance formula. Here we are taking K=5.
3) Decision Trees:
This is the most frequently used algorithm for credit scoring structures. A decision tree consists of several internal nodes that perform multiple tests on input variables and attributes to divide the data of the dataset into smaller datasets. It also consists of leaf nodes which assigns a class to each of the observations which we got after performing various tests. This process continues until the criteria which is required is met.
4) Random Forests:
Random forests are a group of regression or classification trees that are trained on the boot samples of training data by making using of random feature selection for the purpose of tree generation. After the process of tree gene every tree has to vote for the popular class. This process of tree voting is called as Random forest.
IV. RESULTSANDDISCUSSIONS
We first split our dataset into training and testing data where training data contains 80% of the original data set. Both the balancing techniques SMOTE and ADASYN are applied on the training dataset. We balance the data as the number of credit cards which has defaulted are small as compared to total number of non-defaulted credit cards as seen in the Table 1.
Table I: Training samples
Samples in training dataset
Defaulted 5299
Non-defaulted 18701
The smote algorithm is applied on dataset so that minority sample which is the defaulted cards of the dataset becomes equal to the majority class. This algorithm generates new synthetic data by equalizing both default and non-default samples as shown in TABLE 2.
Table II: After applying SMOTE
Number of samples
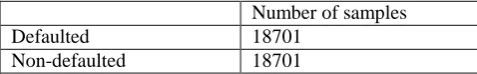
Defaulted 18701
Non-defaulted 18701
Both ADASYN and SMOTE makes use of same formula for generating synthetic sample. The only difference is that this method creates more synthetic data for the instances that were difficult to learn based on the weights which are given to minority instances. After applying this algorithm we get the following results
Table III: After applying ADASYN
Number of samples
Defaulted 18701
Non-defaulted 18968
Comparison between machine learning models such as Support Vector machine, Decision trees, K-nearest neighbours and random forest has been done to find out the best model for prediction of defaulted and non-defaulted users. The algorithms performance is measured using different performance metrics such as Accuracy, Precision and ROC value. These algorithms are first applied on the original dataset which is imbalanced. The results of these algorithms are shown in Table IV.
[image:4.595.310.549.50.87.2]Table IV: Performance metrics of normal dataset
Table V and Table VI shows the performance metrics of the algorithms after sampling methods such as ADASYN and SMOTE have been applied on the data sets.
Table V:Performance metrics of algorithms after applying SMOTE
Accuracy Precision Recall ROC
SVM 0.7748 0.4363 0.0359 0.5113
KNN 0.6043 0.2849 0.5138 0.5720
Decision Tree
0.6810 0.3406 0.4614 0.6027
Random forest
0.7698 0.4817 0.4338 0.6499
Accuracy Precision Recall ROC
SVM 0.7773 0.5217 0.0089 0.5033
KNN 0.7508 0.3820 0.1914 0.5513
Decision Tree
0.7260 0.3883 0.3994 0.6095
Random forest
[image:4.595.317.551.392.506.2]Table VI: Performance metrics of algorithms after applying ADASYN
Accuracy Precision Recall ROC
SVM 0.7733 0.4094 0.0388 0.5114
KNN 0.5798 0.2784 0.5564 0.5715
Decision Tree
0.6746 0.3390 0.4846 0.6069
Random forest
[image:5.595.47.283.269.553.2]0.7540 0.4467 0.4360 0.6406
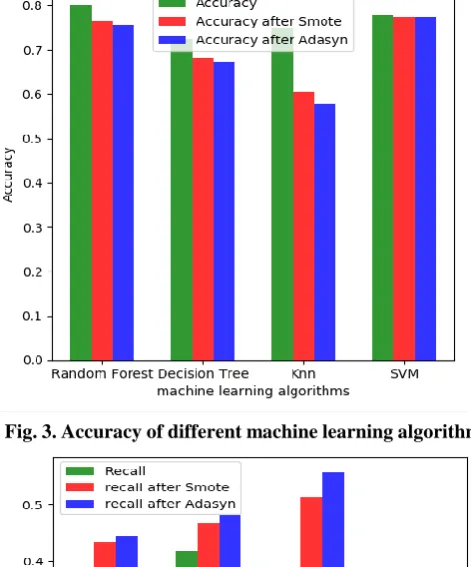
Fig. 3 and 4 shows the accuracy of different machine learning algorithms after balancing and before balancing the data. It also compares the algorithms on the basis of recall values
Fig. 3. Accuracy of different machine learning algorithm
Fig. 4. Recall value of different machine learning algorithms
From the graphs and table‘s we can see that show that the accuracy of the models when applied to the unbalanced dataset is quite higher than the accuracy of balanced dataset. Out of the four machine learning models Random Forests had highest accuracy for unbalanced data and SVM had highest accuracy when it was applied to the balance data. After
balancing the dataset using SMOTE and ADASYN it can be seen that the Recall and ROC values have both increased.
V. CONCLUSION
In this research, first we clean the data during the pre- processing stage to remove undocumented and mislabeled categories of variables to avoid overfitting of model. Later oversampling techniques such as SMOTE and ADASYN are used to balance the data. Machine learning methods such as Support Vector Machines, Decision trees, K-nearest neighbours and random forest have been used for classification purpose. Here we have compared the performance of four classification methods by applying it on both balanced and unbalanced dataset. Later on comparison is also done between the two sampling methods.
REFERENCE
1. Paulius Danenas,Gintautas Garsva, ―Selection of Support Vector
Machines based classifiers for credit risk domain‖, Expert Systems with Applications,val. 42, pp .3194-3204,2015.
2. Pu Xu, Zhijun Ding, MeiQin Pan, ―An improved credit card users
default prediction model based on RIPPER‖, 13th International Conference on Natural Computation, Fuzzy Systems and Knowledge Discovery(ICNC-FSKD), pp. 1279 – 1282, 2017.
3. Ruan Ling-ying, "An empirical study of feature extraction in the
analysis of credit card risk‖, 6th IEEE Joint International Information Technology and Artificial Intelligence Conference",pp. 84-86, 2011.
4. Yap Bee Wah , Irma Rohaiza Ibrahim, ―Using data mining predictive
models to classify credit card applicants‖. International Conference on Advanced Information Management and Service (IMS), pp. 394 – 398, 2010.
5. Florentin Butaru, Qingqing Chen, Brian Clarka, Sanmay Das, Andrew
W.Loc, Akhtar Siddique, "Risk and risk management in the credit card industry", Journal of Banking & Finance, vol 72, pp. 218-239, 2016 .
6. Wei Li, Jibiao Liao,"An Empirical Study on Credit Scoring Model for
Credit Card by Using Data Mining Technology", Seventh International Conference on Computational Intelligence and Security,pp. 1279-1282, 2011.
7. David West, "Neural network credit scoring models",Computers & Operations Research,vol 27 ,pp. 1131-1152, 2000.
8. Anjana Gosain,Saanchi Sardana, ―Handling Class Imbalance Problem
using Oversampling Techniques: A Review‖, International Conference on Advances in Computing, Communications and Informatics (ICACCI), pp. 79 – 85, 2017.
9. Hartayuni Sain, Santi Wulan Purnami, ―Combine Sampling Support
Vector Machine for Imbalanced Data Classification‖, The Third Information Systems International Conference, vol 72, pp. 59-66, 2015.
10. Fatemeh Nemati Koutanaei ,Hedieh Sajedi, Mohammad Khanbabaei,
―A hybrid data mining model of feature selection algorithms and ensemble learning classifiers for credit scoring‖, Journal of Retailing and Consumer Services, vol 27, pp. 11–23, 2015.
11. P. K. Viswanathan, S. K. Shanthi, ‖Modelling Credit Default in
Microfinance—An Indian Case Study‖, Journal of Emerging Market Finance, pp. 1–13, 2017.
12. B. Emil Richard Singh, E. Sivasankar, ―Risk analysis in Electronic
payments and settlement system using Dimensionality reduction techniques‖, 8th International Conference on Cloud Computing, Data Science & Engineering, pp. 14 – 19, 2018.
13. Yao Xiao, Jonathan Crook, Galina Andreeva, ―Enhancing Two-Stage
Modelling Methodology for Loss Given Default with Support Vector Machines‖, European Journal of Operational Research, vol 263, pp. 679-689 , 2017.
14. Pu Xu, Zhijun Ding, MeiQin Pan, ―A hybrid interpretable credit card users default prediction model based on RIPPER‖, Concurrency Computation Practise And Experience, 2018.
15. I-ChengYeh,Che-hui Lien,‖The comparisons of data mining techniques
16. Hartayuni Sain, Santi Wulan Purnami, ―Combine Sampling Support Vector Machine for Imbalanced Data Classification‖, Procedia Computer Science, vol 72, pp. 59-66,2015,.
AUTHORSPROFILE
Akanksha Shankar Shetty, has finished B.E in
(Computer Science and Engineering) from
NMAMIT Institute of Technology, Karnataka and pursuing M.E (Computer Science and Engineering) from, Manipal Academy of Higher Education, Karnataka.