Abstract: Due to increased market competition in recent years, Indian plastic processing industries have realized their prospects of effective management of the supply chain to achieve cost-efficient operations with environment and social sustainability that can only be achieved through continuous improvement techniques. Lean tools and technique for managing the supply chain looks like an inevitable trend in enhancing the performance of plastic processing industries; while, performance evaluation is crucial in green supply chain implementation. Based on the management of green supply chain attributes, nineteen key performance metrics are prioritized and classified among four performance categories of economic, environmental, social and health & safety. A fuzzy-based method of evaluation of performance is proposed in this paper to assess the performance of lean tool based management of plastic supply chain. Supervisors of supply chain can anticipate aggregate performance of the cost and environment sustainable plastic supply chain. Sustainable strategies could be managed by considering dissimilar weights for diverse supply chain state of affairs.
Index Terms: LTBGSC, LTBGSCM, Performance metrics, Supply chain management, Thermoforming
I. INTRODUCTION
Supply chains are now seen as extended business activities that link companies in a variety of locations and make partners worthy of sustainable edge. In the management of routine operations, nowadays, the prospects for effective management of supply chain have been realized by companies [1]. Although, many enterprises eventually fail to design and develop highly effective performance measures and even failed to identify the metrics required to accomplish integrated management of supply chain. Measuring the quality of business process can assist in proper understanding of concerned activities across the supply chain, influencing motives of business players and enhancing its aggregate performance [2]. So as to effectively accomplish the supply chain objective of improving productivity and simultaneously conserving the environment and social values as compared to other companies, entire supply chain is required to get involved in continually improving the practices as well as developing sustainable methods. Consequently, it is essential to know the aggregate performance of the supply chain so as
Revised Manuscript Received on June 05, 2019
Yogesh P. Deshmukh, Assistant Professor, Department of Mechanical Engineering, G. H. Raisoni College of Engineering & Management, Amravati, (M.S.), India
Dr. Atul B. Borade, Principal, Government Polytechnic Institute, Vikramgad, Palghar, (M.S.), India
to know just how supply chains compete [3].
A proper planning involving supply chain policy and sustainable performance could be a significant characteristic as regards to the supply chain measures. [4] noticed that the choice of sustainable supply chain policy had an effect on performance of the supply chain. They also asserted that the strategic fit assuming the degree of relationship between sustainable policy, situation, leadership and organizational culture can develop healthier business performance. Thus, to obtain an impressive performance measures, the sustainable performance of a supply chain should be lined up together with the role of the supply chain players and market policy.
To stay sustainable in the increasingly worldwide market, lean philosophy is among the many initiatives which companies all over the world are been adopting [5], [6], [7]. The primary driving force leading to follow lean tools and techniques in greening the supply chain is to form an efficient and streamlined system that can control waste and pollutant releases at all levels of supply chain which satisfies the customers and the society at large [5], [7]. Lean does apply in most supply chains, especially those wanting to enhance performance by minimizing process waste and pollutant releases. For instance, cost and environment sustainable green supply chains could gain from using lean tools and techniques to get rid of all sorts of waste, and also minimize costs [8].
It is critical to formulate the supply chain performance measurement method because of complexities between supply chain policy, business competitiveness and supply chain measures. [9] observed that conventional measures which tend to measure financial metrics did not incorporate intangible indicators. To cope-up with qualitative and intangible measures fuzzy modeling technique is best suitable and is widely adopted in different aspects of supply chain management. Fuzzy oriented research on supply chain measurement can be traced through several studies in the literature. Performance metrics in substantial numbers can be considered in fuzzy modeling while considering the complexity of supply chain in terms of different elements and processes [10]. Therefore, a comprehensive framework for performance measures and also a fuzzy-based performance assessment method for entire supply chain measurement is crucial to deal with these challenges. Although, there exist a wide published research on supply chain performance measurement, it is still short of an effective
performance metrics and measurement technique for two reasons, a) while
Green Practices in the Supply Chain and their
impact on Its Performance: In Perspective of
Indian Plastic Processing Industry
measuring the performance of supply chain which is cost and environment sustainable, strategic alignment is missing amongst sustainable policy and performance metrics [11], [12] and b) shortcomings while taking into account the linguistic terms as well as uncertainties involved in performance evaluation methods, particularly for lean tool based green supply chain [13]. Thus, the research issue dealt within this paper is, assessing lean characteristics and sustainable supply chain policies by consolidating the linkages between implementation of lean tools, green supply chain performance measures with sustainable policy, evaluation method and market position.
II. LITERATUREREVIEW
A. Performance Metrics and Measurement in SCM Performance measurement is described as the procedure of gauging the effectiveness along with efficiency of measures wherein measurement leads to quantification while action directs the performance [11]. Performance measurement systems are the comprehensive set of metrics that had to evaluate actions in terms of its efficiency and effectiveness [14], [15]. [16] identified four attributes for a good performance measurement system: all inclusiveness, its consistency, measurability and universality. The intent behind performance measurement of an organization is to (a) enable an entity to recognize it’s processes as well as to verify how much they know or even disclose anything they don't understand; (b) determine where problems, pollutant releases, waste, bottlenecks, etc. are and just where improvements are necessary; (c) ensure there is no place for emotion, faith, or intuition in decision making, which should be solely based on facts; (d) planned improvements should be shown after actual happening; (e) identify whether consumers and societal requirements are met; and (f) specify success [17]. A performance measurement system is composed of substantial number of metrics or individual performance measures. The challenging roll has been to explore key performance
measures linked with an organizational value adding segments. Despite the wide availability of literature, many important limitations are yet to be addressed by the researchers:
a. Proper alignment between performance measurement system and strategic goals is lagging [18].
b. Systematic approach in prioritizing the measures and metrics is required [5].
c. How to maintain consistency in performance measurement system while dealing with the dynamic environments and ever changing strategies? [9], [19].
Supply chain performance is relevant to sustainable strategies because supply chain competitiveness should relate to organisational goals. [32] remarked performance measurement system as a function of communicating the strategies and controlling the performance. Sustainable policy of a company can be defined relative to its competing companies in the form of consumer desires it tries to fulfill by its services and products [4]. Therefore, the basis for defining company goals is its sustainable policy. Sustainable strategies can be classified into: economic, environment, social and health & safety [4], [20]. To fulfill organizational objectives, supply chain performance measurement system needs proper alignment with each one of these sustainable strategies. To know the competitiveness of the supply chain, Understanding the entire supply chain performance is important.
[image:2.595.61.518.533.676.2]In the current scenario researchers like [21], [22] developed a flexible, systemic and balanced performance measurement systems to counter justify these arguments. Probably the best accepted of these is considering the different phases of life cycle as plan, source, make, deliver and return [23]. Integration of all these phases has been expressed as an organized approach to identify, evaluate and monitor the performance of supply chain [22].
Figure 1: Reference model for supply chain operation [33] These phases have the potential to combine different
components of industrial engineering and most important practices into a single framework. Thus, from the view point of manufacturer’s suppliers continued through distributor - dealer network upto the customers, supply chain management can be described as combined phases of life cycle aligned
with company’s operational policy (see Figure 1).
Supply chain with the basic need for sustainable performance and its configuration with the market policy is discussed here. Above
framework of performance metrics that could be aligned to the sustainable strategies and state-of-the-art manufacturing practices. And therefore, to achieve the synchronization between company's strategic goals and performance measurement system, the effects of best practices on performance metrics must be addressed. Cost and environment sustainable supply chains similar to lean tool based green supply chains and corresponding tools and techniques for improved performance are discussed at length in the following section.
B. Green Supply Chain Improvement Tools and Techniques
The term, “Green” means adopting best practices and series of activities to eliminate waste and pollutant releases, bring down non value added operations and develop value added practices. A green supply chain management usually means the identification of waste and pollutant releases across the supply chain stream and taking measures to eliminate them [6].
[image:3.595.305.548.194.315.2]Lean concept in GSCM has experienced significant positive impacts on work productivity in various industries. Various phases of the life cycle can be utilized with the standard metrics to evaluate the performance of process and management practices which create bright performance. In this research five basic phases of the life cycle is actually the starting framework used to determine the best possible metrics to assess supply chain greenness and, because of this, the effects of various lean tools and techniques over five basic processes of life cycle are listed in Table 1.
Table 1:Effects of different lean tools and techniques over basic supply chain phases
In Table 1, we identified the effects of different lean tools over various tiers of supply chain with respective author references. Most authors have tried to find out about the potential effects of lean tools on five basic processes of supply chain. For example, [2], [4], [7], pointed out that Cause and Effect, Voice of Customer (VOC) and Kaizen had an impact on the plan stage by improving productivity, reducing waste and pollutant releases across the supply chain. Likewise, the effects of other lean tools on five different basic processes of supply chain are shown in Table 1. Later these effects are analysed to investigate the impact of lean tools on performance metrics which proves noteworthy to develop the best possible metrics
for green supply chain study. It thus becomes obvious that the advantages of lean tools can be measured using supply chain performance metrics and can also be used based on various supply chain strategies. Lean tools are applicable in most supply chains, especially those seeking to enhance performance by reducing waste and pollutant releases. For instance, cost and environment sustainable lean tool based green supply chains could gain by reducing costs through waste removal and enhance corporate image by curbing the pollutant releases. The relation between the key factors and performance of supply chain is proposed in Figure2.
[image:3.595.49.269.462.639.2]
Figure 2: Conceptual framework of the research
In addition to above discussion it is recommended for more assessment of relations between, economic perspective, environmental concerns, social aspects, health and safety considerations and green supply chain performance. In order to determine the relation between these core factors, it would be important for cost and environment sustainable supply chain to investigate the hypothesises as under:
Hypothesis 1: Economic aspects influence supply chain performance.
Hypothesis 2: A holistic approach in managing the environmental impacts at upstream and downstream value chain stages improves the performance of supply chain.
Hypothesis 3: Workable solutions to improve the social conditions in the vulnerable areas affects supply chain performance positively.
Hypothesis 4: Promotion of occupational health and safety (OSH) requirements as an element of people dimension influences supply chain performance positively.
Performance metrics has both quantitative as well as qualitative measures. Qualitative metrics include linguistic behaviors which also comprises with non- financial measures. In a situation of uncertainty in decision making, fuzzy would be an appropriate method which enables modeling of a number of performance metrics across several processes and elements of a supply chain. Earlier description was based upon the effects of lean tools and techniques on these metrics and will be quantified by utilizing fuzzy based performance evaluation technique in the following section. Sustainable strategies for various supply chains based on products and processes will also be used
performance measurement method will be used to evaluate the effect of sustainable strategies and different lean tools on the aggregate performance of supply chain.
III. PROPOSEDPERFORMANCEEVALUATION
METHOD A. Select Supply Chain Optimal Metrics
For effective and efficient performance evaluation of a supply chain, measurement objectives should represent the organizational objectives and the selected metrics must reflect
a balance among financial as well as non-financial measures which can be correlated to strategic and operational levels of managerial decision making [8]. For more effectiveness in performance evaluation it is essential to reduce the relatively large number of established performance metrics into a few optimal metrics.
[image:4.595.51.547.197.347.2]Based on the prevailing research, the best possible metrics are proposed by us (see figure 3) to evaluate the overall performance of cost and environment sustainable supply chain; for eg. [10], [27]. [2]recommended classification of
Figure 3: Metrics for evaluation of cost and environment sustainable supply chain the performance measures in the form of economic,
environment, social, health & safety using the five basic processes of supply chain. In this research, all the metrics are aligned according to five different processes of supply chain to evaluate individual performances at each process level and also the aggregate performance of supply chain.
The proposed metrics consists of crisp and linguistic values. Fuzzy enables modeling of large proportion of performance metrics across several stages of a supply chain. Initially we transform all the quantitative metric values in terms of triangular fuzzy numbers while qualitative metrics are expressed in linguistic terms. Performance of whole supply chain is evaluated by fuzzy TOPSIS after the conversion of both quantitative and qualitative metric values into their fuzzy numbers. After the conversion of both quantitative and qualitative metric values into their fuzzy numbers, performance of whole supply chain is evaluated by fuzzy TOPSIS taking into account the distance of non- lean and lean tools based green supply chain conditions from positive and negative ideal solutions. The particulars of fuzzy set theory, generation of triangular fuzzy number and details on fuzzy TOPSIS method are elaborated in the following sections.
B. Fuzzy Set Theory
Fuzzy set theory was proposed by [28] and it was first applied in control systems by [29]. This theory is basically concerned with the logic to take into account the vagueness in human thinking and emulate it with suitable mathematical tools. The process by which objects in a universal set X are worked out to be either members or non-members of a crisp set is defined by a discrimination function. For a particular crisp set A, this function allocates a value to every x
X such that,if x
Aif x
AWhere, X is the universal set given in a particular problem which assumes values in the range from 0 to 1.
Figure 4: Triangular fuzzy number, A
C. Convert Metric Values into Triangular Fuzzy Number
All the metric values are required to be converted to triangular fuzzy numbers. First task is to collect the values of every individual metric before and after implementation of LTBGSCM. Assuming
i
1, 2,...
m
represents the varied situations of the supply chain before and after implementation of LTBGSCM.j
1, 2,...
n
represents different performance categories of the supply chain andk
1, 2,...
t
represents [image:4.595.337.513.464.586.2]1 2
( , ,... )
mI
i i
i
;J
( ,
j j
1 2,... )
j
n ;K
( ,
k k
1 2,... )
k
t .Assuming 1
,
2,....
m n t m n t m n t
i j k i j k i j k t
x
x
x
, are different values ofd percentage of in-house recycling (per month) of plastic scrap for metric kt under situation im and category jn. Here kt =
percentage of process waste recycled, jn = economic, im = after
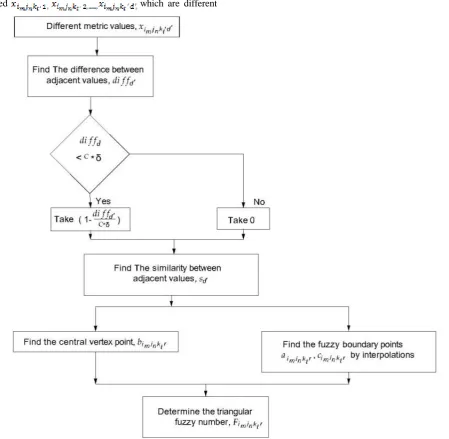
LTBGSCM implementation. Conversion of performance metrics values into quantitative as well as qualitative triangular fuzzy number will be discussed in the following two sub-sections. For conversion of metric values into triangular fuzzy numbers an algorithm is discussed as under and shown in figure 5.
D. Triangular Fuzzy Number for Quantitative Metric Values
Data required in terms of quantitative metrics is to be collected from relevant supply chain members. Since we
assumed which are different
values of
d
percentage of process waste recycling for metricunder situation
i
m and criteriaj
n , these values areconverted into triangular fuzzy number with the application of following algorithm.
E. Triangular fuzzy number for qualitative metric values
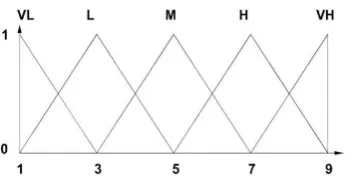
To generate qualitative metrics we make use of triangular fuzzy numbers derived from different triangular fuzzy linguistic terms. In this case the linguistic terms are expressed by an interval of two units of triangular membership functions
[image:5.595.73.523.258.697.2]as given in Table 2, where
Figure 5: Model algorithms based on metric values to evaluate the triangular fuzzy
" " ,
m n t
i j k r
a
" "m n t
i j k r
b
and " "m n t
i j k r
c
are the three nodes oflinguistic terms representing qualitative metrics.
Figure 6: Triangular fuzzy numbers for linguistic terms Table 2: Linguistic terms for qualitative metrics and
corresponding triangular numbers
Triangular fuzzy numbers which are generated with the above method will be considered in Fuzzy TOPSIS method for the performance evaluation of different situations in supply chain. While in Fuzzy TOPSIS method performance is obtained by measuring their distances from positive and negative ideal solutions.
F. Fuzzy TOPSIS
TOPSIS (Technique for Order Preference by Similarity to Ideal Situation) is a multi criteria group decision making method. Fuzzy TOPSIS proposed by Ching-Lai Hwang and Yoon is a method that can assist in objective and methodical evaluation of alternatives against multiple criteria. Fuzzy TOPSIS approach is to identify the positive ideal solution and negative ideal solution. The Fuzzy positive ideal solution (FPIS) maximizes the benefit metrics but minimizes the cost metrics, while the Fuzzy negative ideal solution (FNIS) maximizes the cost metrics but minimizes the benefit metrics. The best performance value for each alternative is the one which is nearest to the positive ideal solution and farthest from the negative ideal solution. A detailed description on fuzzy TOPSIS method by several researchers [13], [30] is adapted and steps involved in fuzzy TOPSIS are as presented below.
a.Normalize triangular fuzzy number
While dealing with the quantitative and qualitative metrics, two more important types of metrics to be dealt in are cost and benefit metrics. Benefit entails more the better whereas cost means less the better. To compare the metrics with each other, they need to be normalized for finding the performance of supply chain. Normalisation methods for cost and benefit metrics are as follows:
= and
(Benefit metrics) (1)
= and
(Cost metrics) (2)
b.Prioritize sustainable policy over metric category As regards to different sustainable strategies and stated company objective towards economic and environment sustainability in perspective of plastic moulding, we exercise relative importance to performance categories. So, the relative weight vector which is considered for performance category is defined as,
1 2 3 4
...
m n m m m m m n
i j i j i j i j i j i j
W u w
w
w
w
w
(3)Where, u = number of weight vector for metric category,
and
1
1
U
u u
w
, where ,w
u
[0,1]
c.Compute weighted normalized fuzzy value
The weighted normalized fuzzy value of metrics is calculated by taking the product of sustainable priority weights ( ) of metric category and the normalized triangular fuzzy numbers ( ) as,
(4)
= (
Where, v = number of weighted fuzzy numbers
d. Identify fuzzy positive ideal solution (FPIS) and fuzzy negative ideal solution (FNIS)
After calculating the weighted normalized fuzzy value ( ), FPIS and FNIS can be calculated by using following equations,
(FPIS) = max ( (5)
(FNIS) = min ( (6)
where, are FPIS and FNIS for performance metrics .
e. Calculate the distance of non-lean tool based green supply chain and lean tool based green supply chain situation from FPIS and FNIS
[image:6.595.48.226.71.163.2]following equations are used;
2 + 2 +
2 ` (7)
2 + 2 +
2 (8)
Where, are the distance measurements of supply chain situations from FPIS and FNIS for performance metric
.
f.Compute the closeness coefficients for each supply chain situation
The closeness coefficient (C ) signifies the distances of b o t h t h e supply chain situations from the FPIS ( and FNIS ( simultaneously. Calculation of C value for each supply chain situations is done by using,
g. Calculate the performance of non- lean and lean supply chain
Since, closeness coefficient evaluates the distance of each supply chain situation between FPIS and FNIS; it gives the value nearest to FPIS and farthest to FNIS. So, the performance value for b o t h supply chain situations (before and after implementation of lean tool based green supply chain management) can be computed by,
IV. ACASEEXAMPLE
We have selected a thermoforming industry for our case study. It produces thin-gauge, single use food packaging like cups, plates and containers. Thermoforming industry is selected to evaluate green supply chain performance as lean tools and techniques are being implemented by this supply chain. Thermoforming is indeed a sustainable technology. Thermoformed food packaging is particularly produced from high impact polystyrene material.
It competes with roll-sheet steel, expanded polystyrene foam, paper, paperboard, plastic-coated paper, aluminum foil and paper pulp considering thin gauge forming [31]. Thermoforming process technology also competes with injection molding, plastics extrusion, stretch-blow molding, compression molding and injection-blow molding. There are many advantages of thermoforming over other moulding technologies; molds are less expensive as compared to
injection molds being single sided; broad range of mold materials can be used; quite shorter cycle time and wide variety of polymer films can be processed.
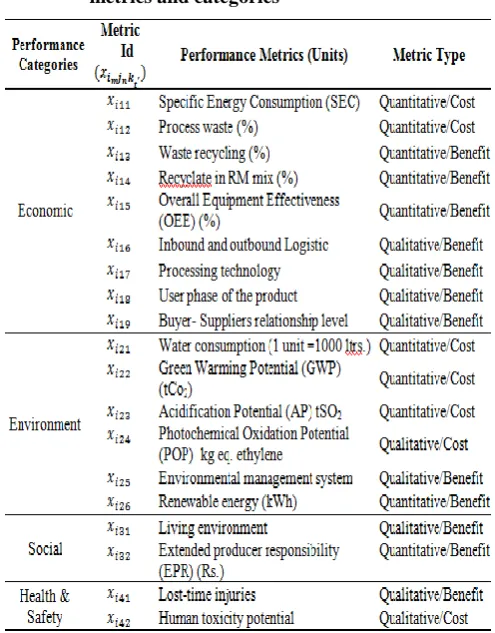
Table 3: "Thermoforming" supply chain performance metrics and categories
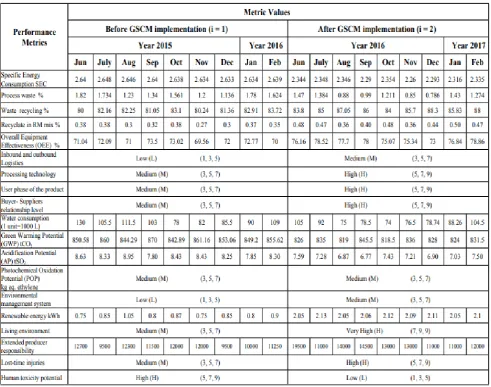
[image:7.595.47.268.63.190.2]Aluminum being lightweight and relatively inexpensive is mostly preferred as mold material; it is easy to cast and machine and also high in thermal conductivity. Processing temperatures and pressures are low in thermoforming process. Thermoformed parts has extremely high ratio of surface area to wall thickness [31].This supply chain is a multi-stage chain of supplier, manufacturer, dealer-distributor network, end users, and end-of-use waste recyclers. This supply chain is selected to evaluate its green performance. As we mentioned earlier, cost a n d e n v i r o n m e n t sustainable or green supply chain had four major performance categories - economic, environmental, social, health and safety. Metrics could be of two types; one is quantitative metric which could be measured in numbers and qualitative metric which is in linguistic terms. Benefit metric is meant for more the better while cost metric is meant for less the better. Different performance metrics are specified in third column of Table 3. Different values for every performance metrics were collected and calculated for the supply chain strategies of before and after implementation of LTBGSCM.
[image:7.595.305.553.117.434.2]Later, we thoroughly examined the entire supply chain and different lean tools were employed to improve the ratings of performance metrics as also the supply chain performance. Table 3 presents different quantitative metrics with their monthly average values. As, we have assessed two supply chain situations; therefore values for two different situations are measured. By using algorithms given in Figure 5, quantitative metrics are converted to triangular fuzzy numbers (TFN). In the same way, by using the values shown in Table 2 all of the qualitative values are collected and readily converted to TFN. At last, by following equations 1 to 10, the performance of pre and post implementation of GSCM (see table 4) has been calculated as 40.13 % and 49.37 %.
V. DISCUSSION&CONCLUSION
In view of the fact that, a supply chain by its own is an integrated process which involves supply of raw materials, manufacturing the products, dispatch to customers through distribution channel and fetching recycled end-of-use waste, the intricacy of the supply chain occurs due to the number of layers in the chain. In view of this intricacy in an ordinary supply chain, choosing suitable performance metrics and the performance measurement model intended for the analysis of supply chain is a critical task. At first, the linkages between basic phases of supply chain and effects of various lean tools have been ascertained. For evaluating the supply chain performance, fuzzy TOPSIS method is implemented and
results prove that performance of lean tools based green supply chain management (LTBGSCM) is better than without green. The results also explain that, LTBGSCM with its tools and techniques influence the performance of supply chain positively. Similarly, performance of the supply chain also influences the sustainable policy positively. Aggregate performance of the supply chain can be enhanced by the managers by improving the sustainable strategies across the supply chain. Furthermore, performance of the lean tools based green supply chain (LTBGSC) can be evaluated and predicted by the managers. Notably this offers a method for measuring aggregate performance of the supply chain instead of measuring the performance of a particular business unit. By understanding the impact of lean on the overall performance of the supply chain, company managers are facilitated in making better informed decisions. Managers would be able to demonstrate the performance benefits obtained due to introduction of LTBGSCM to most of the supply chain members. By revealing the aggregate benefit it can increase the acceptance of such improvement initiatives. Fuzzy is also used to point out which areas will benefit, for example economic or environment from implementation of green initiatives; thereby stressing more on economic and environment metrics as sustainable qualifiers for the supply chain.
[image:8.595.51.543.59.446.2]1. Mishra D., Gunasekaran A., Papadopoulos T., and Dubey R. Supply chain performance measures and metrics: a bibliometric study. Benchmarking: An International Journal, 25(3), 2018, 932–967.
2. Ah- Choy, Nurul Fadilah Mohd., Meng-Yong Tee, Nur Illyani Ibrahim
and Nurulain Bachok. Entrepreneurial Recycling Initiatives Towards Campus Sustainability, International Journal of Business and Society, Vol. 20 No 1, 2019, 247-259
3. Magnier L., Mugge R. and Schoormans J. Turning ocean garbage into
products – Consumers’ evaluations of products made of recycled ocean plastic. Journal of Cleaner Production, 2019.
4. Khoo H. H. LCA of plastic waste recovery into recycled materials, energy and fuels in Singapore. Resources, Conservation and Recycling, 145, 2019, 67–77.
5. K. Govindan, S. G. Azevedo, H. Carvalho and V. Cruz Machado.
Lean, green and resilient practices influence on supply chain performance: interpretive structural modeling approach, International Journal of Environmental Science and Technology, 12(1), 2015, 15–34.
6. Acquaye A., Ibn Mohammed T., Genovese A., Afrifa G. A., Yamoah F.
A. and Oppon E. A quantitative model for environmentally sustainable supply chain performance measurement. European Journal of Operational Research, 269(1), 2018, 188–205.
7. Shubham Tripathi and Manish Gupta. A Current Review of Supply
Chain Performance Measurement Systems, Advances in Industrial and Production Engineering, 2019, pp 27-39.
8. Reshma Ravindran, M. A. Vijaya. Sustainability Through Green
Practices: Willingness To Adapt Plastic Ban Initiative Among Consumers In Coimbatore City, International Journal of Management and Social Sciences, 2019, Volume 8.
9. Thanki S. and Thakkar J. A quantitative framework for lean and green
assessment of supply chain performance. International Journal of Productivity and Performance Management, 67(2), 2018, 366–400.
10. S. S. Ali, R. Kaur, J. A. Marmolejo Saucedo. Best Practices in Green
Supply Chain Management: A Developing Country Perspective, Emerald Insight, 2019, 129-153.
11. Tseng M. L., Lim M. K., Wong W. P., Chen Y. C. and Zhan Y. A framework for evaluating the performance of sustainable service supply chain management under uncertainty. International Journal of Production Economics, 195, 2018, 359–372.
12. Pourjavad E. and Shahin A. The Application of Mamdani Fuzzy
Inference System in Evaluating Green Supply Chain Management Performance. International Journal of Fuzzy Systems, 20(3), 2017, 901–912.
13. Deshmukh A. J. and Vasudevan H. Supplier Selection in Plastic
Products Manufacturing MSMEs Using a Combined Traditional and Green Criteria Based on AHP and Fuzzy AHP. Lecture Notes in Mechanical Engineering, 2018, 593–600.
14. Li Y., Abtahi A. R. and Seyedan M. Supply chain performance
evaluation using fuzzy network data envelopment analysis: a case study in automotive industry. Annals of Operations Research, 2018.
15. Niraj Kumar, Andrew Brint, Erjing Shi, Arvind Upadhyay and Ximing
Ruan. Integrating sustainable supply chain practices with operational performance: an exploratory study of Chinese SMEs. Journal of Production Planning and Control, Volume 30, 2019, Issue 5-6.
16. Muhammad Farooquea, Abraham Zhang, Matthias Thurer, Ting Qu
and Donald Huisingh. Circular supply chain management: A definition and structured literature review. Journal of Cleaner Production, Volume 228, 2019, Pages 882-900.
17. Ahmed Mohammed, Irina Harris, Anthony Soroka, Naim Mohamed
and Tim Ramjaun. Evaluating Green and Resilient Supplier Performance: AHP-Fuzzy Topsis Decision-Making Approach. ICORES, 2018 - 7th International Conference on Operations Research and Enterprise Systems.
18. Govindan K., Jha P. C., Agarwal V. and Darbari J. D. Environmental
management partner selection for reverse supply chain collaboration: A sustainable approach. Journal of Environmental Management, 236, 2019, 784–797.
19. Simon B. What are the most significant aspects of supporting the
circular economy in the plastic industry? Resources, Conservation and Recycling, 141, 2019, 299–300.
20. Shaharudin M. R., Tan K. C., Kannan V. and Zailani S. The Mediating
Effects of Product Returns on the Relationship between Green Capabilities and Closed-Loop Supply Chain Adoption. Journal of Cleaner Production, 2018.
21. Dos Santos B. M., Godoy L. P. and Campos L. M. S. Performance
Evaluation of Green Suppliers using Entropy-TOPSIS-F, Journal of Cleaner Production, 2018.
22. Li G., Shao S. and Zhang L. Green supply chain behavior and business
performance: Evidence from China, Technological Forecasting and Social Change, 2018.
23. Avelar Sosa L., García Alcaraz J. L. and Maldonado Macías A. A.
Supply Chain Evaluation and Methodologies. Evaluation of Supply Chain Performance, 2018, 149–174.
24. Luo W., Shi Y. and Venkatesh V. G. Exploring the factors of
achieving supply chain excellence: a New Zealand perspective. Production Planning & Control, 29(8), 2018, 655–667.
25. Namagembe S., Ryan S. and Sridharan R. Green supply chain practice
adoption and firm performance: manufacturing SMEs in Uganda. Management of Environmental Quality: An International Journal, 2018.
26. Tuladhar R. and Yin S. Sustainability of using recycled plastic fiber in
concrete. Use of Recycled Plastics in Eco-Efficient Concrete, 2019, 441–460.
27. Kim J. and Hwangbo H. Real-Time Early Warning System for
Sustainable and Intelligent Plastic Film Manufacturing. Sustainability, 11(5), 2019, 1490.
28. Zadeh, Fuzzy Sets. Information and Control, 1965, 338-353.
29. Ghadimi P., Wang C. and Lim M. K. Sustainable supply chain
modeling and analysis: Past debate, present problems and future challenges. Resources, Conservation and Recycling, 140, 2019, 72–84.
30. Kusi Sarpong S., Gupta H. and Sarkis J. A supply chain sustainability
innovation framework and evaluation methodology. International Journal of Production Research, 2018, 1–19.
31. Throne J. L., Thermoforming, Encyclopedia of Polymer Science and
Technology, Wiley Online Library, 2003.
32. Ju Y., Wang Y., Cheng Y. and Jia J. Investigating the Impact Factors of
the Logistics Service Supply Chain for Sustainable Performance: Focused on Integrators. Sustainability, 2019, 11(2).
33. Gardas B. B., Raut R. D. and Narkhede B. Identifying critical success
![Figure 1: Reference model for supply chain operation [33] with company’s operational policy (see Figure 1)](https://thumb-us.123doks.com/thumbv2/123dok_us/8199363.260333/2.595.61.518.533.676/figure-reference-supply-operation-company-operational-policy-figure.webp)