A STUDY ON THE EFFECTIVENESS OF A SIX WEEK
PLYOMETRIC TRAINING PROGRAM ON AGILITY
Registration Number 27091208
A DISSERTATION SUBMITTED TO
THE TAMIL NADU DR. M. G. R. MEDICAL UNIVERSITY, CHENNAI, IN PARTIAL FULFILMENT OF THE REQUIREMENTS OF THE
DEGREE OF MASTER OF PHYSIOTHERAPY
A STUDY ON THE EFFECTIVENESS OF A SIX WEEK
PLYOMETRIC TRAINING PROGRAM ON AGILITY
Head of the Institution:
Principal:
Dr.R.SHANKER M.P.T. (OG) TMMF, MADURAI
A DISSERTATION SUBMITTED TO
THE TAMIL NADU DR. M. G. R. MEDICAL UNIVERSITY, CHENNAI, IN PARTIAL FULFILMENT OF THE REQUIREMENTS OF THE
DEGREE OF MASTER OF PHYSIOTHERAPY
CERTIFICATE
This is to certify that the project entitledA STUDY ON THE
EFFECTIVENESS OF A SIX WEEK PLYOMETRIC TRAINING PROGRAM ON AGILITY and was work done by Mr. R. PRATHAP, a
bonafide student of Master of Physiotherapy (M.P.T.) Final Year student under
The Tamil Nadu Dr. M.G.R Medical University, Chennai.
Registration Number: 27091208
A STUDY ON THE EFFECTIVENESS OF A SIX WEEK PLYOMETRIC TRAINING PROGRAM ON AGILITY
COLLEGE OF PHYSIOTHERAPY
TRINITY MISSION AND MEDICAL FOUNDATION ULTRA TRUST
MADURAI TAMIL NADU
Examiners:_______________________________________
_______________________________________________________
A DISSERTATION SUBMITTED TO
THE TAMIL NADU DR. M. G. R. MEDICAL UNIVERSITY, CHENNAI, IN PARTIAL FULFILMENT OF THE REQUIREMENTS OF THE
DEGREE OF MASTER OF PHYSIOTHERAPY
ACKNOWLEDGEMENT
I express my thanks to Prof K. ARUMUGAM, Chairman, Ultra trust, for his permission to do this dissertation
I express my incalculable gratitude to Prof. R.SHANKER MPT, PRINCIPAL, Trinity mission and medical foundation, Ultra trust, for his valuable guidance in every stage of this dissertation.
My sincere gratefulness to my guide MR. A.JOSEPH OLIVER MPT (Sports) who guide me throughout the project work. I thank him very much for his timely advice, valuable suggestion, inspiring ideas to format this project and encourage me with new thoughts.
Its my pleasure to thank Mr.B.RAM KUMAR MPT, Mr. J.SUDARSHAN MPT, Mrs.D.G.ANIMA MPT, Mr.ANANDH RAJ BPT, Mr. MOHAMMED AMEER HUSSAIN MPT, Mr.PITCHU MANI BPT & DMH Physiotherapy Team, Mr. THIRUNAVUKARASU Librarian who gave their valuable suggestion in material collections.
I am greatly thankful to my friends Mr. MANOJ, MR.VALLABAN, Mr. JAI GANESH for their timely help to complete this fulfilled dissertation. I also acknowledge to help and co-operation rendered to my Athletes who participated in this study.
I wish thanks to YMCA college to physical education, Nandanam, Staffs and Students.
CONTENTS
Chapter
No. Title
Page No.
1 INTRODUCTION 1
1.1 Statement of the study 3
1.2 Aim of Study 3
1.3 Objective of the study 3
1.4 Need of the study 3
1.5 Hypothesis 3
1.5.1 Null Hypothesis 3
1.5.2 Alternate hypothesis 4
1.6 Operational definition 4
1.6.1 Plyometrics 4
1.6.2 Agility 4
2. REVIEW OF LITERATURE 5
3. DESIGN AND METHODOLOGY 9
3.1 Research Design 9
3.2 Selection Criteria 9
3.2.1 Inclusion Criteria 9
3.2.2 Exclusion Criteria 9
3.3 Population 9
3.4 Sample and Sampling technique 10
3.5 Variables of Study 10
Chapter
No. Title
Page No.
3.5.2 Independent variable 10
3.6 Setting of the study 10
3.7 Materials used for the study 10
4. METHODOLOGY 11
4.1 Measurement Tools 11
4.2 Plyometric 6 weeks training protocol 30
4.3 Outcome measures 39
4.4 Observation and analysis 39
5. RESULTS AND DISCUSSION 47
5.1 Result 47
5.2 Discussion 50
5.3 Limitation of the study 51
5.4 Scope for further study 51
6. CONCLUSION 52
7. REFERENCES 53
8. APPENDIX 59
8.1 Assessment Performa 59
8.2 Consent Form 60
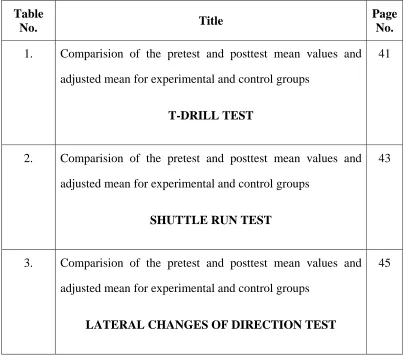
LIST OF TABLES
Table
No. Title
Page No. 1. Comparision of the pretest and posttest mean values and
adjusted mean for experimental and control groups
T-DRILL TEST
41
2. Comparision of the pretest and posttest mean values and adjusted mean for experimental and control groups
SHUTTLE RUN TEST
43
3. Comparision of the pretest and posttest mean values and adjusted mean for experimental and control groups
LATERAL CHANGES OF DIRECTION TEST
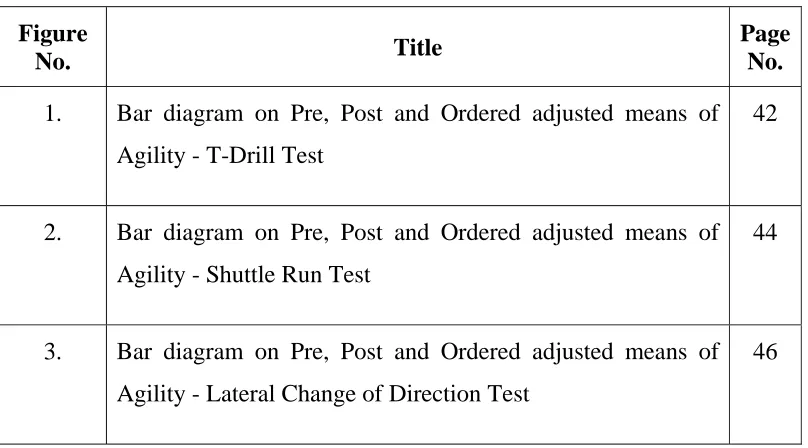
[image:8.612.114.519.116.478.2]LIST OF FIGURES
Figure
No. Title
Page No. 1. Bar diagram on Pre, Post and Ordered adjusted means of
Agility - T-Drill Test
42
2. Bar diagram on Pre, Post and Ordered adjusted means of Agility - Shuttle Run Test
44
3. Bar diagram on Pre, Post and Ordered adjusted means of Agility - Lateral Change of Direction Test
46
1
INTRODUCTION
Sports training refers to specialized strategies and methods of exercise
used in various sports to develop athletes and prepare them for performing in
sporting events. The goal of any athletic training program is to improve the
specific physical capacities needed for that sport.
The term plyometric, as derived from its Greek roots, means to increase
or augment. Such training has been used systematically in Track & Field by
European coaches and athletes for nearly 25 years, although most American
coaches consider it a recent phenomenon. In fact, most of us have been doing
some form of plyometric exercise in all our lives. Jumping rope, playing
hopscotch, leaping from the front porch, skipping, and bouncing are all
plyometric movements. Understanding the mechanisms, technique, and proper
application of plyometric training, however, is essential for it to be properly
integrated into your own system of training.
Plyometrics are exercises that aim to develop explosive ability by
conditioning the neuromuscular and elastic characteristics of the muscle.
Strictly speaking, plyometric training is a method of training as opposed to a
specific set of exercises. Muscles that start in a static position cannot generate
as much force as those using the stretch-shortening cycle since the eccentric to
concentric muscle action uses the elastic energy stored in the muscle.
A greater power output can be found when the stretch-shortening cycle
is used because of the efficiency gained by releasing elastic energy stored in
2 central nervous system to resist the sudden stretch. In other words, the muscle
is going to rebound rapidly from the sudden stretch. Considering this
information plyometric training has the potential to develop quicker reaction
times that leads to an increase in an athlete’s speed and power. This type of
training can improve performance in explosive sports that rely on moving
speed and power such as hockey, basketball, track and field, football, and
volleyball. Even though plyometric training has been used for many years, to
our knowledge there has been very little research done using a sport specific
plyometric program.
This confusion has led to the current study involving college -age male
sportspersons and whetherplyometrics will improve power and speed. It is
essential that sportspersons have power, explosiveness, quickness and agility to
compete at their peak abilities some of which can be improved by plyometric
3
1.1 STATEMENT OF THE STUDY
The statement of the study was Effectiveness of six week plyometric
training program on agility.
1.2 AIM OF THE STUDY
The aim of this study was to analyze the effectiveness of six week
plyometric training program on agility.
1.3 OBJECTIVES OF THE STUDY
The objective of this study is to analyze the effectiveness of plyometric
training regimen on agility in young male athletes.
1.4 NEED OF THE STUDY
Skill related fitness comprises of components such as agility, balance,
coordination, power, speed, and reaction time. Sports persons require more
strength, power, flexibility, agility, speed reflexes etc. An increase in any one
of the above could bring about marked improvement in performance of the
athlete. Plyometrics is believed to improve strength and agility. An attempt is
made in this project to improve on the agility of sportspersons through a six
week plyometrics training program
1.5 HYPOTHESIS
1.5.1 NULL HYPOTHESIS
There is no significant improvement in agility and performance of
4
1.5.2 ALTERNATE HYPOTHESIS
There is significant improvement in agility and performance of athletes
following a six week plyometric training program.
1.6 OPERATIONAL DEFINITIONS
1.6.1 PLYOMETRICS
Plyometrics described any type of explosive movement for a series of
repetitions at high speeds and high levels of intensity.
1.6.2 AGILITY
Agility is defined as the ability to perform a series of explosive power
5
REVIEW OF LITERATURE
• Corey M. Reyment, Megan E. Bonis, Jacob C. Lundquist, Brent
S(2006). Tice of the University of Wisconsin at Eau Claire, WI
conducted a study titled “Effects Of A Four Week Plyometric Training
Program On Measurements Of Power In Male Collegiate Hockey
Players”. In this study they have mentioned that the plyometric training
two days a week for four weeks is not sufficient enough to show
improvements in 40 yd dash times, 10 yd dash times, two foot vertical
jump height, post minimum power and post relative minimum power
(W/Kg).
• Michael G. Miller , Jeremy J. Herniman , Mark D. Ricard ,
Christopher C. Cheatham and Timothy J. Michael(2006) in their
study titled “The Effects Of A 6-Week Plyometric Training Program
On Agility” have mentioned that not only can athletes use plyometrics
to break the monotony of training, but they an also improve their
strength and explosiveness while working to become more agile. In
addition, their results support that improvements in agility can occur in
as little as 6 weeks of plyometric training which can be useful during
the last preparatory phase before in-season competition for athletes.
• S M Lephart (2005), J P Abt, C M Ferris, T C Sell, T Nagai, J B
Myers, J JIrrgang have conducted a study on “Neuromuscular and
biomechanical characteristic changes in high school athletes: a
6 the basic training alone induced a favorable neuromuscular and
biomechanical changes in high school female athletes. The plyometric
program may further be utilized to improve muscular activation
patterns.
• Lockwood and Brophey (2004) tested six male hockey players from a
Jr. B hockey team following a 4-week plyometric program and
observed a significant drop in on - ice 40 m time from pre test to post
test. The average drop was approximately .15s.A decrease in 10 m and
40 m sprint times was also seen at the conclusion of an 8 week study
conducted with sprint specific plyometrics. In a 6-week study
conducted by Polhemius et al (1980), subjects participated in a three
day per week plyometric program while completing their conventional
training programs. It was found that pre- to post-program 40 m dash
times were significantly reduced.
• Craig (2004), Miller et al. (2001), Parsons et al., Yap et al., and
Young et al all are of the same view that Plyometric drills usually
involve stopping, starting and changing directions in an explosive
manner. These movements are components that can assist in developing
agility. These studies support our study as well.
• Parsons and Jones, 1998; Renfro, 1999; Robinson and Owens,
2004; Roper, 1998; Yap and Brown, 2000 have been suggested that
increases in power and efficiency due to plyometrics may increase
agility training objectives. They have used plyometric activities in
7
• Luebbers et al (2003) found that some aspects of performance actually
decreased following a 4-week plyometric training program. Even
though some studies have shown improvements using plyometrics in
their programs there have been others that have shown little or no
improvements. This was the case in the study conducted by Luebbers et
al. In the study decreases in vertical jump performance (67.8 ± 7.9 cm)
were observed following the 4-week plyometric program. Vertical jump
values decreased to a mean of 65.4 ± 7.8 cm from 67.8 ± 7.9 cm after
the plyometric training program. In other areas there were no significant
changes found including anaerobic power.
• Asmussen and Bonde-Peterson (1974), Cavagna (1977), Komi
(1992), Miller et al. (2001), Pfeiffer (1999), Wathen (1993) are all
authors who agree that the stored elastic energy within the muscle (as a
result of plyometrics) is used to produce more force than can be
provided by a concentric action alone.
• Baechle and Earle (2000) say plyometrics consists of a rapid stretching
of a muscle (eccentric action) immediately followed by a concentric or
shortening action of the same muscle and connective tissue.
• Gregory John Renfro (1999), have conducted a study “Summer
Plyometric Training for Football and its Effect on Speed and Agility”.
• Chu (1998) has mentioned in his study that the plyometrics are training
techniques used by athletes in all types of sports to increase strength
8
• Stone and O’Bryant(1984) believed that the plyometric activities have
been used in sports such as football, tennis, soccer or other sporting
9
DESIGN AND METHODOLOGY
3.1 RESEARCH DESIGN
The research design of this study was done by Experimental study.
3.2 SELECTION CRITERIA
3.2.1 INCLUSION CRITERIA
• Subjects with age group of 20-30 years
• Male athletes
• Cooperative patients
• Subjects with no contraindications.
3.2.2 EXCLUSION CRITERIA
• Subjects with age group of below 20 or above 30 years.
• Female athletes
• Non Cooperative Patients.
• Subjects with muscle contractures or deformity.
3.3 POPULATION
Male athletes within the age group of 20-30 years were considered as the
10
3.4 SAMPLE AND SAMPLING TECHNIQUE
Thirty subjects satisfying the inclusion criteria were selected from the
population by 'Convenient Sampling Technique'.
3.5 VARIABLES OF THE STUDY
3.5.1 DEPENDANT VARIABLE
• Agility
3.5.2 INDEPENDENT VARIABLE
• Plyometric Training
3.6 SETTING OF THE STUDY
The study was conducted at YMCA College of Physical Education,
Nandanam, Chennai.
3.7 MATERIALS USED FOR THE STUDY
• Cone
• Stop watch
• Tape
11
METHODOLOGY
Thirty subjects satisfying the inclusion criteria were selected from the
population by 'Convenient Sampling Technique' and were divided in to two
groups of fifteen subjects each.
• Experimental Group
• Control Group
The experimental group received the given six weeks of plyometrics
training. The control group did not receive any training. They were assessed for
pre and post test directly.
4.1 MEASUREMENT TOOLS
T TEST
Purpose: The T-Test is a test of agility for athletes and includes forward,
lateral, and backward running.
Equipment required: Tape measure, marking cones, stopwatch, timing
gates (optional)
Procedure: The subject starts at cone A. On the command of the timer,
the subject sprints to cone B and touches the base of the cone with their right
hand. They then turn left and shuffle sideways to cone C, and also touches its
base, this time with their left hand. Then shuffling sideways to the right to cone
12 touching with the left hand, and run backwards to cone A. The stopwatch is
stopped as they pass cone A.
Scoring: The trial will not be counted if the subject cross one foot in front
of the other while shuffling, fails to touch the base of the conesor fails to face
forward throughout the test. Take the best time of three successful trials to the
13
Fig.44.2 Subjectt side shufffling from ccone B to ccone C
Fig.4.3 Subjeect side shuuffling fromm Cone C tto Cone D
Fig.4..4 Subject sshuffling bbackwards from Conee B to Cone
16
e A
Fig.4.5 SSubject bacck to the staarting poinnt
18
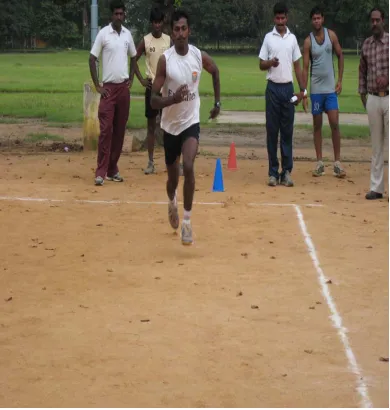
SHUTTLE RUN TEST
Purpose:This is a test of speed and agility which is important in many sports.
Equipment required: Wooden blocks, marker cones, measurement tape,
stopwatch and non-slip surface.
Procedure: This test requires the person to run back and forth between two
parallel lines as fast as possible. Set up two lines of cones 30 feet apart or use
line markings and place two blocks of wood or a similar object behind one of
the lines. Starting at the line opposite the blocks on the signal "Ready? Go!" the
participant runs to the other line, picks up a block and returns to place it behind
the starting line, then returns to pick up the second block, then runs with it back
across the line.
Scoring: Two or more trails may be performed and the quickest time is
Fig.4.6 Subject starting toowards the end line
20
21
22
23
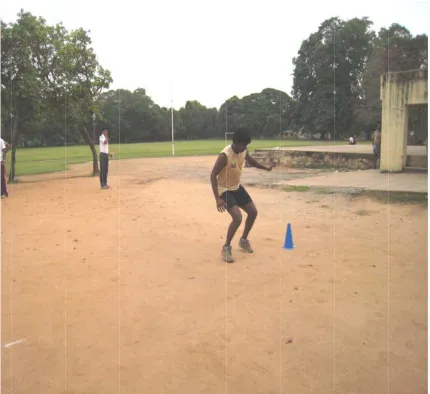
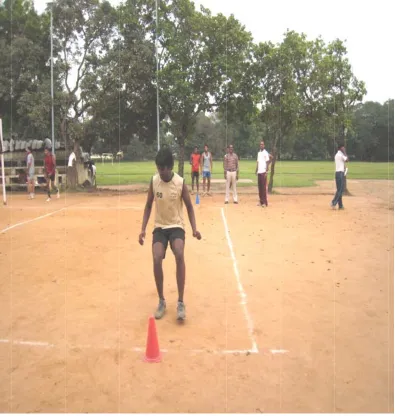
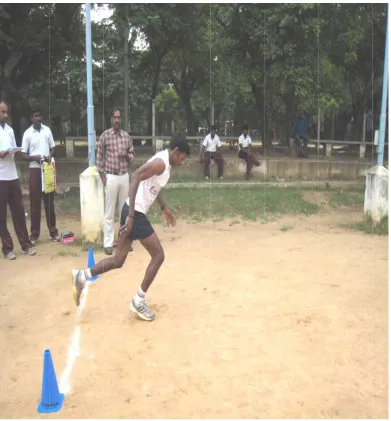
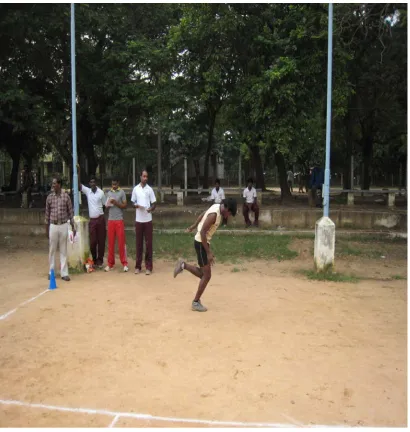
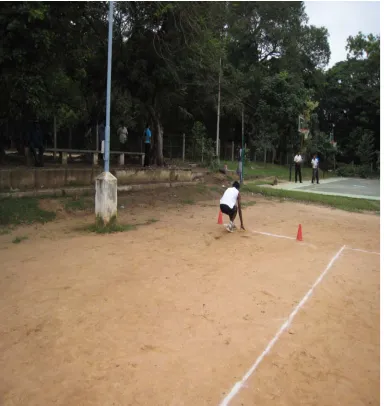
24 LATERAL CHANGE OF DIRECTION TEST
Purpose:This is a test of agility, including speed, quickness, flexibility, change
of direction and body control.
Equipment required: Stopwatch, measuring tape or marked football field,
marker conesand a flat non-slip surface.
Procedure:
1. Equipment needed were a flat surface (running track would be ideal), three
cones, stop watch and an assistant.
2. Three cones were set five meters apart on a straight line.
3. The athlete started at the middle cone.
4. The coach gave the signal to start and pointed to a specific direction, right or
left.
5. The athlete then moves and touches the first cone, returns past the middle
cone (start) to the far cone, touches it and then returns to the middle cone,
touching it too.
The coach starts the stopwatch on giving the ‘GO’ command and stops
the watch when the athlete touches the middle cone. The best score out of the
two circuits in each direction were recorded.
Scoring: The time to complete the test in seconds is recorded. The score is the
Fig..4. 11 Subjeect in startting positioon
Fig.44.12 Subjecct starting from cone A
Fiig.4.13 Subbject reachiing cone B
Fiig.4.14 Subbject reachiing cone C
Fig.4.115 Subject back to staarting position
30
4.2 Plyometric 6-week Training Protocol
Week 1
Training Volume: 90 Foot contacts
Plyometric Drill Sets X Reps Training Intensity
Side to Side ankle hops 2 X 15 Low
Standing jump and reach 2 X 15 Low
Front cone hops 5 X 6 Low
Week 2
Training Volume: 120 Foot contacts
Plyometric Drill Sets X Reps Training Intensity
Side to Side ankle hops 2 X 15 Low
Standing long jump 5 X 6 Low
Lateral jump over barrier 2 X 15 Medium
31
Week 3
Training Volume: 120 Foot contacts
Plyometric Drill Sets X Reps Training Intensity
Side to Side ankle hops 2 X 12 Low
Standing long jump 4 X 6 Low
Lateral jump over barrier 2 X 12 Medium
Double leg hops 3 X 8 Medium
Lateral cone hops 2 X 12 Medium
Week 4
Training Volume: 140 Foot contacts
Plyometric Drill Sets X Reps Training Intensity
Diagonal cone hops 4 X 8 Low
Standing Long jump with lateral
sprint 4 X 8 Medium
Lateral cone hops 2 X 12 Medium
Single leg bounding 4 X 7 High
32
Week 5
Training Volume: 140 Foot contacts
Plyometric Drill Sets X Reps Training Intensity
Diagonal cone hops 2 X 7 Low
Standing Long jump with lateral
sprint 4 X 7 Medium
Lateral cone hops 4 X 7 Medium
Cone hops with 180 degree turn 4 X 7 Medium
Single leg bounding 4 X 7 High
Lateral Jump single leg 2 X 7 High
Week 6
Training Volume: 120 Foot contacts
Plyometric Drill Sets X Reps Training Intensity
Diagonal cone hops 2 X 12 Low
Hexagon drill 2 X 12 Low
Cone hops with change of
direction sprint 4 X 6 Medium
Double leg hops 3 X 8 Medium
Fig.4.116 Ankle HHops
Fig.4.17 FFront Conee Hops
Fig.4.18 LLateral Conne Hops
F
Fig.4.19 Siingle Leg BBounding
[image:45.612.121.514.185.570.2]Figg.4.20 Lateeral Jump SSingle Leg
[image:46.612.121.535.188.605.2]F
Fig.4.21 Diiagonal Coone Hops
39
4.3 OUTCOME MEASURES
The outcome measures of six week plyometric training program were taken for the subjects using T test, Shuttle run test, Lateral Change of direction test to measure agility. The data collected were analyzed by statistical procedure to find the significance.
4.4 OBSERVATION AND ANALYSIS
A separate proformawas used to record the pre and post intervention
score for each subject.
The data collected were analyzed using the underlying statistical
method.
ANCOVA
Mean Sum of squares between
F =
Mean sum of squares within
yij = µ + α1 + β (xij - x) + εij
where
yij = jth replicate observation of response variable
µ = mean value of response variable
α1 = µ1 - µ
β = combined regression coefficient
xij = covariate value for the jth replicate observation from the ith level
of factor A
40
εij = unexplained error assoc. with jth replicate observation from the
ithlevel of factor A
Adjusted Y values:
y
ij(adj)=
y
ij-
β
(x
ij- x) = µ +
α
1+
ε
ijAdjusted Y means:
µ
i(adj)=
µ
i-
β
(x
i- x)
(SSwith(adj) - SSres)/(J- 1) F =
SSres/(N - 2J)
whereSSres is the sum of squared residuals
41 T-DRILL TEST
Table 1: Comparision of the pre-test and post-test mean values and adjusted mean for experimental and control groups
Test CON.GROUP
Sec
INT.GROUP
Sec sv ss df MS F TV 0.05 TV 0.01
Pre test 12.18 12.00 between 0.2558 1 0.2558 1.57 4.21 7.68
within 4.5577 28 0.1628
Post test 12.34 11.63 between 3.7595 1 3.7595 27.48 4.21 7.68
within 3.8305 28 0.1368
Adjusted 12.27 11.71 between 2.1927 1 2.1927 81.19 4.21 7.68
within 0.7291 27 0.027
42
43 SHUTTLE RUN TEST
Table 2: Comparision of the pre-test and post-test mean values and adjusted mean for experimental and control groups
Test
CON.GROUP
Sec
INT.GROUP
Sec sv ss df MS F TV 0.05 TV 0.01
Pre test 9.74 9.75 between 0.00 1.00 0.00 0.04 4.21 7.68
within 0.58 28.00 0.02
Post test 9.85 9.55 between 0.68 1.00 0.68 36.47 4.21 7.68
within 0.52 28.00 0.02
Adjusted 9.86 9.55 between 0.71 1.00 0.71 76.06 4.21 7.68
within 0.25 27.00 0.01
44
45 LATERAL CHANGE OF DIRECTION TEST
Table 3: Comparision of the pre-test and post-test mean values and adjusted mean for experimental and control groups
Test
CON.GROUP
Sec
INT.GROUP
sv ss df MS F TV 0.05 TV 0.01
Pre test 6.75 6.58 between 0.2271 1 0.2271 5.72 4.21 7.68
within 1.1103 28 0.0397
Post test 6.9 6.31 between 2.7543 1 2.7543 64.62 4.21 7.68
within 1.1933 28 0.0426
Adjusted 6.84 6.38 between 1.3556 1 1.3556 76.15 4.21 7.68
within 0.4806 27 0.0178
46
47
RESULTS AND DISCUSSION
5.1 RESULTS
T DrillTest
The pretest, post test and adjusted mean values of the control group on
agility were 12.18, 12.34 and 12.27 Secsrespectively. The pretest, post test and
adjusted mean values of the experimental group on agility were 12.0, 11.63 and
11.71 Secsrespectively. The post test and pretest mean difference of control
group on agility was 0.16 and the post test and pretest mean difference of
experimental group on agility was -0.37 which revealed that the agility time
was reduced comparing to the pretest. The obtained F value of pretest means of
the groups 1.57 showed that there was no initial difference between the groups
on agility. The obtained F value of post test means of the both groups 27.48
showed that there was a significant difference between the groups since the
obtained F value was higher than the table value 4.21 and 7.68 at 0.05 and 0.01
levels respectively. Finally, the obtained F value on the ordered adjusted mean
values of the both the groups 81.19 were higher than the table value 4.21 and
7.68 at 0.05 and 0.01 level respectively. Hence it was found that the polymeric
48
Shuttle Run Test
The pretest, post test and adjusted mean values of the control group on
agility were 9.74, 9.85 and 9.86Secs respectively. The pretest, post test and
adjusted mean values of the experimental group on agility were 9.75, 9.55Secs
and 9.55 respectively. The post test and pretest mean difference of control
group on agility was 0.11 and the post test and pretest mean difference of
experimental group on agility was -0.20 which revealed that the agility time
was reduced comparing to the pretest. The obtained F value of pretest means of
the groups 0.04 showed that there was no initial difference between the groups
on agility. The obtained F value of post test means of the both groups 36.47
showed that there was a significant difference between the groups since the
obtained F value was higher than the table value 4.21 and 7.68 at 0.05 and 0.01
levels respectively. Finally, the obtained F value on the ordered adjusted mean
values of the both the groups 76.06 were higher than the table value 4.21 and
7.68 at 0.05 and 0.01 level respectively. Hence it was found that the polymeric
49
Lateral Change of Direction Test
The pretest, post test and adjusted mean values of the control group on
agility were 6.75, 6.9 and 6.84Secs respectively. The pretest, post test and
adjusted mean values of the experimental group on agility were 6.58, 6.31 and
6.38Secs respectively. The post test and pretest mean difference of control
group on agility was 0.15 and the post test and pretest mean difference of
experimental group on agility was -0.27 which revealed that the agility time
was reduced comparing to the pretest. The obtained F value of pretest means of
the groups 5.72 showed that there was an initial difference between the groups
on agility. The obtained F value of post test means of the both groups 64.62
showed that there was a significant difference between the groups since the
obtained F value was higher than the table value 4.21 and 7.68 at 0.05 and 0.01
level respectively. Finally, the obtained F value on the ordered adjusted mean
values of the both the groups 76.15 were higher than the table value 4.21 and
7.68 at 0.05 and 0.01 level respectively. Hence it was found that the polymeric
50
5.2 DISCUSSION
This study was started with the aim of analysing the effectiveness of a six
week plyometric training regimen on speed and performance. The subjects with
age group of 20-30 years, co-operative and with no contraincation were
selected. In gender, only ,ales were selected for the study. A six week training
program was administered. At the end of the six week program results were
analysed.
The Experimental Group training was significantly effective at 99% level
of significance. Experimental Group gained significant improvement in
performance.
When the Control Group and Experimental Group data were analysed and
compared, there was significant (99%) improvement in performance (agility)
in the Experimental Group than with the Control Group. This was the benefit
of the six week plyometric training program.
Hence, this study favours the hypothesis and rejects the null hypothesis.
We can conclude that the six week plyometrics training is definitely more
51
5.3 LIMITATIONS OF THE STUDY
• The age groups of the samples were between 20-30 years. So the result
of this study cannot be generalized over all the age groups.
• The size of the sample is too small to generalize the findings.
• A potential threat to the validity of the findings is that participants could
not be blinded.
5.4 SCOPE FOR FURTHER STUDY
• This study was conducted among a small population. It can be done with more
subjects.
• This study was done only in the male athletes. It can be done with female
athletes also.
• This study was done in the younger age group 20-30 years of age. It can be
done in the middle and older age group as well.
• This study has used only six week plyometric training program. A four week
52
CONCLUSION
The goal of any athletic training programme is to improve the specific physical capacities needed for that sport, plyometric is a term derived from its Greek roots, means to increases or augment. The present study is conducted to improve the agility of sports spersonsthrough a six week plyometrics training programme. Male athletes within the age group of 20-30 years were taken up for the study using the usual inclusion criteria.
The experimental group received the given six weeks of plyometric training and statistical analysis was done, By analyzing the data, improvement in the experimental group was noted.
53
REFERENCES
1. Adams, K., O’Shea, J.P., O’Shea, K.L. and Climstein, M.(1992) The
effects of six weeks of squat, plyometrics, and squat plyometric training
on power production. Journal of Applied Sports Science Research 6,
36-41.
2. Anderst, W.J., Eksten, F. and Koceja, D.M. (1994) Effects of plyometric
and explosive resistance training on lower body power. Medicine and
Science in Sport and Exercise 26, S31.
3. Asmussen, E. and Bonde-Peterson, F. (1974) Apparent efficiency and
storage of elastic energy in human muscles during exercise.
ActaPhysiologicaScandinavica92, 537-545.
4. Avery D.Faigenbaum, James E. McFarland, Fred B. Keiper, William
Tevlin, Nocholas A. Ratamess, Jie Kang and Jay R. Hoffman (2000)
Effects of a short-term plyometric and resistance training program on
fitness performance in boys age 12 to 15 years. Journal of Sports
Science and Medicine(2007) 6,519-525
5. Baechle, T.R. and Earle, R.W. (2000) Essentials of strength training and
conditioning. 2nd edition. Champaign, IL: National Strength and
Conditioning Association.
6. Barnes, M. and Attaway, J. (1996) Agility and conditioning of the San
54 7. Bebi, J., Cresswell, A., Engel, T. and Nicoi, S. (1987) Increase in
jumping height associated with maximal effort vertical depth jumps.
Research Quarterly for Exercise and Sport 58, 11-15.
8. Bobbert, M. (1990) Drop jumping as a training method for jumping
ability. Sports Medicine 9, 7-22.
9. Brown, M.E., Mayhew, J.L. and Boleach, L.W. (1986) Effects of
plyometric training on vertical jump performance in high school
basketball players. Journal of Sports Medicine and Physical Fitness 26,
1-4.
10. Buttifant, D., Graham, K. and Cross, K. (1999) Agility and speed of
soccer players are two different performance parameter. Journal of
Sports Science 17, 809.
11. Cavagna, G. (1977) Storage and utilization of elastic energy in skeletal
muscle. Exercise and Sports Sciences Reviews 5, 89-129.
12. Chu, D.A. (1998) Jumping into plyometrics. Champaign, IL: Human
Kinetics.
13. Clutch, D., Wilton, B., McGown, M. and Byrce, G.R. (1983) The effect
of depth jumps and weight training on leg strength and vertical jump.
Research Quarterly for Exercise and Sport 54, 5-10.
14. Corey M. Reyment, Megan E. Bonis, Jacob C. Lundquist, Brent S. Tice.
55 of Power in Male Collegiate Hockey Players. J. Undergrad. Kin.Res
2006; 1(2):44-62.
15. Craig, B.W. (2004) What is the scientific basis of speed and agility?
Strength and Conditioning 26(3), 13-14.
16. Draper, J.A. and Lancaster, M.G. (1985) The 505 Test: A test for agility
in the horizontal plane. Australian Journal of Science and Medicine in
Sport 17, 15-18.
17. Harrison, A.J. and Gaffney, S. (2001) Motor development and gender
effects on stretch-shortening cycle performance. Journal of Science and
Medicine in Sport 4, 406-415.
18. Hennessy, L. and Kilty, J. (2001) Relationship of the stretch-shortening
cycle to spring performance in trained female athletes. Journal of
Strength and Conditioning Research 15, 326-331.
19. Hewett, T.E., Stroupe, A.L., Nance, T.A. and Noyes, F.R. (1996)
Plyometric training in female athletes. Decreased impact forces and
increased hamstring torques. American Journal of Sports Medicine 24,
765-773.
20. Holcomb, W.R., Lander, J.E., Rutland, R.M. and Wilson, G.D. (1996) A
biomechanical analysis of the vertical jump and three modified
plyometric depth jumps. Journal of Strength and Conditioning Research
56 21. Komi, P.V. (1992) The stretch-shortening cycle. In: Strength and power
in sport. Boston, Mass: Blackwell Scientific. 169-179.
22. Mayhew, J., Piper, F., Schwegler, T.M. and Ball, T.E. (1989).
Contributions of speed, agility and body composition to anaerobic
power measurements in college football players. Journal of Applied
Sports Science Research 3, 101-106.
23. Michael G. Miller , Jeremy J. Herniman , Mark D. Ricard , Christopher
C. Cheatham and Timothy J. Michael. The Effects Of A Six-Week
Plyometric Training Program On Agility. Journal of Sports Science and
Medicine(2006) 5, 459-465.
24. Michal Lehnert, IvonaLamrova, Milan Elfmark. Changes in Speed and
Strength in Female Volleyball Players During and After a Plyometric
Training Program.ActaUniv, Palacki, Olomuc, Gymn. 2009 Vol 39, no.1.
25. Miller, J.M., Hilbert, S.C. and Brown, L.E. (2001) Speed, quickness,
and agility training for senior tennis players. Strength and Conditioning
23(5), 62-66.
26. Miller, M.G., Berry, D.C., Bullard, S. and Gilders, R. (2002)
Comparisons of land-based and aquatic based plyometric programs
during an 8-week training period. Journal of Sports Rehabilitation 11,
57 27. Paasuke, M., Ereline, J. and Gapeyeva, H. (2001) Knee extensor muscle
strength and vertical jumping performance characteristics in pre and
postpubertal boys. Pediatric Exercise Science 13, 60-69.
28. Parsons, L.S. and Jones, M.T. (1998) Development of speed, agility and
quickness for tennis athletes. Strength and Conditioning 20(3), 14-19.
29. Pauole, K., Madole, K. and Lacourse, M. (2000) Reliability and validity
of the T-test as a measure of agility, leg power and leg speed in college
aged men and women. Journal of Strength and Conditioning Research
14, 443-450.
30. Pfeiffer, R. (1999) Plyometrics in sports injury rehabilitation. Athletic
Therapy Today 4(3), 5.
31. Piper, T.J. and Erdmann, L.D. (1998) A 4 step plyometric program.
Strength and Conditioning 20(6), 72-73.
32. Potteiger, J.A., Lockwood, R.H., Haub, M.D., Dolezal, B.A., Alumzaini,
K.S., Schroeder, J.M. and Zebas, C.J. (1999) Muscle power and fiber
characteristic following 8 weeks of plyometric training. Journal of
Strength and Conditioning Research 13, 275-279.
33. Read, M. (1996) An off-season strength and conditioning program for
hockey. Strength and Conditioning 18(6), 36-39.
34. Renfro, G. (1999) Summer plyometric training for football and its effect
58 35. Robinson, B.M. and Owens, B. (2004) Five-week program to increase
agility, speed, and power in the preparation phase of a yearly training
plan. Strength and Conditioning 26(5), 30-35.
36. Roozen, M. (2004) Illinois agility test. NSCA’s Performance Training
Journal 3(5), 5-6.
37. Roper, R.L. (1998) Incorporating agility training and backward
movement into a plyometric program. Strength and Conditioning 20 (4),
60-63.
38. Stone, M.H. and O’Bryant, H.S. (1984) Weight Training: A scientific
approach. Minneapolis: Burgess.
39. Twist, P.W. and Benicky, D. (1996) Conditioning lateral movements for
multi-sport athletes: Practical strength and quickness drills. Strength and
Conditioning 18(5), 10-19.
40. Wathen, D. (1993) Literature review: explosive/plyometric exercises.
Strength and Conditioning 15(3), 17-19.
41. Wilson, G.J., Newton, R.U., Murphy, A.J. and Humphries, B.J. (1993)
The optimal training load for the development of dynamic athletic
performance. Medicine and Science in Sports and Exercise 25,
1279-1286.
42. Yap, C.W. and Brown, L.E. (2000) Development of speed, agility, and
quickness for the female soccer athlete. Strength and Conditioning
59
APPENDIX
8.1 ASSESSMENT PERFORMA
NAME :
AGE :
SEX :
SUBJECT NUMBER :
PSYCHOLOGICAL STATUS : GOOD / BAD
ANY CONTRAINDICATIONS:YES / NO
GROUP : Experimental / Control
DATA COLLECTION SCORE OF AGILITY
VARIABLE AGILITY SCORE
T test
Shuttle Run Test
Lateral Change of Direction Test
60
8.2 CONSENT FORM
I have been informed about the procedure and purpose of the study. I
have understood that I have the right to refuse my consent or withdraw it any
time during the study without adversely affecting my treatment.
I am aware that being subjected to this study I will have to give my time
for assessment and treatment and these assessments do not interfere with the
benefit.
I ---, the undersigned give my consent to
be a participant of this investigation / study program / clinical trail.
Signature of the Guide Signature of subject
61
8.3 MASTER CHART
T- Drill Test
Experimental Group Control Group
S No Pre-Test Sec Post-Ttest Sec Pre-Test Sec Post-Test Sec
1 11.98 11.57 12.39 12.43
2 12.41 12.16 12.69 12.6
3 11.69 11.15 11.7 12.12
4 12.52 12 12.79 12.9
5 11.91 11.35 12.32 12.12
6 11.82 11.53 11.82 11.72
7 12.31 11.98 12.55 12.4
8 11.91 11.75 13.12 13.3
9 12.46 11.99 11.92 12.25
10 11.67 11.39 11.76 12.18
11 11.52 11.24 12.4 12.69
12 11.74 11.49 11.99 12.43
13 12.45 12 11.91 12.17
14 11.63 11.25 11.69 11.9
15 11.99 11.73 11.73 11.99
62
MASTER CHART
Shuttle Run Test
Experimental Group Control Group
S No Pre-Test Sec Post-Ttest Sec Pre-Test Sec Post-Test Sec
1 9.52 9.4 9.72 9.75
2 9.68 9.55 9.74 9.69
3 9.8 9.67 9.9 9.84
4 9.61 9.46 9.83 9.9
5 9.77 9.58 9.43 9.54
6 9.92 9.75 9.93 9.9
7 9.95 9.82 9.91 9.95
8 9.73 9.54 9.84 9.9
9 9.88 9.67 9.69 9.95
10 9.61 9.43 9.63 9.79
11 9.52 9.27 9.78 9.97
12 9.63 9.38 9.54 9.94
13 9.81 9.54 9.67 9.98
14 9.95 9.59 9.73 9.79
15 9.88 9.66 9.77 9.93
63
MASTER CHART
Lateral Change of Direction Test
Experimental Group Control Group
S No Pre-Test Sec Post-Ttest Sec Pre-Test Sec Post-Test Sec
1 6.3 6.06 6.4 6.38
2 6.56 6.44 6.66 6.8
3 6.48 6.36 6.62 6.68
4 6.21 6.09 6.48 6.69
5 6.42 6.25 6.82 6.93
6 6.55 6.32 6.91 6.94
7 6.75 6.28 6.72 6.88
8 6.82 6.41 6.6 6.9
9 6.66 6.3 6.93 6.99
10 6.77 6.29 6.87 6.96
11 6.57 6.11 6.77 6.9
12 6.38 6.19 6.95 7.12
13 6.46 6.22 6.97 7.22
14 6.87 6.61 6.99 7.18
15 6.91 6.75 6.63 7.2