Int. J. Electrochem. Sci., 6 (2011) 1617 - 1629
International Journal of
ELECTROCHEMICAL
SCIENCE
www.electrochemsci.org
Optimization of Flow Rate for Improving Performance and
Stability of Ni-YSZ based Solid Oxide Fuel Cells Using CH
4Fuel
Jae-ha Myung1, Hyun Jun Ko1,2, Jong-Jin Lee1 and Sang-Hoon Hyun1,* 1
School of Advanced Materials Science and Engineering, Yonsei University, Seoul 120-749, South Korea
2
Specialized Graduate School of Hydrogen & Fuel Cell, Yonsei University, Seoul 120-749, South Korea
*
E-mail: [email protected]
Received: 19 March 2011 / Accepted: 14 April 2011 / Published: 1 May 2011
The advantages of solid oxide fuel cells (SOFCs), compared with other types of fuel cells, include their high energy conversion efficiency and their utilization of hydrocarbon fuels without reformers. Although conventional Ni-based cermet anodes have commonly been used as an anode material with high catalytic properties for H2 fuel, the carbon deposition in Ni-YSZ anodes when hydrocarbon fuels are used directly is a critical problem that results in the destruction of the anode microstructure and abrupt decline in cell performance. Our research focuses on optimizing the flow rate of CH4-fueled Ni-YSZ anode/Ni-YSZ electrolyte/LSM-Ni-YSZ cathode type SOFC unit cells for improving cell performance and better durability. A high power density of 0.75 Wcm-2 at 800 oC, 0.5 Wcm-2 at 700 oC and 0.4 Wcm-2 at 650 oC using CH4 fuel as well as excellent durability were obtained via optimization of CH4 flow rate at 800 oC, 700 oC, and 650 oC operating temperatures. The different types of carbon that cause an increase or decrease in cell performance under certain operating conditions was also investigated.
Keywords: Solid oxide fuel cell, Ni-based anode supported unit cell, durability test, CH4.
1. INTRODUCTION
particle size, and the addition of various catalysts to prevent carbon formation all affect the rate of carbon deposition. Moreover, carbon has diverse structures including adsorbed polymeric, vermicular filaments, carbide, and graphitic, which affect carbon reactivity and result in degradation in catalytic activation [7-8]. Several studies of the characteristics of carbon deposited on Ni-YSZ have been sought to overcome carbon deposition. Alzate-Restrepo et al. [9] found that when current density was increased, less carbon was deposited and that, with increased operating time and anode thickness, deposited carbon became more difficult to remove. Lin, Zhan et al. [10] found that Ni-YSZ anode-supported SOFCs can be operated stably with high applied current density. It is also well known that carbon deposition is suppressed at high S/C ratios, lower operating temperatures, and when new anode catalysts such as ceria, ceramic anode and Alkali metals are used [11-19]. The utilization of carbon as a fuel for solid oxide fuel cells was further investigated by Ihara et al [20]. The CO2 generated by the electrochemical oxidation of carbon reacted with the deposited carbon and produced CO. In turn, this CO can be used as fuel.
In this study, we fabricated Ni-YSZ anode-supported unit cells with a thin YSZ electrolyte using the dip-coating method and examined their maximum power density and durability at various CH4 flow rates at temperatures between 650 oC and 800 oC. The results suggest that some useful small ball carbon may be deposited on the anode and the rate of carbon deposition can be minimized for improved cell performance by optimizing CH4 flow rates at a given operating temperature.
2. EXPERIMENTAL
2. 1. Fabrication of unit cells
Conventional Ni-YSZ anode-supported unit cells were fabricated by uni-axial pressing, dip-coating and screen printing methods. The anode raw materials were NiO (Nickelous Oxide Green, J.T. Baker, USA), coarse YSZ (FYT13.0-010H, Unitec Ceramics, UK), fine YSZ (TZ-8Y, Tosoh, Japan), and carbon black (Raven 430, Columbian Chemical, USA) as pore former. The anode was produced with a mixture of 58.4 wt% NiO, 15.8 wt% coarse YSZ, 15.8 wt% fine YSZ and 10 wt% carbon black by uni-axial pressing method. The pre-sintered anode supports manufactured at 1200 oC were then dipped into fine YSZ slurry to coat them with a thin electrolyte layer. A thinner electrolyte reduces the ohmic resistance associated with the oxygen transport across the electrolyte and minimizes carbon formation on the anode side through a maximal carbon oxidation reaction. The thickness (6-10 ㎛) of YSZ electrolyte was controlled by withdrawal speeds during the dip-coating process, followed by sintering at 1350 oC to obtain a dense YSZ electrolyte. A cathode having a composition of 50 wt% LSM and 50 wt% fine YSZ was screen-printed to obtain 1 cm2 active area on one side of the anode support electrolyte, while the other side was polished to remove the electrolyte coating. Finally, it was sintered at 1150 oC.
2. 2. Cell performance tests
The performance of the Ni-YSZ anode supported unit cells that has 1 cm2 active area was evaluated at various temperatures (650-800 oC) in reactive gases of H2 (200 ccmin-1 in standard ambient temperature and pressure) with either 3 % H2O or CH4 (20-75 ccmin-1 in standard ambient temperature and pressure) with 3 % H2O at the anode and air (500 ccmin-1 in standard ambient temperature and pressure) at the cathode. The I-V characterization and durability were measured with a multi-functional electronic load module (3315D, Taiwan). AC impedance measurements were conducted with a Solatron 1260 frequency analyzer and a Solatron 1287 interface.
2. 3. Characteristics of deposited carbon
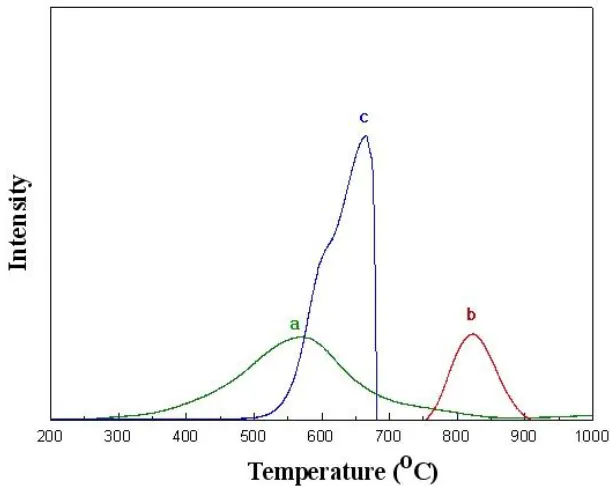
The microstructures of Ni-YSZ anode were observed with a scanning electronic microscope (SEM: Model S4200, Hitachi, Ltd., Japan) to compare the different forms of carbon deposited. The different forms of carbon on the anode were further examined by using temperature-programmed oxidation (TPO: Telcat-M). TPO was measured with a ramping temperature rate of 5 oCmin-1 and gas flow rate of 30 ccmin-1 (20 % O2 and 80 % He).
Carbon that leads to degradation of cell performance and to cracking of the anode microstructure was revealed to be a form of fiber, graphite, or amorphous carbon that is oxidized at 400~700 oC. In contrast, small ball carbon, which can enhance electrical conductivity in metallic phases and greatly improve power density, is oxidized at over 700 oC.
However, if the rate of carbon deposition is not controlled, the small ball carbon can transform into “flower-like” or poly-aromatic carbon through agglomeration [22-24]. Therefore, the optimal operating conditions for using CH4 can be found by distinguishing between these two classes of deposited carbon.
3. RESULTS AND DISCUSSION
3.1. Evaluation of initial cell performance using H2 and CH4
The unit cells were successfully fabricated with a thin electrolyte to obtain high power density by uni-axial pressing and dip-coating methods as shown in the SEM image in figure 1. The unit cell with 10 ㎛-thick YSZ electrolyte showed a maximum power density of 0.4 Wcm-2 with H2 at 800 oC.
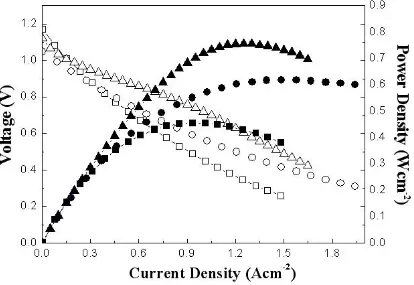
However, the unit cell fabricated with 6 ㎛-thick YSZ electrolyte showed a 50 % improvement in maximum power density of 0.6 Wcm-2, and showed maximum power density of 0.75 Wcm-2 for 30 ccmin-1 of CH4 fuel as shown in figure 2.
Figure 1. SEM image of a cross-sectional area of anode supported electrolyte fabricated by uni-axial pressing and dip-coating methods.
[image:4.596.95.509.418.703.2]
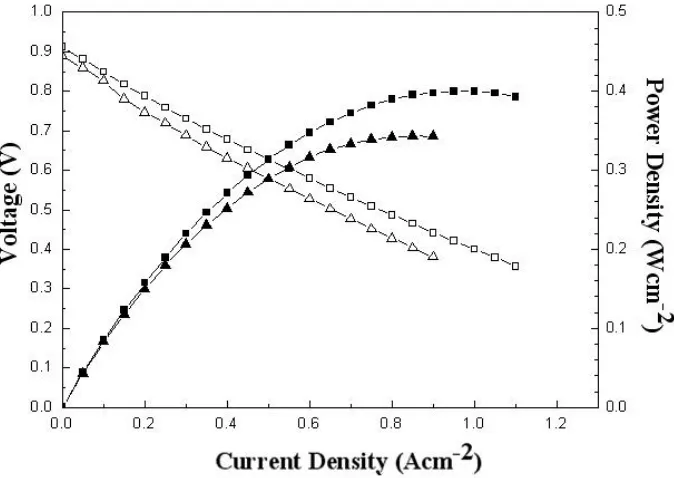
Figure 3. The I-V characteristics of the unit cell with various CH4 flow rates, 25 ( ■ ), 30 ( ● ), 35 ( ▲ ), 55 ( ♦ ), 75 (★ ) with 3% H2O at 800 oC.
3.2. Conditions when fuels are changed ( H2→ CH4)
To operate Ni-YSZ based SOFCs using CH4 with minimal cell degradation, they must be operated under polarization conditions to reduce carbon deposition [25-26]. As well, CH4 concentrations must be gradually increased in order to not affect stability. Moreover, a thinner electrolyte is a major factor to attain higher current densities and reduce carbon formation rates by increasing oxygen transport. The case of a conventional Ni-YSZ unit cell with a 10㎛-thick electrolyte is supplied with 50 ccmin-1 of CH4 flow rate showed rapid degradation in cell performance. However, the stability of a unit cell supplied with an optimized CH4 flow rate (30 ccmin-1) was improved despite lower voltage. On the other hand, a unit cell with a 6 ㎛ minimized thickness of electrolyte at a 30 ccmin-1 CH4 flow rate showed highest initial voltage and better durability as shown in figure 4.
[image:6.596.131.474.123.383.2]
removal as well as the amount of carbon formed during the gas phase reaction is optimized and the resulting minimized carbon deposits enhance electrical conductivity [28].
Figure 4. Long-term stability test of the unit cell with 10 ㎛ thickness of YSZ electrolyte ( ■ ), the unit cell with 6 ㎛ thickness of YSZ electrolyte ( ▲ ) using CH4 (30 ccmin-1) with 3% H2O, and the unit cell with 10 ㎛ thickness of YSZ electrolyte using CH4 (50 ccmin-1) with 3% H2O ( ● ).
[image:6.596.120.470.471.726.2]
3.3. Evaluation of cell performance at various operating temperatures and CH4 flow rates
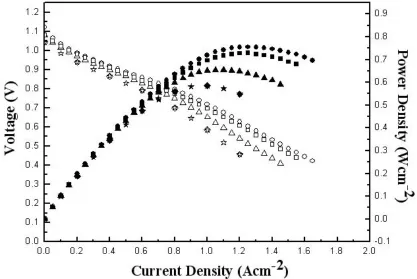
[image:7.596.129.462.157.394.2]The maximum power density for 30 ccmin-1 of CH4 with applied 0.4 current density at 800 oC is 0.71 Wcm-2 for 54 hours of operation without degradation in performance.
Figure 6. The I-V characteristics of the unit cell using 30 ccmin-1 CH4 flow rates ( ■ ), 25 ccmin-1 CH4 flow rate after 96 hours of total operation ( ▲ ) with 3% H2O at 800 oC.
[image:7.596.133.465.459.704.2][image:8.596.127.475.166.410.2]
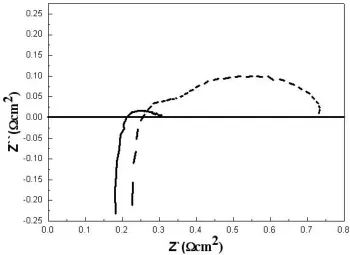
However, a 25 ccmin-1 CH4 flow rate showed 0.65 Wcm-2 of maximum power density and degradation in performance as carbon deposition increased in figure 6. Looking at the impedance spectra data in figure 7, a CH4 flow rate of 30 ccmin-1 showed similar ohmic resistance and anodic polarization resistance for 54 hours of operation.
Figure 8. The I-V characteristics of initial ( ■ ) and after 120 hours of operation (total operation, 200 hours) ( ▲ ) for 25 ccmin-1
CH4 flow rates with 3% H2O at 700 oC.
[image:8.596.139.458.479.713.2]
However, ohmic resistance and anodic polarization resistance gradually increased in the case of 25 ccmin-1 of CH4 at 800 oC. This is because both the rate of carbon removal through electrochemical reaction and the rate of carbon formation during the gas phase reaction are equilibrant and optimal by 30 ccmin-1 flowrate at 800 oC.
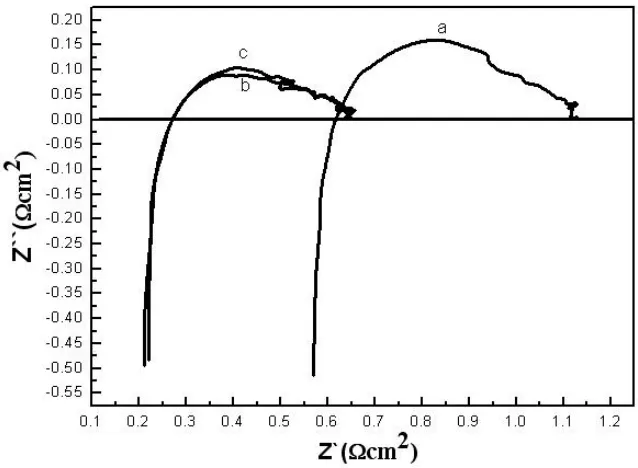
[image:9.596.129.466.253.492.2]We then lowered the operating temperature to 700 oC and then again to 650 oC. The ohmic resistance reduced from 0.58 Ωcm-2 at 800 oC to 0.25 Ωcm-2 at 700 oC despite the decrease in operating temperatures, because the equilibrant condition is reset by 25 ccmin-1 flowrate at 700 oC. As well, after the cell operated for 120 hours at 700 oC with 25 ccmin-1 of CH4, no degradation in cell performance was observed in the I-V curve and impedance spectra as shown in figures 8 and 9.
Figure 10. The I-V characteristics of the unit cell using 25 ccmin-1 CH4 flow rates at initial ( ■ ) and after 170 hours of operation (total operation, 370 hours) ( ▲ ) with 3% H2O at 650 o
C.
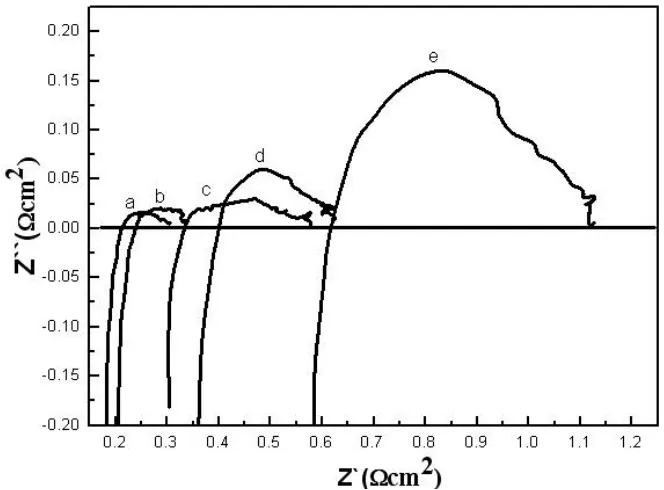
Figure 11. Impedance spectra for initial ( a ), after 27 hours ( b ), after 170 hours ( c ) for 25 ccmin-1 CH4 flow rates with 3% H2O at 650 oC.
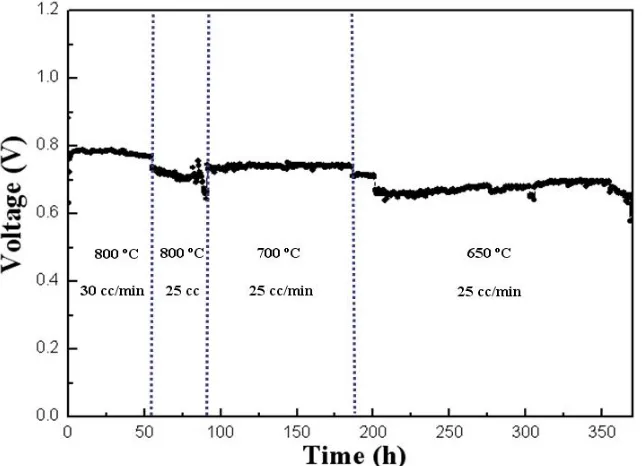
Figure 12. Summarized result of long-term stability test for various temperatures and CH4 flow rate with 0.4 applied current density.
3. 4. Anode analysis after CH4 fueled operation
[image:10.596.141.462.387.620.2][image:11.596.92.488.122.390.2]
images in figure 13 show the different types of carbon that were formed on in the anode near electrochemically active region.
Figure 13. SEM images of the anode section with 30 ccmin-1 CH4 flow rate at initial degradation ( a ) and under stable operation ( b ) and the anode section with 75 ccmin-1 after operation stop ( c ).
[image:11.596.144.449.462.705.2]
The graphite carbon causes cell expansion and provokes a crash in the microstructure of the anode, which is oxidized at around 700 oC. In the case of Ni-YSZ unit cells operated outside of particular operating conditions which are not with optimal CH4 flow rate and under polarization conditions, graphite carbon was deposited on the anode as the SEM image as figure 13c illustrates. Figure 13a shows that fiber or amorphous carbon that is usually oxidized under 600 oC was deposited during initial degradation.
During stable operation, small ball carbon that enhances power density and electrical conductivity is deposited on the anode. Furthermore, small ball carbon did not accumulate and form the poly-aromatic carbons that block the microstructures of anodes during the period of optimized testing as figure 13b illustrates. As shown in figure 14, it is confirmed that the fiber or amorphous carbon at initial degradation is changed to small ball carbon after stabilizing condition. If excessive CH4 supplied in the unit cell, the fiber, amorphous carbon, and graphite are deposited in the anode. The quantities of these carbons are much larger than it of small ball carbon that is deposited at stable condition. The TPO, SEM and voltage graph results illustrate that cell stability and power density gradually improved under optimized CH4 flow rate through the transformation of amorphous carbon into small ball carbon without increasing in the amount of carbon
4. CONCLUSION
Thin YSZ electrolytes (6㎛ thick) can be successfully fabricated on Ni-YSZ anode supports to obtain higher oxygen ionic conductivity by dip-coating them in YSZ slurry. These conventional Ni-YSZ unit cells showed much lower ohmic and anodic polarization resistance and higher performance and improved stability by controlling CH4 flow rates. It was confirmed that the optimal CH4 flow rates for operating CH4-fueled cells are 30 ccmin-1 at 800 oC, 25 ccmin-1 at 700 oC, and 20 ccmin-1 at 650 oC by controlling the amount and the type of carbon deposited under given operating conditions. The CH4 fueled unit cell showed maximum power densities of 0.75, 0.53, and 0.4 Wcm-2 at 800 oC, 700 oC, and 650 oC, respectively, in CH4 humidified with 3 % H2O and operated for over 370 hours without serious degradation.
ACKNOWLEDGEMENTS
This work was supported by the Seoul R&BD Program (CS070157).
References
1. S.A. Barnett In: W. Vielstich, A. Lamm, H. Gasteiger, Editors, Handbook of Fuel Cell Technology IV, Fundamentals of Technology and Applications, p. 1098, Wiley, San Francisco (2003).
2. J. Mermelstein, M. Millan, N.P. Brandon, Chem Eng Sci ., 64, (2009) 492.
3. M. Ni, D.Y.C. Leung, M.K.H. Leung, K. Sumathy, Fuel Processing Technol., 87, (2006) 461. 4. P. McKendry, Bioresource Technol ., 83, (2002) 55.
6. A.L. Dicks, J. Power Sources., 61, (1982) 113.
7. C.H. Bartholomew, Catal. Rev. -Sci. Eng., 24, (1982) 67. 8. P.G. Menon, J. Mol. Catal., 59, (1990) 207.
9. Alzate-Restrepo, J. M. Hill, Appl Catal A Gen., 342, (2008) 49.
10. Y. Lin, Z. Zhan, J. Liu, S.A. Barnett, Solid State Ion., 176, (2005) 1827.
11. T. Hibino, A. Hashimoto, T. Inoue, J.-I. Tokuno, S.-I. Yoshida, M. Sano, Science, 288, (2000) 2031.
12. B.C.H. Steele, Solid State Ion., 86, (1996) 1223.
13. E.P. Murray, T. Tsai, S.A. Barnett, Nature, 400, (1999) 649. 14. S. Park, J.M. Vohs, R.J. Gorte, Nature, 404, (2000) 265.
15. R.H. Cunningham, C.M. Finnerty, R.M. Ormerod In: U. Stimming, S.C. Singhal, H. Tagawa, W. Lehnert, Editors, Proceedings of Fifth International Symposium on Solid Oxide Fuel Cells, p. 973, The Electrochemical Society Proceedings Series, Pennington, NJ (1997).
16. H. Praliaud, M. Primet, G.A. Martin. Appl. Surf. Sci., 17, (1983) 107.
17. H. Praliaud, J.A. Dalmon, C. Mirodatos, G.A. Martin. J. Catal., 97, (1986) 344. 18. J.R. Rostrup-Nielsen, L.J. Christiansen. Appl. Catal. A: General., 126, (1995) 381. 19. J. H. Myung, J. J. Lee, S. H. Hyun, Electrochem. Solid-State Lett., 13, (2010) B43. 20. S. Hasegawa, M. Ihara, J. Electrochem. Soc., 155, (2008) B58.
21. S.D. Kim, H. Moon, S.H. Hyun, J. Moon, J. Kim,H.W. Lee, Solid State Ion., 177, (2006) 931. 22. H. He, J.M. Vohs, R. J. Gorte, J. Power Sources., 144, (2005)135.
23. J. Mermelstein, M. Millan, N. P. Brandon, Chem. Eng. Sci., 64, (2009) 492.
24. C. M. Finnerty, N. J. Coe, R. H. Cunningham, R. M. Ormerod, Catal. Today., 46, (1998) 137. 25. M. Pillai, Y. Lin, H. Zhu, R. J. Kee, S. A. Barnett, J. Power Sources., 195, (2010) 271 . 26. Y. Lin, Z. Zhan, J. Liu and S.A. Barnett, Solid State Ion., 176, (2005)1827.
27. J. Liu, S. A. Barnett, Solid State Ion., 158, (2003)11.
28. H. Kim, C. Lu, W. L. Worrell, J. M. Vohs, R. J. Gorte, J. Electrochem. Soc., 149, (2002) A247.