clusters
.
White Rose Research Online URL for this paper:
http://eprints.whiterose.ac.uk/120260/
Version: Accepted Version
Article:
Parker, R.J., Goodwin, S.P. and Allison, R.J. (2011) The evolution of binary populations in
cool, clumpy star clusters. Monthly Notices of the Royal Astronomical Society, 418 (4). pp.
2565-2575. ISSN 0035-8711
https://doi.org/10.1111/j.1365-2966.2011.19646.x
[email protected]
https://eprints.whiterose.ac.uk/
Reuse
Unless indicated otherwise, fulltext items are protected by copyright with all rights reserved. The copyright
exception in section 29 of the Copyright, Designs and Patents Act 1988 allows the making of a single copy
solely for the purpose of non-commercial research or private study within the limits of fair dealing. The
publisher or other rights-holder may allow further reproduction and re-use of this version - refer to the White
Rose Research Online record for this item. Where records identify the publisher as the copyright holder,
users can verify any specific terms of use on the publisher’s website.
Takedown
If you consider content in White Rose Research Online to be in breach of UK law, please notify us by
arXiv:1108.3566v1 [astro-ph.GA] 17 Aug 2011
The evolution of binary populations in cool, clumpy star
clusters
Richard J. Parker
1⋆, Simon P. Goodwin
2and Richard J. Allison
31 Institute for Astronomy, ETH Z¨urich, Wolfgang-Pauli-Strasse 27, 8093, Z¨urich, Switzerland 2 Department of Physics and Astronomy, University of Sheffield, Sheffield, S3 7RH, UK
3 Zentrum f¨ur Astronomie der Universit¨at Heidelberg, Institut f¨ur Theoretische Astrophysik, Albert-Ueberle-Str. 2, 69120 Heidelberg, Germany
Accepted for publication in MNRAS
ABSTRACT
Observations and theory suggest that star clusters can form in a subvirial (cool) state and are highly substructured. Such initial conditions have been proposed to explain the level of mass segregation in clusters through dynamics, and have also been suc-cessful in explaining the origin of trapezium-like systems. In this paper we investigate, using N-body simulations, whether such a dynamical scenario is consistent with the observed binary properties in the Orion Nebula Cluster (ONC). We find that several different primordial binary populations are consistent with the overall fraction and separation distribution of visual binaries in the ONC (in the range 67 – 670 au), and that these binary systems are heavily processed. The substructured, cool-collapse sce-nario requires a primordial binary fraction approaching 100 per cent. We find that the most important factor in processing the primordial binaries is the initial level of substructure; a highly substructured cluster processes up to 20 per cent more systems than a less substructured cluster because of localised pockets of high stellar density in the substructure. Binaries are processed in the substructure before the cluster reaches its densest phase, suggesting that even clusters remaining in virial equilibrium or un-dergoing supervirial expansion would dynamically alter their primordial binary popu-lation. Therefore even some expanding associations may not preserve their primordial binary population.
Key words: stars: formation – kinematics and dynamics – open clusters and
associ-ations: general – methods: numerical
1 INTRODUCTION
It is thought that the vast majority of stars form in clustered environments (with surface densities of several stars, to sev-eral hundred stars per square parsec, e.g. Lada & Lada 2003; Lada 2010; Portegies Zwart, McMillan & Gieles 2010). Whether all such clusters are dense enough to dynamically process the primordial stellar population is currently the subject of debate (e.g. Bressert et al. 2010). However, there is observational and theoretical evidence that some clusters do at least undergo a dense phase in their evolution, a no-table example being the Orion Nebula Cluster (ONC).
Recent work by Allison et al. (2009) has shown that the observed mass segregation in the ONC can be of a dynamical origin. If a cluster is initially substructured (Allison et al. (2009) used fractals to create substructure) and subvirial, then the cluster undergoes cool-collapse and the most mas-sive stars mass segregate, in some cases forming
trapezium-⋆ E-mail: [email protected]
like systems (Allison & Goodwin 2011). Previously, it had been thought that the mass segregation in the ONC had to be primordial (Bonnell & Davies 1998), as the level of dynamical mass segregation required cannot occur within ∼1 Myr in clusters with smooth radial profiles.
unlikely that the primordial binary population in the ONC was field-like, as the ONC is expanding (indicating that it was much denser in the past and therefore had a higher pri-mordial binary fraction) and there are no wide (>1000 au) binary systems (Scally, Clarke & McCaughrean 1999) (indi-cating that the binary population has been well processed). In this paper, we investigate the effect of dynamical evolution in substructured, subvirial clusters on various pri-mordial binary populations. We run suites ofN-body simu-lations in which we vary the initial amount of substructure, and the proportion of stars in binary systems, and compare the results to the most recent observations of binaries in the ONC. In Section 2 we describe the set-up of the clusters, and the initial binary populations; we present our results in Section 3; we provide a discussion in Section 4, and we conclude in Section 5.
2 METHOD
2.1 Initial conditions
The clusters we simulate have 1500 members, which corre-sponds to a cluster mass of∼103M
⊙. For each set of initial
conditions, we run an ensemble of 10 simulations, identical apart from the random number seed used to initialise the positions, masses and binary properties.
Our clusters are set up as fractals; observations of young unevolved star forming regions indicate a high level of substructure is present (i.e. they do not have a radially smooth profile, e.g. Cartwright & Whitworth 2004; S´anchez & Alfaro 2010; Schmeja 2011, and references therein). The fractal distribution provides a way of creating substructure on all scales. Note that we are not claiming that young star clusters are fractal (although they may be, e.g. Elmegreen & Elmegreen 2001), but the fractal distribu-tion is a relatively simple method of setting up substruc-tured clusters, as the level of substructure is described by just one parameter, the fractal dimension, D. In three di-mensions,D= 1.6 indicates a highly substructured cluster, andD= 3.0 is a roughly uniform sphere.
We set up the fractals according to the method in Goodwin & Whitworth (2004). This begins by defining a cube of side Ndiv (we adopt Ndiv = 2.0 throughout),
in-side of which the fractal is built. A first-generation parent is placed at the centre of the cube, which then spawnsN3
div
subcubes, each containing a first generation child at its cen-tre. The fractal is then built by determining which of the children themselves become parents, and spawn their own offspring. This is determined by the fractal dimension, D, where the probability that the child becomes a parent is given byNdiv(D−3). For a lower fractal dimension fewer chil-dren mature and the final distribution contains more sub-structure. Any children that do not become parents in a given step are removed, along with all of their parents. A small amount of noise is then added to the positions of the remaining children, preventing the cluster from having a gridded appearance and the children become parents of the next generation. Each new parent then spawnsNdiv3
second-generation children inN3
divsub-subcubes, with each
second-generation child having a Ndiv(D−3) probability of becoming a second generation parent. This process is repeated un-til there are substantially more children than required. The
children are pruned to produce a sphere from the cube and are then randomly removed (so maintaining the fractal di-mension) until the required number of children is left. These children then become stars in the cluster.
To determine the velocity structure of the cloud, chil-dren inherit their parent’s velocity plus a random compo-nent that decreases with each generation of the fractal. The children of the first generation are given random velocities from a Gaussian of mean zero. Each new generation inher-its their parent’s velocity plus an extra random component that becomes smaller with each generation. This results in a velocity structure in which nearby stars have similar veloci-ties, but distant stars can have very different velocities. The velocity of every star is scaled to obtain the desired virial ratio of the cluster.
We set up clusters with fractal dimensions ofD = 1.6 (very clumpy), D = 2.0 and D = 3.0 (a roughly uniform sphere), in order to investigate the full parameter space. The clusters are out of virial equilibrium at the start of the simulations and have a virial ratio of Q = 0.3, where we define the virial ratio asQ=T /|Ω|(T and|Ω|are the total kinetic energy and total potential energy of the stars, respectively). Therefore, a cluster with Q= 0.5 is in virial equilibrium and a cluster with Q = 0.3 is ‘subvirial’, or ‘cool’.
To create a stellar system, the mass of the primary star is chosen randomly from a Kroupa (2002) IMF of the form
N(M)∝
M−1.3 m
0< M/M⊙6m1, M−2.3 m
1< M/M⊙6m2, (1)
where m0 = 0.1 M⊙,m1 = 0.5 M⊙, andm2 = 50 M⊙. We
do not include brown dwarfs in the simulations; the binary properties of brown dwarfs and very low mass stars appear to be very different from those of M-, K-, and G-dwarfs (e.g. Burgasser et al. 2007; Thies & Kroupa 2008). For a fuller discussion of the effects of dynamical processing on brown dwarfs we refer the interested reader to the work of Kroupa et al. (2003) and Parker & Goodwin (2011).
We then assign a secondary component to the sys-tem depending on the binary fraction associated with the primary mass. For a field-like binary fraction we divide primaries into four groups. Primary masses in the range 0.1 6 M/M⊙ < 0.47 are M-dwarfs, with a binary
frac-tion of 0.42 (Fischer & Marcy 1992). K-dwarfs have masses in the range 0.47 6 M/M⊙ < 0.84 with a binary
frac-tion of 0.45 (Mayor et al. 1992), and G-dwarfs have masses from 0.84 6 M/M⊙ < 1.2 with a binary fraction
of 0.57 (Duquennoy & Mayor 1991; Raghavan et al. 2010). All stars more massive than 1.2 M⊙ are grouped together
and assigned a binary fraction of unity, as massive stars have a much larger binary fraction than low-mass stars (e.g. Abt et al. 1990; Mason et al. 1998; Kouwenhoven et al. 2005, 2007; Pfalzner & Olczak 2007; Mason et al. 2009, and references therein).
2.2 Binary properties
Secondary masses are drawn from a flat mass ratio distribu-tion; recent work by Reggiani & Meyer (2011) has shown the companion mass ratio of field stars to be consistent with be-ing drawn from a flat distribution, rather than random pair-ing from the IMF. Currently, however, there is no detailed statistical analysis for the ONC. We note that drawing com-panions from a flat distribution means we do not recover a Kroupa IMF.
We draw the periods of the binary systems from two generating functions. Firstly, in accordance with observa-tions of the field, we use the log10-normal fit to the G-dwarfs
in the field by Duquennoy & Mayor (1991, hereafter DM91) – see also Raghavan et al. (2010), which has also been ex-trapolated to fit the period distributions of the K- and M-dwarfs (Mayor et al. 1992; Fischer & Marcy 1992):
f(log10P)∝exp (
−(log10P−log10P) 2
2σ2 log10P
)
, (2)
where log10P= 4.8,σlog10P = 2.3 andP is in days.
Alterna-tively, we draw periods from the initial pre-main sequence period function derived by Kroupa (1995a,b, hereafter K95):
f(log10P) =η
log10P−log10Pmin δ+ (log10P−log10Pmin)2
, (3)
where log10Pmin is the logarithm of the minimum period
in days. We adopt log10Pmin = 0; and η = 3.5 and δ =
100 are the numerical constants adopted by Kroupa (1995a) and Kroupa & Petr-Gotzens (2011) to fit the observed pre-main sequence distributions. We convert the periods to semi-major axes using the masses of the binary components.
The eccentricities of binary stars are drawn from a ther-mal distribution (Heggie 1975; Kroupa 2008) of the form
fe(e) = 2e. (4)
In the sample of Duquennoy & Mayor (1991), close binaries (with periods less than 10 days) are almost exclusively on tidally circularised orbits. We account for this by reselecting the eccentricity of a system if it exceeds the following period-dependent value1:
etid=
1
2[0.95 + tanh (0.6 log10P−1.7)]. (5) We combine the primary and secondary masses of the binaries with their semi-major axes and eccentricities to de-termine the relative velocity and radial components of the stars in each system. The binaries are then placed at the centre of mass and velocity for each system in the fractal. The simulations are run for 10 Myr using thekira
integra-tor in the Starlab package (e.g. Portegies Zwart et al. 1999, 2001). We do not include stellar evolution in the simulations. Details of each simulation are presented in Table 1.
[image:4.612.313.534.185.339.2]1 Kroupa (1995b) and Kroupa (2008) provides a more elaborate ‘eigenevolution’ mechanism to incorporate interactions between the primary star and its protostellar disk during tidal circulari-sation. However, this mechanism also alters the mass ratio distri-bution, causing a deviation from the flat mass ratio distribution observed in the Galactic field (Reggiani & Meyer 2011).
Table 1.A summary of the different cluster properties adopted for the simulations. The values in the columns are: the number of stars in each cluster (Nstars), the typical mass of this cluster (Mcluster), the initial fractal dimension of the cluster (D), the initial binary fraction in the cluster (fbin), and the primordial bi-nary separation distribution (either Duquennoy & Mayor (1991, DM91) or Kroupa (1995a, K95)).
Nstars Mcluster D fbin Separations 1500 ∼103M⊙ 1.6 100 per cent DM91 1500 ∼103M⊙ 1.6 100 per cent K95 1500 ∼103M⊙ 1.6 field-like DM91 1500 ∼103M⊙ 1.6 75 per cent DM91 1500 ∼103M⊙ 2.0 100 per cent DM91 1500 ∼103M⊙ 2.0 100 per cent K95 1500 ∼103M⊙ 2.0 field-like DM91 1500 ∼103M⊙ 2.0 75 per cent DM91 1500 ∼103M⊙ 3.0 100 per cent DM91 1500 ∼103M⊙ 3.0 100 per cent K95 1500 ∼103M⊙ 3.0 field-like DM91 1500 ∼103M⊙ 3.0 75 per cent DM91
3 RESULTS
In this section we will describe the results of dynamical evo-lution on the primordial binary population in subvirial clus-ters with three differing levels of substructure, as set by the fractal dimension. We consider clusters with an initial frac-tal dimensions ofD= 1.6 (highly substructured)D= 2.0, andD= 3.0 (almost no initial substructure). We first exam-ine the evolution of the substructure in the clusters, before following the evolution of the binary populations by looking at the overall binary fractions and separation distributions. We determine whether a star is in a bound binary system using the nearest-neighbour method outlined in Parker et al. (2009) and Kouwenhoven et al. (2010).
3.1 Cluster morphologies and evolution
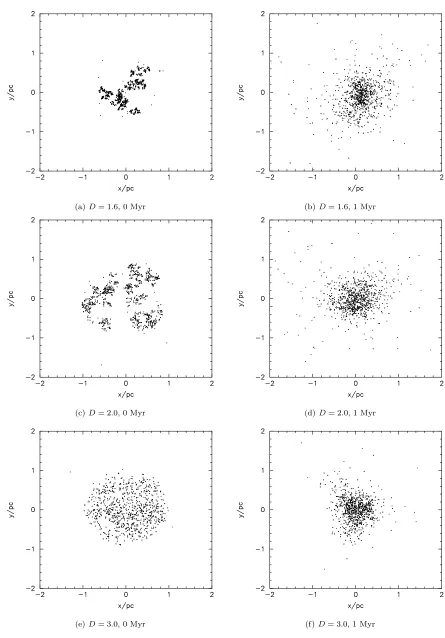
In Fig. 1 we show typical examples of initial cluster mor-phologies for the three initial levels of substructure. As found by Allison et al. (2009, 2010), the clusters collapse on very short timescales (<1 Myr), leading to Plummer sphere-like morphologies on timescales of order the age of the ONC (1 Myr; Jeffries 2007a,b). Irrespective of the initial fractal di-mension, the clusters reach similar morphologies after 1 Myr. In Fig. 2 we show the evolution of a typical cluster ‘core’2 over the lifetime of the simulation. We have picked
a D = 2.0 simulation, but clusters with different fractal dimensions exhibit very similar behaviour. In this figure we plot the core density of the cluster as a function of time. The initial density of the fractal is 330 M⊙pc−3, which increases
to 1920 M⊙pc−3 during the densest phase at 0.9 Myr,
im-mediately after cool-collapse. Following this dense phase the
(a)D= 1.6, 0 Myr (b)D= 1.6, 1 Myr
(c)D= 2.0, 0 Myr (d)D= 2.0, 1 Myr
[image:5.612.68.513.90.728.2](e)D= 3.0, 0 Myr (f)D= 3.0, 1 Myr
Figure 2.The core density of a cluster with fractal dimension
D = 2.0, undergoing cool collapse, as a function of time. The cluster reaches a peak density of 1920 M⊙pc−3at 0.9 Myr.
cluster quickly relaxes and after 10 Myr has a density of 25 M⊙pc−3.
3.2 Evolution of the binary fraction
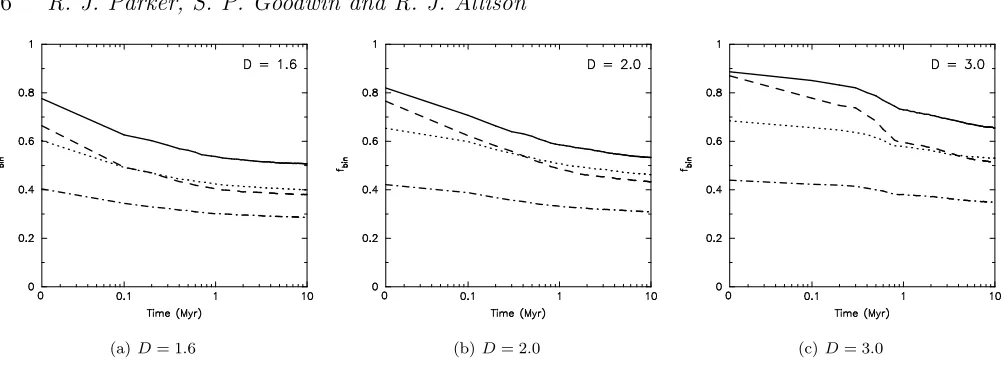
In Fig. 3 we show the evolution of the binary fraction over 10 Myr, averaging together 10 clusters with the same ini-tial fractal dimensions. We show the evolution of the binary fraction for four different primordial binary populations; the DM91 distribution with an initially 100 per cent binary frac-tion (the solid line), the K95 separafrac-tion distribufrac-tion with an initially 100 per cent binary fraction (the dashed line), and the DM91 separation distributions with field-like and 75 per cent initial binary fractions (the dot-dashed and dotted lines, respectively).
The results shown in Fig. 3 are summarised in Ta-ble 2. For the various initial conditions, we show the bi-nary fraction as measured by our algorithm at 0 Myr, 1 Myr and 10 Myr. When considering the evolution of the binary fraction in dense, virialised Plummer spheres, Parker et al. (2009) noted that the cluster was too dense initially for the widest binaries observed in the field to be bound systems. This means that the initial binary fraction in the clusters in Parker et al. (2009) with a 100 per cent primordial bi-nary fraction actually translated into an initial value of 75 per cent for a DM91 separation distribution. The fractal clusters presented here are less dense than these Plummer spheres initially, and the calculated binary fractions are all higher (although none are 100 per cent).
For clusters with a moderate level of substructure (D= 2.0), an initial input binary fraction of 100 per cent, and sep-arations drawn from the DM91 distribution, the measured binary fraction at 0 Myr is 83 per cent, higher than the 75 per cent initial binary fraction in a dense Plummer sphere (Parker et al. 2009).
This effect is even more pronounced for the clusters with a binary fraction of 100 per cent and separations drawn from the K95 distribution. This distribution was derived to reconcile the observed overabundance of wide binaries in young clusters with the DM91 field distribution. Recently,
Table 2.A summary of the results presented in Fig. 3. From left to right, the fractal dimension of the cluster (D), binary separa-tion distribusepara-tion (f(log10P)), initial binary fraction inputted into the simulations (fbin,init), the initial binary fraction as measured by our algorithm (fbin,0 Myr), the binary fraction after 1 Myr (fbin,1 Myr), and the binary fraction after 10 Myr (fbin,10 Myr).
D f(log10P) fbin,init fbin,0 Myr fbin,1 Myr fbin,10 Myr 1.6 DM91 1.00 0.79 0.55 0.51
1.6 K95 1.00 0.68 0.40 0.38
1.6 DM91 0.75 0.62 0.44 0.40 1.6 DM91 0.45 0.41 0.30 0.28 2.0 DM91 1.00 0.83 0.58 0.54
2.0 K95 1.00 0.78 0.48 0.43
2.0 DM91 0.75 0.66 0.51 0.46 2.0 DM91 0.45 0.42 0.34 0.31 3.0 DM91 1.00 0.89 0.74 0.66
3.0 K95 1.00 0.88 0.58 0.51
3.0 DM91 0.75 0.68 0.57 0.53 3.0 DM91 0.45 0.44 0.38 0.35
Marks, Kroupa & Oh (2011) have suggested that a dynam-ical operator (which is a function of the cluster’s density) can be used to transform a K95 distribution to the field dis-tribution in a dense cluster. However, the K95 disdis-tribution saturates a dense cluster with wide binaries which are not physically bound, and it is difficult to see how they could form in such an environment. Marks et al. (2011) suggest this problem could be negated if the cluster formed in a more sparse environment, and then underwent cool collapse, which is exactly the scenario we propose here. However, the calculated initial binary fraction in all the clusters here is significantly lower than 100 per cent (the dashed lines in Fig. 3; see also Table 2), which indicates that very wide bi-naries cannot form in star forming regions; an alternative solution is that they form during cluster dissolution, when two stars are simultaneously ejected in the same direction (e.g. Kouwenhoven et al. 2010; Moeckel & Bate 2010).
The initial and final binary fractions depend heavily on the level of substructure. Comparing the simulations with
D = 1.6 (highly substructured), to those with D = 3.0 (uniform spheres), we see that the initial binary fraction is higher by 10 per cent for the uniform sphere (0.89 versus 0.79), and after 10 Myr the difference is still significant, with a binary fraction of 0.66 for theD= 3.0 model versus 0.51 forD= 1.6 model.
Indeed, comparison of Figs. 3(a) and 3(b) with the over-all evolution of the cluster in Fig. 2 shows that the vast ma-jority of binary processing occurs before the cluster reaches its densest phase (after 0.9 Myr). This is due to pockets of lo-calised density in the substructure, which dynamically pro-cess the binary populations. In the case of a cluster with almost no initial substructure (Fig. 3(c)), we see that there is very little binary processing until the cluster has almost reached its densest phase at collapse (note the sudden drop in binary fraction between 0.3 and 0.9 Myr, which corre-sponds to the density peak in Fig. 2).
[image:6.612.305.564.183.338.2]clus-(a)D= 1.6 (b)D= 2.0 (c)D= 3.0
Figure 3.The evolution of the binary fraction in clusters with different amounts of substructure; (a) a very clumpy cluster (fractal dimension D = 1.6), (b) a moderately substructured cluster (D = 2.0) and (c) a roughly uniform sphere (D = 3.0). Four different primordial binary populations are shown; (i) an initially 100 per cent binary fraction with the DM91 separation distribution (the solid line), (ii) an initially 100 per cent binary fraction with the K95 pre-main sequence separation distribution (the dashed line), (iii) a DM91 separation distribution with an initially field-like binary fraction (the dot-dashed line), and (iv) a DM91 separation distribution with an initially 75 per cent binary fraction (the dotted line).
ter suggests that substructured clusters in virial equilibrium and those undergoing expansion would also process any pri-mordial binary population.
Petr et al. (1998) and Reipurth et al. (2007) estimate that the binary fraction in the ONC is consistent with the field value, i.e. between 40 and 60 per cent, depending on the spectral type of the primary. We note from Fig. 3 and Table 2 that dynamical processing reduces the overall binary fraction to such an extent that the initial binary fraction cannot be that of the field. Even in the smooth clusters, the binary fraction at 1 Myr is less than 40 per cent. For the other initial conditions (D = 1.6 or D = 2.0), the binary fraction in the ONC at 1 Myr can be reproduced (within the uncertainties) if the initial binary fraction was 75 per cent or higher.
3.3 The complete binary separation distribution
We evolve clusters with two different initial separation dis-tributions. We consider clusters with separations drawn from the log10-normal distribution observed for main
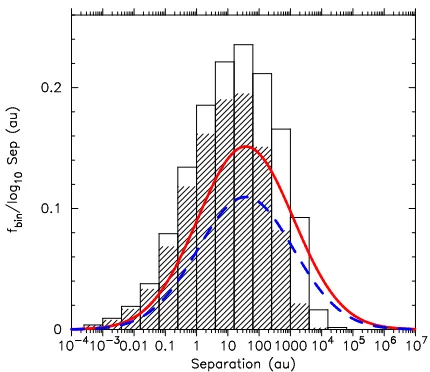
se-quence binaries in the field (Duquennoy & Mayor 1991; Raghavan et al. 2010), and also the inferred pre-main se-quence distribution in Kroupa (1995a). Three out of four clusters have the DM91 separation distribution with vary-ing primordial binary fractions; 100 per cent, 75 per cent and field-like; whereas the final cluster has the K95 separation distribution. The initial separation distributions (the open histograms), and the distributions after 1 Myr (the hashed histograms) are shown in Fig. 4. For comparison we show the log10-normal fits to the separation distributions of field
G-dwarfs (the (red) solid line), and field M-G-dwarfs (the (blue) dashed line).
From inspection, we see that the results are simi-lar to those obtained with the virialised, dense Plummer sphere models presented in Parker et al. (2009, see their figs. 2 and 3). In the model in which we use the field sepa-ration distribution and binary fraction as our initial
con-ditions, a significant amount of dynamical processing re-duces the number of intermediate binaries, leading to an overall deficit of systems compared to the field. As found by Kroupa et al. (1999), the K95 separation distribution is reduced by interactions to the extent that the resultant sep-aration distribution resembles that of the field for close and intermediate separation binaries.
However, as noted by Parker et al. (2009), and subse-quent authors (Kouwenhoven et al. 2010; Moeckel & Bate 2010), no cluster undergoing a dense phase will pre-serve the wide binary systems obpre-served in the field, and other mechanisms are required to explain such sys-tems (Kouwenhoven et al. 2010; Moeckel & Bate 2010; Moeckel & Clarke 2011).
3.4 Visual binaries in the ONC
Furthermore, we note that the field binary population is probably the sum of many differing star formation re-gions (Brandner & K¨ohler 1998; Goodwin 2010), not all of which will have undergone the cool-collapse scenario pre-sented here. Additionally, the most recent and complete observational census of binary systems in the ONC by Reipurth et al. (2007) only considers visual binaries with separations in the range 67 – 670 au. For this reason, it makes more sense to compare the results of our simulations to the data from Reipurth et al., rather than the field sep-aration distribution. The data from Reipurth et al. (2007) are shown by the (green) crosses in Figs. 5, 6 and 7. We show our separation distributions (in the same range as Reipurth et al. (2007)) after 1 Myr of dynamical evolution with the histograms (and the corresponding error bars from averaging together 10 simulations for each plot).
(a) 100 per cent binary fraction, DM91 separation distri-bution
(b) 100 per cent binary fraction, K95 separation distribu-tion
[image:8.612.68.283.97.283.2](c) Field binary fraction, DM91 separation distribution (d) 75 per cent binary fraction, DM91 separation distri-bution
Figure 4. The full separation distributions at 0 Myr (open histograms) and 1 Myr (hashed histograms) for clusters with an initial fractal dimensionD= 2.0. Four different primordial binary population set-ups are presented, and the log10-normal fits to the separation distributions for G-dwarfs and M-dwarfs in the field (the (red) solid and (blue) dashed lines, respectively) are shown for comparison.
from the clusters with smooth initial conditions (Fig. 7(c)). However, this cannot be the primordial binary population of the ONC because the overall binary fraction is lower than is observed (the dot-dashed line in Fig. 3(c)).
Secondly, and following on from this, the other separa-tion distribusepara-tions for binaries in initially smooth clusters show that the number of visual binaries is overproduced (Figs. 7(a), 7(b) and 7(d)).
Finally, we see from inspection of Figs. 5 and 6 that
all populations with an initial binary fraction of either 75
per cent or 100 per cent reproduce the observed separa-tion distribusepara-tion within the uncertainties, suggesting that there must have been an overabundance of binaries with separations in this range at the birth of the cluster. Be-cause of the highly uncertain binary fraction in the ONC
(Petr et al. 1998; Kaczmarek et al. 2011), we see from in-spection of Fig. 3 that clusters with an initial fractal di-mension ofD = 2.0 or 1.6 are equally consistent with the observations, assuming either a DM91 or K95 initial sepa-ration distribution, and a binary fraction between 0.75 and unity.
4 DISCUSSION
bi-(a) 100 per cent binary fraction, DM91 separation distribution (b) 100 per cent binary fraction, K95 separation distribution
[image:9.612.53.544.84.545.2](c) Field binary fraction, DM91 separation distribution (d) 75 per cent binary fraction, DM91 separation distribution
Figure 5.Comparison with the data for visual binaries in the ONC from Reipurth et al. (2007). Reipurth et al.’s data are shown by the (green) crosses with corresponding error bars. The separation distribution, normalised to the binary fraction at 1 Myr, from our simulations in clusters with an initial fractal dimensionD = 1.6, are shown by the histograms. Four different primordial binary population set-ups are presented, and the log10-normal fits to the separation distributions for G-dwarfs and M-dwarfs in the field (the (red) solid and (blue) dashed lines, respectively) are shown for comparison.
nary populations, which are characterised by the primordial binary fraction and binary separation distribution. Obser-vations indicate that many young star forming regions are both substructured, and that stars form with subvirial ve-locities (e.g. Peretto et al. 2006; Proszkow et al. 2009). Star clusters with these characteristics were used by Allison et al. (2009, 2010) to show that mass segregation in the ONC can occur dynamically on a very short timescale (1 Myr), negat-ing the need for primordial mass segregation in the ONC (Bonnell & Davies 1998). Furthermore, Allison & Goodwin
(2011) have shown that trapezium-like systems regularly form in such simulations, suggesting the cool-collapse of a clumpy cluster could be the most likely dynamical evolution scenario for the ONC. The most favourable initial conditions for this dynamical mass segregation (and the formation of the Trapezium system) are a clumpy (D62.0), cool (Q <
0.4) cluster (Allison et al. 2009, 2010; Allison & Goodwin 2011).
(a) 100 per cent binary fraction, DM91 separation distribution (b) 100 per cent binary fraction, K95 separation distribution
[image:10.612.57.538.75.555.2](c) Field binary fraction, DM91 separation distribution (d) 75 per cent binary fraction, DM91 separation distribution
Figure 6.Comparison with the data for visual binaries in the ONC from Reipurth et al. (2007). Reipurth et al.’s data are shown by the (green) crosses with corresponding error bars. The separation distribution, normalised to the binary fraction at 1 Myr, from our simulations in clusters with an initial fractal dimensionD = 2.0, are shown by the histograms. Four different primordial binary population set-ups are presented, and the log10-normal fits to the separation distributions for G-dwarfs and M-dwarfs in the field (the (red) solid and (blue) dashed lines, respectively) are shown for comparison.
from the Trapezium) appear to be subvirial and in cool col-lapse (Feigelson et al. 2005; Tobin et al. 2009), whereas the velocity dispersion in the centre is 4.3 kms−1, much higher
than the value we would expect if the ONC was in virial equi-librium (2.5 kms−1 – Olczak et al. 2008). This suggests that
the centre of the ONC has already undergone cool-collapse, and is now expanding.
However, for simplicity Allison et al. (2009) did not in-clude primordial binaries in their simulations. The binary fraction in the ONC is not negligible, and is consistent with
separa-(a) 100 per cent binary fraction, DM91 separation distribution (b) 100 per cent binary fraction, K95 separation distribution
[image:11.612.57.540.85.554.2](c) Field binary fraction, DM91 separation distribution (d) 75 per cent binary fraction, DM91 separation distribution
Figure 7.Comparison with the data for visual binaries in the ONC from Reipurth et al. (2007). Reipurth et al.’s data are shown by the (green) crosses with corresponding error bars. The separation distribution, normalised to the binary fraction at 1 Myr, from our simulations in clusters with an initial fractal dimensionD = 3.0, are shown by the histograms. Four different primordial binary population set-ups are presented, and the log10-normal fits to the separation distributions for G-dwarfs and M-dwarfs in the field (the (red) solid and (blue) dashed lines, respectively) are shown for comparison.
tion distribution, then this provides strong support for such a theory. However, it is unclear how a significant number of binaries could form in such a dense environment (Bate 2009; Parker et al. 2009; Moeckel & Bate 2010). An alter-native scenario is that the initial density of the cluster is such that binary formation is not impeded, but the cluster then undergoes a dense phase via the collapse of a substruc-tured fractal (Allison et al. 2009, 2010). An excellent test of this hypothesis is to study the effects of cool-collapse on a primordial binary population.
primor-dial binary populations, we can constrain the primorprimor-dial bi-nary fractionandseparation distribution (in this separation
range) based on comparison with the Reipurth et al. (2007) data.
Direct comparison of the observations with our simu-lations is presented for each initial level of subclustering in Figs. 5, 6 and 7. Firstly, we note that the process of cool-collapse in clusters can reproduce the observed separa-tion distribusepara-tion to zeroth order for most primordial binary populations. Clusters with a moderate to high level of sub-clustering cannot preserve enough binaries in the separation range 67 – 670 au for an initially field-like binary fraction (Figs. 6(c) and 5(c)). If we start the cluster as a uniform sphere (D= 3.0), then it is possible to reproduce the obser-vations with a field-like binary fraction and separation dis-tribution (Fig. 7(c)). However, the overall binary fraction for the cluster is still too low (Fig. 3(c)), suggesting that even in this more placid dynamical scenario, the primordial binary fraction has to be larger than the present day. Furthermore, all other initial binary populations do not undergo enough processing to suggest that this fractal dimension is a realistic initial condition for the ONC.
A moderate level of of substructure (D= 2.0) results in excellent agreement with the observations of Reipurth et al. (2007) for clusters with DM91 separation distributions and primordial binary fractions of 100 or 75 per cent (Figs. 6(a) and 6(d), respectively). In clusters with very clumpy initial conditions (D= 1.6), the level of dynamical processing is too extreme in all but the cluster with a DM91 separation distribution and a 100 per cent primordial binary fraction (Fig. 5(a)) to be reconciled with the observations of Reipurth et al. (2007).
As discussed in Allison et al. (2010) and Allison & Goodwin (2011), dynamical mass segrega-tion and the formasegrega-tion of trapezium systems can be very transient. In order to reproduce the observed level of mass segregation it is favourable to have clumpy initial conditions. If we assume that clumpy, cool initial conditions are required for the ONC to mass segregate and form the Trapezium system, then the observed binary fraction and separation distribution requires an initially higher binary fraction (∼70 – 80 per cent) than is observed today.
Finally, we note that if the clusters are initially clumpy, the majority of binaries are processed before the cluster reaches its densest phase during the collapse. This is be-cause the pockets of substructure are dense enough initially to affect the binaries, and suggests that all star clusters that form with substructure will process a primordial binary pop-ulation, irrespective of whether the cluster undergoes cool-collapse (which exacerbates the processing), remains in virial equilibrium, or expands.
Therefore, even some expanding associations which form supervirial/unbound may not preserve their primor-dial binary populations. However, we note that the frac-tals we set up have initial densities of ∼300 M⊙pc−3 (see
Fig. 2), which are higher than many star forming regions that will subsequently become unbound associations (e.g. Jørgensen et al. 2008; Gutermuth et al. 2009; Bressert et al. 2010). We will further investigate the effects of dynamical evolution on such sparse regions in a future paper.
5 CONCLUSIONS
We present the results ofN-body simulations of fractal star clusters containingN= 1500 stars in cool-collapse, in order to investigate the effect of this dynamical evolution scenario on various primordial binary populations. We have varied the initial level of substructure in the cluster, the primordial binary fraction, and the initial separation distribution. Our conclusions can be summarised as follows:
(i) Primordial binary populations are heavily processed in clusters undergoing cool-collapse. Qualitatively, the re-sults are similar to those from dynamical evolution of the binary population in initially very dense virialised Plummer spheres (Kroupa et al. 1999; Parker et al. 2009).
(ii) The level of dynamical processing varies as a func-tion of the fractal dimension; clumpy clusters break up more binaries than smoother clusters.
(iii) The majority of dynamical processing in substruc-tured clusters occurs before the cluster reaches its densest phase; therefore, it is the initial densities in the substruc-ture which is the most significant contributor to altering the binary population, rather than the cool-collapse itself. This suggests that even some star-forming regions that do not collapse will significantly process a primordial binary popu-lation.
(iv) If clusters undergo cool-collapse, then the field bi-nary fraction and separation distribution cannot be the pri-mordial distribution in the ONC. Comparison of our simu-lations with observations suggests that the ONC had a pri-mordial binary fraction of between 75 and 100 per cent.
We demonstrate that the cool-collapse scenario, which is consistent with the filamentary, subvirial early phases of star formation, and can explain the level of mass segregation in the ONC through dynamics, also reproduces the observed binary fraction and separation distribution. If a moderate to high level of substructure is required to produce dynamical mass segregation, then an∼80 per cent binary fraction, and field-like separation distribution with a cut-off around 5× 10³au represents the most likely initial binary population.
ACKNOWLEDGEMENTS
We thank the anonymous referee for their prompt report and helpful suggestions on the original draft. The simula-tions in this work were performed on theBRUTUScomputing cluster at ETH Z¨urich. RJA acknowledges support from the Alexander von Humboldt Foundation in the form of a re-search fellowship.
REFERENCES
Abt H. A., Gomez A. E., Levy S. G., 1990, ApJS, 74, 551 Allison R. J., Goodwin S. P., 2011, MNRAS, 415, 1967 Allison R. J., Goodwin S. P., Parker R. J., de Grijs R.,
Portegies Zwart S. F., Kouwenhoven M. B. N., 2009, ApJ, 700, L99
Allison R. J., Goodwin S. P., Parker R. J., Portegies Zwart S. F., de Grijs R., 2010, MNRAS, 407, 1098
Bate M. R., 2009, MNRAS, 392, 590
Bressert E., Bastian N., Gutermuth R., Megeath S. T., Allen L., Evans, II N. J., Rebull L. M., Hatchell J., John-stone D., Bourke T. L., Cieza L. A., Harvey P. M., Merin B., Ray T. P., Tothill N. F. H., 2010, MNRAS, 409, L54 Burgasser A. J., Reid I. N., Siegler N., Close L., Allen P.,
Lowrance P., Gizis J., 2007, in Reipurth B., Jewitt D., Keil K., eds, Protostars and Planets V Not Alone: Tracing the Origins of Very Low Mass Stars and Brown Dwarfs through Multiplicity Studies. pp 427–441
Cartwright A., Whitworth A. P., 2004, MNRAS, 348, 589 Duquennoy A., Mayor M., 1991, A&A, 248, 485
Elmegreen B. G., Elmegreen D. M., 2001, AJ, 121, 1507 Feigelson E. D., Getman K., Townsley L., Garmire G.,
Preibisch T., Grosso N., Montmerle T., Muench A., Mc-Caughrean M., 2005, ApJS, 160, 379
Fischer D. A., Marcy G. W., 1992, ApJ, 396, 178
Goodwin S. P., 2010, Royal Society of London Philosophi-cal Transactions Series A, 368, 851
Goodwin S. P., Kroupa P., 2005, A&A, 439, 565 Goodwin S. P., Whitworth A. P., 2004, A&A, 413, 929 Gutermuth R. A., Megeath S. T., Myers P. C., Allen L. E.,
Fazio J. L. P. G. G., 2009, ApJS, 184, 18 Heggie D. C., 1975, MNRAS, 173, 729 Hills J. G., 1975, AJ, 80, 809
Jeffries R. D., 2007a, MNRAS, 376, 1109 Jeffries R. D., 2007b, MNRAS, 381, 1169
Jørgensen J. K., Johnstone D., Kirk H., Myers P. C., Allen L. E., Shirley Y. L., 2008, ApJ, 683, 822
Kaczmarek T., Olczak C., Pfalzner S., 2011, A&A, 528, 144 Kouwenhoven M. B. N., Brown A. G. A., Portegies Zwart
S. F., Kaper L., 2007, A&A, 474, 77
Kouwenhoven M. B. N., Brown A. G. A., Zinnecker H., Kaper L., Portegies Zwart S. F., 2005, A&A, 430, 137 Kouwenhoven M. B. N., Goodwin S. P., Parker R. J.,
Davies M. B., Malmberg D., Kroupa P., 2010, MNRAS, 404, 1835
Kroupa P., 1995a, MNRAS, 277, 1491 Kroupa P., 1995b, MNRAS, 277, 1507 Kroupa P., 2002, Science, 295, 82
Kroupa P., 2008, in Aarseth S. J., Tout C. A., Mardling R. A., eds, Lecture Notes in Physics, Berlin Springer Ver-lag Vol. 760 of Lecture Notes in Physics, Berlin Springer Verlag, Initial Conditions for Star Clusters. pp 181–259 Kroupa P., Bouvier J., Duchˆene G., Moraux E., 2003,
MN-RAS, 346, 354
Kroupa P., Petr M. G., McCaughrean M. J., 1999, New Astronomy, 4, 495
Kroupa P., Petr-Gotzens M. G., 2011, A&A, 529, 92 Lada C. J., 2010, Royal Society of London Philosophical
Transactions Series A, 368, 713
Lada C. J., Lada E. A., 2003, ARA&A, 41, 57
Marks M., Kroupa P., Oh S., 2011, MNRAS, accepted, arXiv: 1106.5050
Mason B. D., Gies D. R., Hartkopf W. I., W. G. Bagnuolo J., ten Brummelaar T., McAlister H. A., 1998, AJ, 115, 821
Mason B. D., Hartkopf W. I., Gies D. R., Henry T. J., Helsel J. W., 2009, AJ, 137, 3358
Mayor M., Duquennoy A., Halbwachs L., Mermilliod J.-C., 1992, in McAlister H. A., Hartkopf W. I., eds, IAU Colloq. 135: Complementary Approaches to Double and Multiple Star Research Vol. 32 of ASP Conference Series,
CORAVEL Surveys to Study Binaries of Different Masses and Ages. IAU, pp 73–81
Moeckel N., Bate M. R., 2010, MNRAS, 404, 721 Moeckel N., Clarke C. J., 2011, MNRAS, 415, 1179 Olczak C., Pfalzner S., Eckart A., 2008, A&A, 488, 191 Parker R. J., Goodwin S. P., 2011, MNRAS, 411, 891 Parker R. J., Goodwin S. P., Kroupa P., Kouwenhoven M.
B. N., 2009, MNRAS, 397, 1577
Peretto N., Andr´e P., Belloche A., 2006, A&A, 445, 979 Petr M. G., Coud´e Du Foresto V., Beckwith S. V. W.,
Richichi A., McCaughrean M. J., 1998, ApJ, 500, 825 Pfalzner S., Olczak C., 2007, A&A, 475, 875
Portegies Zwart S. F., McMillan S. L. W., Gieles M., 2010, ARA&A, 48, 431
Portegies Zwart S. F., McMillan S. L. W., Hut P., Makino J., 2001, MNRAS, 321, 199
Portegies Zwart S. F., Makino J., McMillan S. L. W., Hut P., 1999, A&A, 348, 117
Proszkow E.-M., Adams F. C., Hartmann L. W., Tobin J. J., 2009, ApJ, 697, 1020
Raghavan D., McMaster H. A., Henry T. J., Latham D. W., Marcy G. W., Mason B. D., Gies D. R., White R. J., ten Brummelaar T. A., 2010, ApJSS, 190, 1
Reggiani M. M., Meyer M. R., 2011, ApJ, 738, 60 Reipurth B., Guimar˜aes M. M., Connelley M. S., Bally J.,
2007, AJ, 134, 2272
S´anchez N., Alfaro E. J., 2010, in IAU Symposium Vol. 266 of IAU Symposium, The spatial distribution of stars in open clusters. pp 524–527
Scally A., Clarke C., McCaughrean M. J., 1999, MNRAS, 306, 253
Schmeja S., 2011, AN, 332, 172
Thies I., Kroupa P., 2008, MNRAS, 390, 1200