http://eprints.whiterose.ac.uk/146989/
Version: Published Version
Article:
Rantala, J.K. orcid.org/0000-0002-4999-5585, Makela, R., Aaltola, A.-R. et al. (5 more
authors) (2011) A cell spot microarray method for production of high density siRNA
transfection microarrays. BMC Genomics, 12. 162. ISSN 1471-2164
https://doi.org/10.1186/1471-2164-12-162
[email protected] https://eprints.whiterose.ac.uk/
Reuse
This article is distributed under the terms of the Creative Commons Attribution (CC BY) licence. This licence allows you to distribute, remix, tweak, and build upon the work, even commercially, as long as you credit the authors for the original work. More information and the full terms of the licence here:
https://creativecommons.org/licenses/
Takedown
If you consider content in White Rose Research Online to be in breach of UK law, please notify us by
high density siRNA transfection microarrays
Rantala
et al
.
M E T H O D O L O G Y A R T I C L E
Open Access
A cell spot microarray method for production of
high density siRNA transfection microarrays
Juha K Rantala
1*, Rami Mäkelä
1, Anna-Riina Aaltola
1, Petra Laasola
1, John-Patrick Mpindi
1,2, Matthias Nees
1,
Petri Saviranta
1and Olli Kallioniemi
1,2*Abstract
Background:High-throughput RNAi screening is widely applied in biological research, but remains expensive, infrastructure-intensive and conversion of many assays to HTS applications in microplate format is not feasible.
Results:Here, we describe the optimization of a miniaturized cell spot microarray (CSMA) method, which facilitates utilization of the transfection microarray technique for disparate RNAi analyses. To promote rapid adaptation of the method, the concept has been tested with a panel of 92 adherent cell types, including primary human cells. We demonstrate the method in the systematic screening of 492 GPCR coding genes for impact on growth and survival of cultured human prostate cancer cells.
Conclusions:The CSMA method facilitates reproducible preparation of highly parallel cell microarrays for large-scale gene knockdown analyses. This will be critical towards expanding the cell based functional genetic screens to include more RNAi constructs, allow combinatorial RNAi analyses, multi-parametric phenotypic readouts or
comparative analysis of many different cell types.
Background
High-throughput screening (HTS) of cellular effects of RNA interference libraries (siRNA or shRNAs) is now being increasingly applied to explore the role of genes in specific cell biological processes and disease states. However, the technology is still limited to specialty laboratories due to the requirements for robotic infra-structure, access to expensive reagent libraries, expertise in HTS assay development, standardization, data analysis and applications.
Currently, most described systemic-scale RNAi studies have been performed using microplate based screening platforms. Due to the high reagent demand of well based applications, these studies are often restricted to the analysis of a single parameter [1-3], cell morphology [4,5] or reporter gene assays [6-8] at a time. Though well suited for specific biological questions, this provides a restricted view on cell biology and furthermore, many informative assays cannot be converted to HTS format in microplate based platforms due to methodological
limitations or cost considerations. In the future, a signif-icant increase in the platform flexibility and decrease in screening costs will be required to expand functional large-scale screens to include more RNAi constructs, allow combinatorial siRNA analyses (e.g. gene-gene, gene-drug or gene-condition interaction), multi-para-metric phenotypic readouts or comparative analysis of many different cell types. Such comprehensive perturba-tion of gene networks in cells will be critical towards understanding of cell and cancer biology as well as the discovery of novel therapeutic opportunities.
The transfection cell microarray technology has been proposed as a new platform for large-scale RNAi ana-lyses allowing significant increase in experiment throughput and reduction in screening costs. The initial publication of transfection cell microarrays described reverse transfection of cDNAs to adherent cells [9]. Cells were grown as a uniform carpet over a printed microarray consisting of cDNA expression constructs and lipid transfection reagent resulting in the overex-pression of the target genes in living cells. The concept was then adapted to RNAi analysis with description of cell carpet arrays for transfection of synthetic siRNAs to adherent cells [10,11]. After these primary publications, * Correspondence: [email protected]; [email protected]
1
Medical Biotechnology, VTT Technical Research Centre of Finland, 20521 Turku, Finland
Full list of author information is available at the end of the article
several groups have reported further development and application of different types of cell microarray methods [12-20]. For example, these methods have been used extensively to investigate cell cycle in human cancer cells [21]. Though the cell microarrays have slowly evolved to become a more widely accepted screening technology, in many publications, the individual arrays have contained only a modest number of samples, and data from multiple small arrays have been combined for large-scale coverage due to technological limitations of the methods [16,20,21].
Here, we describe the optimization of a cell spot microarray (CSMA) method with the future systemic-scale research needs in mind. The method provides a patterned array platform with spatially confined cell spots that allow simple production of cell microarrays with significantly increased sample coverage in micro-plate-sized array plates readily compatible with standard imaging instruments. The confined cell spot pattern also facilitates automated imaging and analysis of the arrays with multiparametric assays otherwise difficult or non-feasible in HTS. To allow rapid adaptation of the techni-que we optimized an application protocol of the CSMA cell patterning method for 85 cell types and applied the platform for functional genetics profiling of G-protein coupled receptor coding genes in cultured prostate can-cer cells and non-malignant epithelial prostate cells, demonstrating the potential of the CSMAs for context specific target discovery.
Results
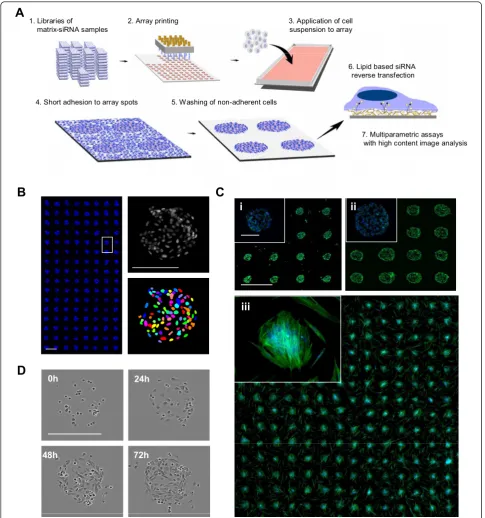
Cell spot microarray method
In the CSMA method siRNA samples complexed with lipid transfection agent and extracellular matrix compo-nents are microarrayed with contact printing to a micro-plate sized array micro-plate with a hydrophobic polystyrene surface (Figure 1A). Adherent cells are dispersed over the array as suspension and allowed to adhere for a short period, commonly 5 to 15 minutes before unadhered cells, unable to make permanent contact onto the array background during the initial adherence incubation, are washed off. After the wash step cells are left growing only on the spatially confined spots, providing a platform compatible for ultra-high sample densities and simplified imaging and quantification of cells on the siRNA spots (Figure 1B). As the patterning of adhesion promoting siRNA-matrix samples onto the arrays is done with con-tact printing the diameter of array spots and hence num-ber of cells per spot can be controlled with printing pin diameter. Number of cells per spot is though dependent on the characteristics and growth properties of the cells. With epithelial derived PC-3 prostate cancer cells, num-ber of cells on 200μm spots following 48 h culture was
51 ± 3 (s.d., replicate spots n = 100) and 151 ± 8 on 400
μm spots. With primary un-immortalized prostate
stro-mal cells, number of cells on 200μm spots was 21 ± 6 (s.
d., n = 192 spots) (Figure 1C). A microscopic 72 h time-lapse imaging of PC-3 cells growing on a 200μm CSMA
spot (Figure 1D and Additional file 1) indicates how cells continue to prefer the printed matrix surface for their growth for several days.
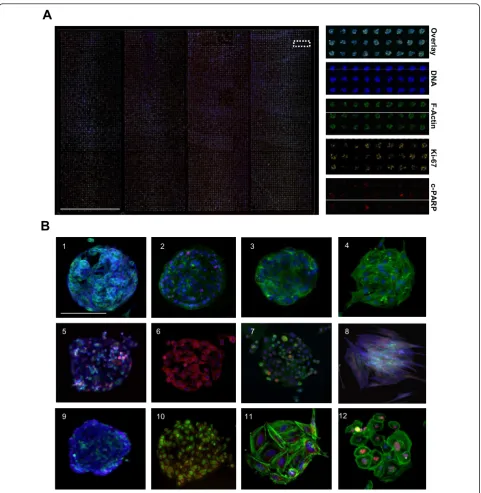
Due to the high precision of contact microarray print-ing the method can be scaled for ultra-high sample densi-ties. With 200μm array spots and 500μm spot spacing,
arrays with 3,888 spots in an area of 18 × 54 mm or 15,552 spots in a single microplate-sized vessel with four large rectangular wells could be printed (Figure 2A) [22]. To achieve an array format compatible with majority of commonly used adherent cell types, different array sur-face materials were tested in combinations with different ECM protein coatings, cell dissociation procedures and adhesion incubation times for different cell types. Array-ing of Matrigel ECM mixture onto a polystyrene surface with a hydrophobic surface charge was found to facilitate spatially restricted adhesion of majority of tested cell types (92%, 85/92) (Figure 2B). Although untreated poly-styrene is not cell-repellent and cells are eventually able to adhere also to the array background, use of a non-enzymatic cell dissociation reagent and restricted cell adhesion time was found to significantly enhance spatial adherence of all tested cell types onto the array spots over the plain plastic background. With VCaP prostate cancer cells, the incubation time required for adhesion of cells to CSMA spots was shortened by 48-fold in com-parison to the trypsin based cell dissociation technique (15 min vs. 12 h). Since the same array spot composition supported adhesion and growth of majority of tested cell types it was only necessary to optimize the cell dissocia-tion method and adhesion time for each cell type [Addi-tional file 2].
siRNA reverse transfection on CSMAs
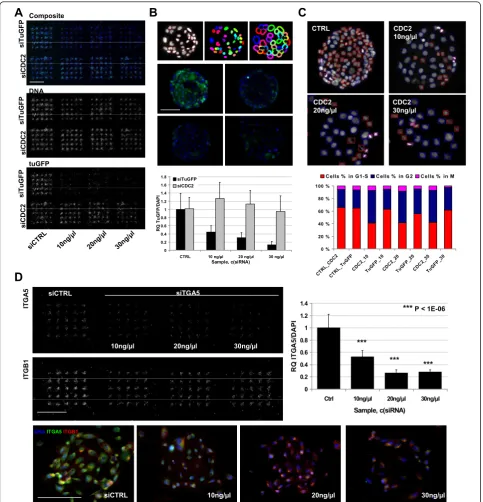
To establish lipid based siRNA reverse transfection on cell spot microarrays, we aimed for low siRNA and lipid concentrations in order to suppress potential lipid toxi-city and off-target effects. Efficacy of siRNA transfection on CSMAs was tested by printing 200 μm array spots
from 10-30 ng/μl siRNA samples [19]. Efficacy of target
silencing was evaluated with U-2OS sarcoma cells expressing a destabilized TurboGFP (TuGFP). Cells were transfected for 72 h on an array with 25 print replicates of a validated TuGFP siRNA in three concen-trations (Figure 3A). TuGFP signal intensity was ana-lyzed using automated microscopic analysis. With normalization of the cytoplasmic TuGFP signal to the nuclear DNA counterstaining (Figure 3B) of the cells, an up to 60% efficacy was measured with the lowest 10 ng/
A
D
1. Libraries of
matrix-siRNA samples
2. Array printing 3. Application of cell
suspension to array
4. Short adhesion to array spots 5. Washing of non-adherent cells
6. Lipid based siRNA reverse transfection
7. Multiparametric assays with high content image analysis
24h
48h 72h
0h
B
C
i
ii
[image:5.595.56.542.88.607.2]iii
Figure 1Principle of the cell spot microarray (CSMA) method. (A) CSMA work flow: siRNA samples in a printing solution containing transfection lipid and extra-cellular matrix proteins are robotically printed on a hydrophobic polystyrene surface. A suspension of adherent cells is allowed to adhere onto the array spots, followed by washing un-adhered cells off, leaving adhered cells only to printed array positions. After reverse transfection for a selected time, the arrays are stained using e.g. traditional multi-label immunostaining protocols for high content image analysis of multiple parameters. (B) CSMA method allows production of high density patterned cell arrays. Left panel displays a microarray
scanned view of 200μm cell spots with 500μm spot spacing. Scale bar 0,5 mm. Right panel: Due to the spatially confined layout of the spots,
automated imaging and segmentation of cells on CSMA spots can be performed using automated image analysis software. Scale bar 200μm.
(C) Microscopic image and microarray scanned view of 200μm CSMA spots (Top left panel;i) and 400μm spots (Top right;ii) of PC-3 cells
stained for DNA (blue) and F-Actin (green) after 48 h culture. Microscopic image and microarray scanned view of 200μm CSMA spots (Bottom;
iii) of primary prostate stromal cells cultured for 48 h and stained for DNA (blue) and F-Actin (green). Scale bar 900μm. (D) Phase contrast
transfections, an over 70% efficiency was achieved with 20 ng/μl siRNA samples (P = 1.7E-08) and an up to
90% silencing efficacy was achieved with the 30 ng/μl
siRNA samples (P = 1.2E-10). To evaluate specificity of the siRNA induced effects, an identical array of a vali-dated siRNA for CDC2 (CDK1, cyclin-dependent kinase
1) was used as a control for the TuGFP analysis (Figure 3A). With comparative image based cytometry analysis of the siCDC2 transfected cells (Figure 3C) and the TuGFP transfected cells, the CDC2 inhibition was found to induce a prominent G2 cell cycle arrest with 51.1% of cells in G2 after 72 h transfection with the 10ng/μl
A
1 4
5 6
10 11
2 3
7 8
12 9
D
N
A
F
-A
c
ti
n
K
i-6
7
c
-P
A
R
P
O
v
e
rl
a
y
[image:6.595.58.540.86.580.2]B
Figure 2Preparation of high density cell microarrays with multiple cell types using CSMA method. (A) Laser microarray scanned
composite image of VCaP prostate cancer cells cultured for 72 h on a four welled CSMA plate with 15,552 siRNAs spots (200μm) printed as
four sub-arrays with 3,888 spots in 18 mm × 54 mm areas. Magnified images of the array displaying the parallel staining of the cells for DNA,
F-Actin, Ki-67 and cleaved PARP. Scale bar 18 mm. (B) Microscope images of 200μm diameter array spots with: (1-12) VCaP, OVCAR-8, Caco-2, 3T3,
PC-3, T-98G, KPL-4, primary prostate stromal cells, HEK-293, HeLa, SAOS-2 and primary osteosarcoma cells cultured on CSMAs for 48 h and
A
B
D
C
0 % 20 % 40 % 60 % 80 % 100 % CTR L_ CD C2 CTR L_ TuG FP CD C2_ 10 Tu GFP_ 10 CD C2_ 20 Tu GFP_ 20 CD C2_ 30 Tu GFP_ 30C ells % in G1-S C ells % in G 2 C ells % in M
CTRL CDC2
10ng/μl
CDC2 20ng/μl
CDC2 30ng/μl
tuGFP DNA Composite s iT u G F P s iC D C 2 10ng
/μl
siC
TRL
20ng
/μl
30ng
/μl
s iT u G F P s iC D C 2 s iT u G F P s iC D C 2 IT G A 5 IT G B 1
10ng/μl siCTRL
20ng/μl 30ng/μl
0 0.2 0.4 0.6 0.8 1 1.2 1.4
Ctrl 10ng/μl 20ng/μl 30ng/μl
Sample, c(siRNA) R Q I T G A 5 /D A P I
***P < 1E-06
***
***
***
DNAITGA5ITGB1
10ng/μl
siCTRL 20ng/μl 30ng/μl
siTGA5 0 0.2 0.4 0.6 0.8 1 1.2 1.4 1.6 1.8
[image:7.595.57.541.88.591.2]CTRL 10 ng/μl 20 ng/μl 30 ng/μl Sample, c(siRNA) R Q T u G F P/ D A P I siTuGFP siCDC2
Figure 3siRNA reverse transfection on CSMAs. (A) siRNA mediated gene silencing on CSMA was tested with U-2OS sarcoma cells expressing a destabilized TurboGFP. Silencing efficacy of different siRNA concentrations was compared with negative control siRNA and a control siRNA for CDC2. Composite (TuGFP = green, DNA = blue) and single channel confocal laser microarray scanned images of a U-2OS array with three 25 replicate spot sub-grids of siTuGFP and siCDC2 and two control siRNA sub-grids. Scale bar 2 mm. (B) Top: Automated image analysis was used to segment nuclei of individual cells and fixed area spanning 15 pixels outside nucleus was used to measure the cytoplasmic signal for TuGFP.
Middle: 20× microscopic images of control siRNA (UL) and TuGFP siRNA spots (UR = 10 ng/μl, LL = 20 ng/μl, LR = 30 ng/μl). Quantification of
cytoplasmic TuGFP against nuclear DAPI intensity indicated an up to 90% transfection efficacy with 30 ng/μl siRNA. Scale bar 100μm. (C) Top:
Image based cytometry analysis of integrated nuclear DAPI intensity (nuclear area/DAPI mean intensity) was used for cell cycle analysis of siCDC2 and siTuGFP transfected cells. Coloured boxes indicate cells classified as G1-S (red), G2 (Blue) and M (purple). Inhibition of CDC2 induced a prominent G2 arrest with all siRNA concentrations in comparison to control or TuGFP. (D) Top: Microarray scanned images of a CSMA with PC-3 cells stained for ITGA5 and ITGB1 following 48 h transfection with control and ITGA5 siRNA. Top right: Based on microscopic image analysis of
ITGA5 signal against DAPI counterstaining of the cells, an up to 75% knockdown was achieved across the 25 replicates with 20 ng/μl ITGA5
siRNA (P = .0003), 49.8% with 20 ng/μl siRNA (P =
3.8E-05) and 50.6% with 30 ng/μl siRNA (P = 0.0006) in
comparison to the 28.2% of cells in G2 in the control transfections (Figure 3C). Transfection with the TuGFP siRNA had an insignificant effect on the cell cycle distri-bution with all the siRNA concentration (Figure 3C).
Silencing of an endogenous target gene was evaluated with antibody based immunofluorescence detection of integrin alpha-5 (ITGA5) in PC-3 prostate cancer cells transfected for 48 h on a CSMA with replicate spots of a validated ITGA5 siRNA. Here, an up to 75% average silencing efficacy was measured from 25 replicate trans-fections with 30 ng/μl siRNA (P = 3.04E-08) (Figure
3D). Endogenous target silencing was further evaluated with antibody based detection of calpain 2 (CAPN2) silencing on VCaP prostate cancer cells transfected for 72 h on a CSMA with 96 technical replicates of four dif-ferent CAPN2 and control siRNAs [Additional file 3:
Supplemental Fig. S1A]. Based on confocal microarray laser scanning analysis of the cumulative spot level CAPN2 staining intensity against DNA counterstaining of the cells [Additional file 3: Supplemental Fig. S1B], a mean transfection efficacy of 31 to 94% silencing per siRNA construct was achieved in comparison to the negative control siRNA transfected cells, using 10 ng/μl
siRNA concentration. For the most efficient CAPN2 siRNA (SI03057306), the inter-spot efficacy CV between all the replicate spots was 6.6%. To evaluate that the detected variation of the siRNA construct efficacy was independent of the transfection method, VCaP cells were transfected in conventional 96-wells for 72 h and analyzed with Western blot. An identical efficacy profile for the CAPN2 siRNA constructs was identified [Addi-tional file 3: Supplemental Fig. S1C] thus highlighting the dependency of siRNA mediated gene silencing on the siRNA construct specificity. To further validate the transfection efficacy with VCaP cells we performed a Western blot analysis of cells transfected for 72 h on an array with 384 (200 μm) replicate spots of the most
effective CAPN2 siRNA and an identical array of nega-tive control siRNA. Here, an up to 85% silencing efficacy was achieved, verifying the immunofluorescence detected high transfection efficacy. In comparison, an identical assay using PC-3 prostate cancer cells and SVpgC2a immortalized primary oral keratinocyte cells (Kindly provided by Prof. Roland Grafström) indicated an up to 90 and 65% transfection efficacy (respectively) [Additional file 3: Supplemental Fig. S1D].
Application of the CSMA method for systematic functional genetics analyses
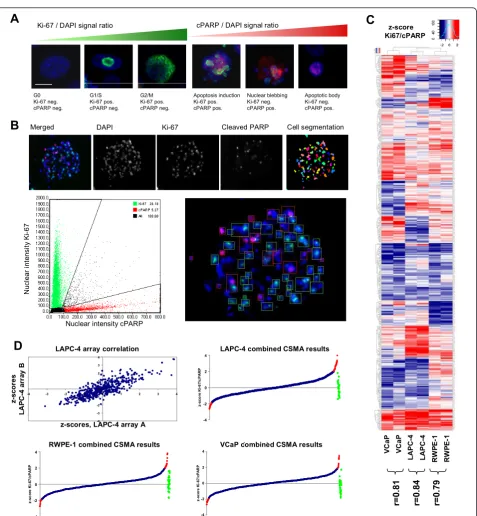
To validate the compatibility of the CSMA method in systematic RNAi screening we established an assay for analysis of G-protein coupled receptor (GPCR) coding
genes impacting on the growth and survival of cultured prostate cells. A siRNA library with two siRNA con-structs against 492 human GPCRs and replicate negative control siRNA samples was used for preparation of arrays used for parallel analysis of GPCRs important for growth of androgen responsive VCaP and LAPC-4 pros-tate cancer cells and RWPE-1 non-malignant prospros-tate epithelial cells. To allow microscopic detection of RNAi effects impacting cell proliferation and survival, we established an antibody based assay for detection of Ki-67 as a proliferation marker and cleaved PARP (poly (ADP-ribose) polymerase) as an apoptosis marker. The markers show a mutually exclusive staining pattern allowing simple phenotypic delineation of proliferating and apoptotic cells on basis of the nuclear staining intensity of the proteins against DNA counterstaining of the cells (Figure 4A &4B). The Ki-67 protein is detected abundantly in the nucleus surrounding the chromatin in all phases of active cell cycle with an increasing intensity from G1 to M, whereas PARP is cleaved in response to induction of apoptosis resulting in increasing cPARP level from the early events of apoptosis induction to for-mation of apoptotic bodies (Figure 4A).
For the screening two identical arrays with random order printed individual siRNA samples were used to transfect each cell type for 48 h followed with immuno-fluorescent staining of the cells for analysis using auto-mated microscopic imaging (Olympus scanR). Each array position was imaged using a long aperture LUCPLFLN x20 objective and automated image analysis software (Olympus scanR) was used to segment the cells and analyze the nuclear staining intensities of the two antibodies (Figure 4B). The spot level ratio of RNAi induced changes in the cumulative nuclear intensities of Ki-67 and cPARP was used to identify target genes caus-ing inhibition of cell proliferation and induction of apoptosis upon silencing. By comparison of the scored results of the two replicate arrays for each cell type, the CSMA experiments displayed a statistically significant concordance with Pearson correlations between r = 0.79 to 0.84 (Figure 4C &4D). For stringent identification of genes having the most consistent impact on growth and survival of the analyzed cell lines, results of the replicate experiments were combined and siRNAs having a z-score greater than ± 2 s.d. for the measured Ki-67/ cPARP signal ratio over both experiments were consid-ered significant (Figure 4D and Additional file 4).
In silicotranscriptomics validation
To address thein vivo significance of the highlighted
G0 Ki-67 neg. cPARP neg. G1/S Ki-67 pos. cPARP neg. G2/M Ki-67 pos. cPARP neg.
Ki-67 / DAPI signal ratio cPARP / DAPI signal ratio
Apoptosis induction Ki-67 pos. cPARP pos. Nuclear blebbing Ki-67 neg. cPARP pos. Apoptotic body Ki-67 neg. cPARP pos.
A
B
C
D
-4 -2 0 2 4 z -s c o re K i-6 7 /c PA R P -4 -2 0 2 4 z -s c o re K i-6 7 /c PA R P p p -4 -2 0 2 4 z -s c o re K i-6 7 /c PA R P -4 -3 -2 -1 0 1 2 3 4-4 -3 -2 -1 0 1 2 3 4
LAPC-4 array correlation
z-score Ki67/cPARP V C a P L A PC -4 R W P E -1 V C a P L A PC -4 R W P E -1 r= 0 .8 1 r= 0 .8 4 r= 0 .7 9
LAPC-4 combined CSMA results
VCaP combined CSMA results RWPE-1 combined CSMA results
Merged DAPI Ki-67 Cleaved PARP Cell segmentation
N u c le a r in te n s it y Ki -6 7
Nuclear intensity cPARP
z -s c o re s L A PC -4 a rr a y B
[image:9.595.61.539.82.599.2]z-scores, LAPC-4 array A
expression database (http://www.genesapiens.org, [23]). To evaluate potential prostate specificity of the analyzed GPCRs, we first compared the median expression levels of the genes in healthy prostate (n = 147) and prostate cancer samples (n = 349) with the normalized expres-sion levels of the genes across over 10,000 clinically annotated tissue samples from other major anatomical tissue types. Here, seven genes; OPRK1, OR51E1,
OR51E2, GPR160, NPY, CHRM1 and EDG7 displayed
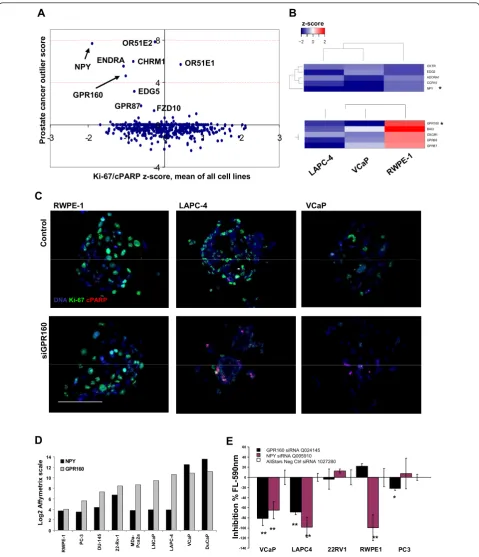
increased expression in prostatic samples in comparison to other tissue types [Additional file 5]. To identify genes displaying outlier expression patterns in clinical prostate cancer samples we calculated an outlier expres-sion score [24] for the genes by comparing the median expression levels of the genes in prostate cancer samples over the healthy prostate control samples [Additional file 6]. Out of the 492 GPCRs analyzed in the CSMA experiment, 9 were identified to display an increased expression pattern in the prostate cancer samples (Fig-ure 5A). To identify correlations between the in vivo
prostate cancer specificity and the loss-of-function impact of the genes on the prostate cell lines, the outlier expression scores were combined with the summarized CSMA results for the corresponding genes.NPY
(neuro-peptide Y) and GPR160 (G protein-coupled receptor
160) [Additional file 7] were among GPCRs with the highest prostatic tissue level and prostate cancer specifi-city index. With analysis of the CSMA results on basis of rank product analysis [25] of all the three cell lines, NPY was identified as the strongest common growth inhibitory siRNA hit in all the three cell lines (Figure 5B), while GPR160 had the strongest growth inhibitory effect on the cancer cell lines VCaP and LAPC-4, and an insignificant effect on the RWPE-1 epithelial cells (Figure 5B-5C), coupling with its overexpression in clini-cal prostate cancer samples in the Genesapiens database analysis (p = 3.10E-05, t-Test -5.749) [Additional file 5]. High levelin vivoexpression of the GPR160 protein was
also identified in clinical prostate cancer specimens in a public tissue protein profiling database (http://www.pro-teinatlas.org, [26]) [Additional file 8: Supplemental Fig. S4A] and a separate previously published transcrip-tomics analysis [27] of 40 human prostate cancer sam-ples (p = 2.22E-04, fold change 3.246).
Validation of the screening results
To validate the growth inhibitory knockdown effect of the two highlighted GPCR coding genes (NPY and GPR160) a series of secondary validation experiments were performed. The efficacy of the GPR160 and NPY siRNAs was validated at the mRNA level in VCaP cells by means of quantitative RT-PCR [Additional file 8: Supplemental Fig. S4B]. By comparison of the mRNA expression level of GPR160 and NPY in the analyzed
cell lines and six additional prostate cancer cell lines http://www.genesapiens.org, VCaP cells were identified with the highest expression of both two genes in com-parison to LAPC-4 and RWPE-1 cells (Figure 5D). To validate the growth inhibitory effect detected in the CSMA analysis, we used an enzyme activity based fluorometric cell viability assay and a panel of prostate cancer cell lines to verify the effect. Five prostate cell lines; VCaP, 22Rv1, LAPC-4, PC-3 and RWPE-1 were transfected in conventional 96-wells for 72 h and assayed with a fluorescence plate reader. A significant reduction of cell viability (p < .01) by inhibition of NPY was measured for all three cell lines included in the CSMA analysis. Silencing of GPR160 was found to decrease viability of VCaP and LAPC-4 (p < .01) cells and moderately the viability of PC-3 prostate cancer cells (p < .05), but not RWPE-1 (Figure 5E), thus vali-dating the rank product analysis based CSMA results. Even though siRNAs for NPY and GPR160 did not exceed the used -2 s.d. threshold in the primary CSMA analysis of LAPC-4 cells, they both scored in the valida-tion assay. A possible reason for the difference in the results is the difference of the two assay readouts. The antibody based readout potentially reflect also the apop-totic mechanism, whereas the fluorometric assay is dependent solely on the number of viable cells indepen-dent of underlying mechanisms resulting in the cell kill-ing. By viewing the resulting phenotype of LAPC-4 cells (Figure 5C) following GPR160 silencing, a residual ing for Ki-67 is detected along with an increased stain-ing for cPARP thus resultstain-ing in a smaller signal ratio than with e.g. the distinct decreased Ki-67 and increased cPARP signal ratio in VCaPs (Figure 5C). It is also pos-sible that in the CSMA format apoptotic cells become detached from the array spots before the staining thus not scoring in this analysis setting.
Discussion
OXTR EDG2 ADORA1 CCR10 NPY -4 0 4 8
-3 -2 -1 0 1 2 3
NPY
GPR160
Ki-67/cPARP z-score, mean of all cell lines
Pr o s ta te c a n c e r o u tl ie r s c o re OR51E2 CHRM1 ENDRA OR51E1 EDG5 GPR87 FZD10
A
B
D
0 2 4 6 8 10 12 14 R W PE -1 PC -3 D U -1 4 5 2 2 -R v -1 MD a -P c a 2 a L N C a P L A P C -4 V C a P D u C a P NPY GPR160 L o g 2 A ff y m e tr ix s c a leE
-140 -120 -100 -80 -60 -40 -20 0 20 40 60 GPR160 NPY ScrambleVCaP LAPC4 22RV1 RWPE1 PC3
**** **
** **
*
GPR160 siRNA Q024145 NPY siRNA Q005910 AllStars Neg Ctrl siRNA 1027280
In h ib it io n % F L -5 9 0 n m C o n tr o l s iG PR 1 6 0 VCaP LAPC-4 RWPE-1
[image:11.595.58.538.87.645.2]DNAKi-67cPARP
C
GPR160 BAI3 OXGR1 GPR68 GPR87 VCaP LAPC -4 RW PE-1 z-score * *Figure 5Validation of CSMA screening results. (A) Comparison of the mean z-score of Ki-67/cPARP index of all analyzed cell lines with clinical gene expression levels of GPCRs in clinical prostate cancer samples (n = 349) vs. healthy prostate samples (n = 147) http://www. genesapiens.org. (B) Unsupervised hierarchical clustering of the averaged siRNA z-scores for the top 5 highest ranking candidate genes identified on basis of rank product analysis of common impact on all the cell types (Top) and on basis of prostate cancer cell line specific growth inhibitory impact (Bottom). (C) Representative x20 microscope images of the GPR160 (siRNA Q024145) CSMA spots for RWPE-1, LAPC-4 and VCaP
cells. Scale bar100μm. (D) Comparison of mRNA transcript levels of GPR160 and NPY in a panel of commonly used prostate model cell lines.
accomplished under a coverslip reducing antibody con-sumption up to 400-fold as compared to 384-well for-mat (10 μl antibody dilution per 384 well vs. 320μl per
array plate with 15,552 siRNA samples). Therefore, it is possible to develop sophisticated HTS assays that would otherwise not be feasible, and easily convert almost any cytochemical staining to a HTS assay.
As compared to most of the cell microarray methods, where a carpet of cells is laid across the whole array [9-12,14-17,19-21], the CSMA method provides a sim-plified protocol for achieving a patterned array layout, where cells only adhere to the sample spots. This con-figuration facilitates the quality control and digital image analysis of the cell arrays as cells included in the analysis can be defined without possibility for sample mixing between array positions. With future develop-ment of higher capacity timelapse microscopic imagers, this platform could also be used for high-throughput timelapse microscopic analyses.
Since in the method cells are seeded over the entire array at a time and the spot diameter is limiting the number of cells adhering to the spots, well-to-well variability inherent in classical HTS systems is reduced in CSMAs, potentially increasing the accuracy of the screens. Furthermore, the arrays are simple to produce and applicable to various commercially available polystyrene cell culture vessel for-mats and moreover scalable, limited only by the microarray printing capacity and throughput of the image analysis sys-tems. The confined cell spot arrays were accomplished by including in the printing mixture matrix proteins, which were deposited on a standard untreated hydrophobic poly-styrene surface. In addition to promoting cell adhesion, the ECM matrix proteins have been shown to enhance lipid based reverse transfection through promotion of cell spreading and activation of endocytotic pathways in adher-ent cells, hence yielding an enhanced transfection efficacy [28-30]. 92 different cell types, including human primary cells, were tested with the approach and an application protocol was optimized for 85 cell lines which could be successfully seeded and cultured on the arrays.
Conclusions
The biological application utilized here to demonstrate the use of CSMAs for systematic RNAi screening, was the functional analysis for GPCR coding genes impact-ing growth and survival of prostate epithelial and pros-tate cancer cells. With the analysis we demonstrated that the CSMAs allow robust functional analysis of large siRNA sets using multiplexed assays, such as the anti-body based assays and different cell types. The targets identified based on the integrated analysis of CSMA data and publicly available transcriptomics data dis-played high context specificity suggesting GPR160 and NPY likely to be the two most important GPCRs
impacting on growth of human prostate and specifically prostate cancer cells. While these genes have been pre-viously associated with prostate cancer [31,32], this is the first comparative functional screening of the GPCR knockdown phenotypes in different cultured prostate cell lines, combined with the bioinformatic analysis of their relative expression levels in prostate tumor sam-ples. Furthermore, several genes including FZD4,
OPRK1andOXTR identified here with a growth
inhibi-tory loss-of-function impact on the prostate cancer cells have been recently associated in independent studies with a role in prostate cancer pathogenesis [33-35]. This illustrates the use of CSMA method in the integrated functional genomics analysis ofin vitro RNAi data and
in vivo clinical gene expression data, to quickly
nomi-nate biologically and clinically relevant candidate genes and potential drug targets for further analysis.
Methods
CSMA printing
The matrix-siRNA samples used for array printing were prepared to U-bottom 384 wells (Ab1055, Abgene) with a Hamilton STAR 96-channel liquid handling robot (Hamilton Robotics) in sterile conditions. For each sam-ple 5μl of 1.67μM (final 10 ng/μl), 3.35μM (20 ng/μl)
or 5 μM (30 ng/μl) siRNA (Qiagen) stock diluted in
OptiMEM-I (Gibco) was mixed with 0.8 μl, 1μl or 1.2 μl (respectively) of siLentFect (Bio-Rad) transfection
agent and 0.2 μl of OptiMEM I. Solutions were
incu-bated for 25 min at RT and mixed with 2 μl of growth
factor reduced Matrigel (BD Biosciences) and 2μl of ice
cold OptiMEM-I supplemented with 65 mM of sucrose, mixed by vortex shaking, centrifuged at 2.000 rpm for 1 min and snap-frozen at -80°C. Source plates were stored at -20°C between uses. Microarray printing was per-formed with a Genetix Qarray2 (Genetix Ltd) microar-ray printer using 16 solid tip pins with 200 μm tip
(PointTechnologies). Arrays were printed onto clear untreated polystyrene microplates with four rectangular wells (Nunc). Printing was done in controlled 55% air humidity and source plates were kept at +15°C during printing. To minimize sample carry-over during the multi-sample print processes a five step distilled water rinsing (3 × 2.5 seconds and 2 × 5 s) of printing pins was used followed with 80% ethanol and air drying. Printed array plates were sealed in airtight bags and stored at room temperature before use.
siRNA libraries and plasmids
used for the experiments had a printed subset of repli-cate negative control siRNA positions equivalent to 5% of all targeting siRNAs on the array (All star negative control, Qiagen 1027280). SiRNA identifiers (Qiagen) for CAPN2, GPR160 and NPY are provided in Figure 3 and 5, TuGFP siRNA (1027020), CDC2 (1027273) and ITGA5 (SI02654841). Plasmid for expression of Tur-boGFP in U-2OS cells was purchased from Evrogen (pTurboGFP-dest1 vector, cat.# FP519).
Cell culture
All cell lines used for the testing of the CSMA method were cultured according to the protocols recommended for the cell line. U-2OS, VCaP, LAPC-4 and 22RV1 cells (ATCC, Manassos, USA) were grown in RPMI-1640 (Gibco) supplemented with 10% FBS, 10 μg/ml
penicillin and streptomycin and 2 mM L-glutamine. RWPE-1 (ATCC, Manassos, USA) cells were grown in Keratinocyte Serum Free Medium (K-SFM, Gibco) sup-plemented with 0.05 mg/ml BPE (bovine pituitary extract) and 5 ng/ml EGF. PC-3 cells (ATCC, Manassos, USA) were grown in F-12K medium (Gibco) supple-mented with 10% FBS, 10 μg/ml penicillin and
strepto-mycin, and 2 mM L-glutamine. Turbo-GFP expressing U-2OS cells were established using Fugene HD (Pro-mega) transfections reagent according to the instruc-tions provided by the manufacturer. Cells were kept under G418 (Sigma-Aldrich) selection for 6 passages prior to assays.
Preparing cells for CSMAs
To allow maximally confined growth of cells on the CSMA spots, specific cell dissociation and array adhe-sion protocols were developed. The protocol for VCaP cells can be used as a guideline for all other tested cell types. For the CSMA experiments, VCaP cells were grown to 80% confluence on 10 cm culture dishes and dissociated with HyQtase (HyClone) treat-ment for 5 minutes. Conditioned culture medium was collected from the dish and after dissociation; cells were re-suspended back to this and pipetted thor-oughly to achieve a uniform single cell suspension. For experiments on the four well array plates, 2.5 × 10^6 cells in 4.5 ml of medium was added carefully to any corner of a single well, while avoiding application of cells directly onto the printed array surface and dis-persed uniformly over the whole array surface. Cells were allowed to adhere to the arrays at +37°C, 5% CO2 for 15 min after which excess un-adhered cells were washed off by gently rinsing the arrays with PBS until all un-adhered cells were removed. For the trans-fection, 4.5 ml of fresh normal culture medium was added to array wells.
Immunofluorescence staining
Immunofluorescence staining of the arrays was per-formed using standard procedures. Cells were fixed with 2% paraformaldehyde solution for 15 min, permeabilized with 0.3% Triton-X100 in PBS and the background was blocked with 2% BSA in PBS before staining with pri-mary and secondary antibodies. Pripri-mary antibodies for ITGA5 (1:200, rabbit anti-ITGA5 clone 1949, Millipore), CAPN2 (1:250, rabbit anti-CAPN2, Abcam), cPARP (1:300, mouse anti-cPARP, Cell Signalling Technologies) and Ki-67 (1:300, rabbit anti-Ki67, Abcam) were diluted in blocking buffer and incubated for 60 min at room temperature, 80 μl per array under a coverslip.
Second-ary labelling antibodies; goat-anti-mouse and donkey-anti-rabbit conjugated with Alexa488 and -647 dyes (1:300, Molecular Probes, Invitrogen) were diluted in blocking buffer and incubated for 60 min at RT. 1 μg/
ml 4’,6-Diamidino-2-phenylindole (DAPI, Invitrogen) was added to secondary antibody solution for DNA staining. After secondary labelling, CSMAs plates were rinsed with distilled H2O, air dried and stored at room temperature protected from light before imaging.
Microscopic imaging and data analysis
Meta-analysis of prostate cancer gene expression datasets
The analysis ofin vivo significance of the identified
siRNA targets was based on analysis of public Affymetrix transcriptome data of prostate samples derived from the GeneSapiens database [23] using the GTI method as pre-viously described [24]. The included data was acquired from multiple public repositories such as 1. The Gene Expression Omnibus (GEO); GSE1133, GSE1431, GSE2109, GSE2361, GSE2443, GSE3325, GSE3526, GSE5258, GSE6606, GSE6608, GSE6919 and GSE96. 2. The Human Genome Expression Index (HuGEIndex); HIE01. 3. The Broad Institute Cancer Program Data Sets; MTE05, MTE10, MTE11 and 4. The NIH-NCI Gene Expression Data Portal (GEDP); NCE279.
Quantitative RT-PCR and Western blot analysis
For quantitative reverse transcription-PCR (qRT-PCR) analysis the total cellular RNA was isolated using Trizol reagent (Invitrogen). For cDNA synthesis, 200 ng of total RNA was reverse transcribed with the High Capa-city cDNA Reverse Transcription kit (Applied Biosys-tems). The cDNA was diluted 1/10 and the Taqman qRT-PCR analysis was performed with an Applied Bio-systems 7900HT instrument, using primers designed by the Universal Probe Library Assay Design Center (Roche) for NPY; forward CGCTGCGACACTACAT-CAAC and reverse CTCTGGGCTGGATCGTTTT, and for GPR160; forward GCATTCAGAGTTACTGG CTGTC and reverse CCCAACAGGTTATGAAAGC-TACA. The fluorescent Taqman probes were obtained from Roche Human Probe Library. Results were ana-lyzed using SDS 2.3 and RQ manager software (Applied Biosystems), and the relative expression of mRNA was determined using beta-actin (forward CCAACCGCGA-GAAGATGA, reverse CCAGAGGCGTACAGGGA-TAG) as an endogenous control. The data from two separate biological experiments, with triplicate samples was combined. For western blot analysis aliquots of total cell lysates were fractionated on SDS-polyacrylamide gels and transferred to nitrocellulose membrane (What-man Inc). The filters were blocked against non-specific binding using 5% skim milk. Membranes were probed with antibodies o/n at +4°C (CAPN2; 1:1000, Abcam). Equal loading was confirmed by probing the same filter with a specific antibody for tubulin (1:5000, Abcam). Signals were revealed by incubating the filters with horseradish peroxidase-coupled goat anti-mouse IgG secondary antibody and goat anti-rabbit (1:1000; Sigma) antibody.
Conventional siRNA transfections and cell viability assay
Validation of target silencing and assaying the effect of NPY and GPR160 siRNAs on the growth of prostate
cancer cells was performed in clear-bottom 96-well (2000 cell per well) and 24-well (5 × 10^4 cells per well) plates. The transfections were made with 10 nM siRNA constructs (Qiagen) using siLentFect transfec-tion agent (Bio-Rad). Cell viability was assayed with CellTiter-Blue (CTB) fluorometric cell viability assay (Promega). 10 μl of CTB diluted with 10 μl of
Opti-MEM 1 (Gibco) medium without supplements was added to each 96-well containing 100 μl of medium
and cells. Reagent was incubated at +37°C for 4 h fol-lowed with 2 h stabilization at RT before analysis. Fluorescence signal (Exitation 560 nm, Emission 590 nm) reflecting the relative number of viable cells per well was measured with EnVision fluorescence plate reader (PerkinElmer). Data of four replicate wells was combined for analysis.
Additional material
Additional file 1: Supplemental video 1. Timelapse microscopic
imaging of PC3 prostate cancer cells seeded on array with 200μm spots
and imaged for 72 h. Images were collected using a x20 objective with 30 minute intervals.
Additional file 2: Supplemental Table 1. List of cell lines tested with the CSMA method. 92 adherent cell types were tested for compatibility with the CSMA cell patterning method. Four different cell dissociation methods were tested in parallel and protocol allowing maximally efficient cell patterning was optimized for all tested cell types. Additional file 3: Supplemental figure S1. (A) Validation of CSMA transfection efficacy in VCaP cells was performed using four different siRNA
constructs forCAPN2and a control siRNA. Composite (CAPN2 = red, DNA =
blue) and single channel confocal laser microarray scanned images of a VCaP array with four 24 replicate spot sub-grids of three CAPN2 and control
siRNA constructs. Scale bar 900μm. (B) 20× microscopic images of control
siRNA and CAPN2 siRNA spots with an intensity surface plot visualization of the intra-spot signal distribution of anti-CAPN2 staining (lower panels). (C) Upper panel: On basis of the immunofluorescent detection of CAPN2 an up to 94% spot level efficacy was measured with spot level normalization against DNA counterstaining of the cells. The mean efficacy of CAPN2 siRNAs varied from 31% to 94% silencing. Lower panel: Comparative Western blot analysis of cells transfected using conventional methods provided identical efficacy profiles for the siRNA constructs. (D) Western blot of analysis of cells recovered from a CSMA array of 384 replicate CAPN2 and control siRNA spots after 72 h transfection was used to validate the transfection efficacy in VCaP and PC-3 prostate cancer cells and SVpgC2a oral keratinocytes.
Additional file 4: Supplemental data 1. Results summary table listing the CSMA results of the functional analysis of the GPCR targeting siRNAs. Additional file 5: Supplemental figure S2. Tissue level unsupervised hierarchical clustering of the 7 candidate primary RNAi hit genes identified with an increased expression pattern in clinical prostate samples. Each cell in the cluster shows the log2 expression ratio for the particular gene in separate tissue samples divided by the median expression of that gene in all the samples. Red; expression above the median, blue; below the median.
Additional file 6: Supplemental data 2. Table listing the
transcriptomics analysis results of the analysed genes in the Genesapiens transcriptomics database. Genes represented with a minimum of 10 analyzed healthy and cancer tissue samples were included.
Additional file 8: Supplemental figure S4. (A) Representative immunohistochemistry staining of tissue microarray cores of healthy and prostate cancer samples for GPR160 http://www.proteinatlas.org. (B) Knockdown performance of siRNAs targeting GPR160 and NPY. Transcript levels for duplicate experiments with triplicate samples were measured by quantitative RT-PCR and are reported for each siRNA in the increasing efficacy order relative to average transcript levels for negative control siRNA transfections.
Acknowledgements
The authors thank Drs. J. Ivaska and M. Perälä for useful discussion, comments and suggestions. Dr Pekka Kohonen is acknowledged for help in the rank product analysis. This work was funded by EU-FP6 project MolTools, EU-FP7 projects ENLIGHT, EPITRON and GENICA, the Finnish Academy Translational Genome-Scale Biology Center of Excellence, Sigrid Juselius Foundation and Finnish Cancer Organizations.
Author details
1Medical Biotechnology, VTT Technical Research Centre of Finland, 20521
Turku, Finland.2Institute for Molecular Medicine Finland (FIMM), University of
Helsinki, 00014 Helsinki, Finland.
Authors’contributions
JR developed the CSMA method and performed the experiments. JR, OK and MN designed the experiments. JR, RM and PS performed the array printing and siRNA library formatting. ARA and PL performed the validation experiments. JPM performed the GTI transcriptomics analysis. JR and OK wrote the paper. The manuscript has been reviewed by the authors who all agree to its publication in BMC Genomics.
Competing interests
The authors declare that they have no competing interests.
Received: 16 August 2010 Accepted: 28 March 2011 Published: 28 March 2011
References
1. Kittler R, Pelletier L, Heninger AK, Slabicki M, Theis M, Miroslaw L, Poser I,
Lawo S, Grabner H, Kozak K, Wagner J, Surendranath V, Richter C, Bowen W,
Jackson AL, Habermann B, Hyman AA, Buchholz F:Genome-scale RNAi
profiling of cell division in human tissue culture cells.Nat Cell Biol2007, 9(12):1401-12.
2. Martin SE, Jones TL, Thomas CL, Lorenzi PL, Nguyen DA, Runfola T,
Gunsior M, Weinstein JN, Goldsmith PK, Lader E, Huppi K, Caplen NJ: Multiplexing siRNAs to compress RNAi-based screen size in human cells.
Nucleic Acids Res2007,35(8):e57.
3. Kimura J, Nguyen ST, Liu H, Taira N, Miki Y, Yoshida K:A functional
genome-wide RNAi screen identifies TAF1 as a regulator for apoptosis in response to genotoxic stress.Nucleic Acids Res2008,36(16):5250-5259.
4. Loh SH, Francescut L, Lingor P, Bähr M, Nicotera P:Identification of new
kinase clusters required for neurite outgrowth and retraction by a loss-of-function RNA interference screen.Cell Death Differ2008,15(2):283-298.
5. Sepp KJ, Hong P, Lizarraga SB, Liu JS, Mejia LA, Walsh CA, Perrimon N:
Identification of neural outgrowth genes using genome-wide RNAi.PLoS Genet2008,4(7):e1000111.
6. Lin X, David CA, Donnelly JB, Michaelides M, Chandel NS, Huang X,
Warrior U, Weinberg F, Tormos KV, Fesik SW, Shen Y:A chemical genomics
screen highlights the essential role of mitochondria in HIF-1 regulation.
Proc Natl Acad Sci USA2008,105(1):174-179.
7. Tang W, Dodge M, Gundapaneni D, Michnoff C, Roth M, Lum L:A
genome-wide RNAi screen for Wnt/beta-catenin pathway components identifies unexpected roles for TCF transcription factors in cancer.Proc Natl Acad Sci USA2008,105(28):9697-9702.
8. Fotheringham S, Epping MT, Stimson L, Khan O, Wood V, Pezzella F,
Bernards R, La Thangue NB:Genome-wide loss-of-function screen reveals
an important role for the proteasome in HDAC inhibitor-induced apoptosis.Cancer Cell2009,15(1):57-66.
9. Ziauddin J, Sabatini DM:Microarrays of cells expressing defined cDNAs.
Nature2001,411(6833):107-110.
10. Mousses S, Caplen NJ, Cornelison R, Weaver D, Basik M, Hautaniemi S, Elkahloun AG, Lotufo RA, Choudary A, Dougherty ER, Suh E, Kallioniemi O: RNAi microarray analysis in cultured mammalian cells.Genome Res2003, 13(10):2341-2347.
11. Kumar R, Conklin DS, Mittal V:High-Throughput Selection of Effective
RNAi Probes for Gene Silencing.Genome Res2003,13:2333-2340.
12. Silva JM, Mizuno H, Brady A, Lucito R, Hannon GJ:RNA interference
microarrays: high-throughput loss-of-function genetics in mammalian cells.Proc Natl Acad Sci USA2004,101(17):6548-52.
13. Kato K, Umezawa K, Funeriu DP, Miyake M, Miyake J, Nagamune T: Immobilized culture of nonadherent cells on an oleyl poly(ethylene glycol) ether-modified surface.BioTechniques2003,35:1014-1021. 14. Conrad C, Erfle H, Warnat P, Daigle N, Lörch T, Ellenberg J, Pepperkok R,
Eils R:Automatic identification of subcellular phenotypes on human cell
arrays.Genome Res2004,14(6):1130-6.
15. Mannherz O, Mertens D, Hahn M, Lichter P:Functional screening for
proapoptotic genes by reverse transfection cell array technology.
Genomics2006,87(5):665-72.
16. Erfle H, Neumann B, Liebel U, Rogers P, Held M, Walter T, Ellenberg J,
Pepperkok R:Reverse transfection on cell arrays for high content
screening microscopy.Nat Protoc2007,2(2):392-9.
17. Fiebitz A, Nyarsik L, Haendler B, Hu YH, Wagner F, Thamm S, Lehrach H,
Janitz M, Vanhecke D:High-throughput mammalian two-hybrid screening
for protein-protein interactions using transfected cell arrays.BMC Genomics2008,6:68.
18. Fujimoto H, Yoshizako S, Kato K, Iwata H:Fabrication of Cell-Based Arrays
Using Micropatterned Alkanethiol Monolayers for the Parallel Silencing of Specific Genes by Small Interfering RNA.Bioconjugate Chem2008, 17:1404-1410.
19. Fjeldbo CS, Misund K, Günther CC, Langaas M, Steigedal TS, Thommesen L,
Laegreid A, Bruland T:Functional studies on transfected cell microarray
analysed by linear regression modelling.Nucleic Acids Res2008,36(15): e97.
20. Doil C, Mailand N, Bekker-Jensen S, Menard P, Larsen DH, Pepperkok R,
Ellenberg J, Panier S, Durocher D, Bartek J, Lukas J, Lukas C:RNF168 binds
and amplifies ubiquitin conjugates on damaged chromosomes to allow accumulation of repair proteins.Cell2009,136(3):435-446.
21. Neumann B, Walter T, Hériché JK, Bulkescher J, Erfle H, Conrad C, Rogers P, Poser I, Held M, Liebel U, Cetin C, Sieckmann F, Pau G, Kabbe R,
Wünsche A, Satagopam V, Schmitz MH, Chapuis C, Gerlich DW, Schneider R, Eils R, Huber W, Peters JM, Hyman AA, Durbin R, Pepperkok R, Ellenberg J: Phenotypic profiling of the human genome by time-lapse microscopy reveals cell division genes.Nature2010,464(7289):721-727.
22. Rantala JK, Edgren H, Lehtinen L, Wolf M, Kleivi K, Moen Vollan HK, Aaltola AR, Laasola P, Kilpinen S, Saviranta P, Iljin K, Kallioniemi O: Integrative functional genomics analysis of sustained polyploidy phenotypes in breast cancer cells identifies an oncogenic profile for GINS2.Neoplasia2010,12(11):877-88.
23. Kilpinen S, Autio R, Ojala K, Iljin K, Bucher E, Sara H, Pisto T, Saarela M, Skotheim RI, Björkman M, Mpindi JP, Haapa-Paananen S, Vainio P, Edgren H,
Wolf M, Astola J, Nees M, Hautaniemi S, Kallioniemi O:Systematic
bioinformatic analysis of expression levels of 17,330 human genes across 9,783 samples from 175 types of healthy and pathological tissues.Genome Biol2008,9(9):R139.
24. Mpindi JP, Sara H, Haapa-Paananen S, Kilpinen S, Pisto T, Bucher E, Ojala K, Iljin K, Vainio P, Björkman M, Gupta S, Kohonen P, Nees M, Kallioniemi O: GTI: A Novel Algorithm for Identifying Outlier Gene Expression Profiles from Integrated Microarray Datasets.PLoS One2011,6(2):e17259. 25. Hong F, Breitling R, McEntee CW, Wittner BS, Nemhauser JL, Chory J:
RankProd: a bioconductor package for detecting differentially expressed genes in meta-analysis.Bioinformatics2006,22(22):2825-2827.
26. Uhlén M, Björling E, Agaton C, Szigyarto CA, Amini B, Andersen E, Andersson AC, Angelidou P, Asplund A, Asplund C, Berglund L, Bergström K, Brumer H, Cerjan D, Ekström M, Elobeid A, Eriksson C, Fagerberg L, Falk R, Fall J, Forsberg M, Björklund MG, Gumbel K, Halimi A, Hallin I, Hamsten C, Hansson M, Hedhammar M, Hercules G, Kampf C,
Larsson K,et al:A human protein atlas for normal and cancer tissues
27. Vanaja DK, Cheville JC, Iturria SJ, Young CY:Transcriptional silencing of zinc finger protein 185 identified by expression profiling is associated with prostate cancer progression.Cancer Res2003,63(14):3877-3882.
28. Kopatz I, Remy JS, Behr JP:A model for non-viral gene delivery: through
syndecan adhesion molecules and powered by actin.J Gene Med2004, 6:769-776.
29. Yoshikawa T, Uchimura E, Kishi M, Funeriu DP, Miyake M, Miyake J: Transfection microarray of human mesenchymal stem cells and on-chip siRNA gene knockdown.J Control Release2004,96:227-232.
30. Uchimura E, Yamada S, Uebersax L, Yoshikawa T, Matsumoto K, Kishi M,
Funeriu DP, Miyake M, Miyake J:On-chip transfection of PC12 cells based
on the rational understanding of the role of ECM molecules: efficient, non-viral transfection of PC12 cells using collagen IV.Neurosci Lett2005, 378:40-43.
31. Ruscica M, Dozio E, Boghossian S, Bovo G, Martos Riaño V, Motta M,
Magni P:Activation of the Y1 Receptor by Neuropeptide Y Regulates the
Growth of Prostate Cancer Cells.Endocrinology2006,147:1466-1473. 32. Schlomm T, Luebke AM, Sültmann H, Hellwinkel OJ, Sauer U, Poustka A,
David KA, Chun FK, Haese A, Graefen M, Erbersdobler A, Huland H: Extraction and processing of high quality RNA from impalpable and macroscopically invisible prostate cancer for microarray gene expression analysis.Int J Oncol2005,27(3):713-20.
33. Gupta S, Iljin K, Sara H, Mpindi JP, Mirtti T, Vainio P, Rantala J, Alanen K,
Nees M, Kallioniemi O:FZD4 as a mediator of ERG oncogene-induced
WNT signaling and epithelial-to-mesenchymal transition in human prostate cancer cells.Cancer Res2010,70(17):6735-6745.
34. Romanuik TL, Wang G, Morozova O, Delaney A, Marra MA, Sadar MD: LNCaP Atlas: gene expression associated with in vivo progression to castration-recurrent prostate cancer.BMC Med Genomics2010,3:43.
35. Zhong M, Boseman ML, Millena AC, Khan SA:Oxytocin induces the
migration of prostate cancer cells: involvement of the Gi-coupled signaling pathway.Mol Cancer Res2010,8(8):1164-1172.
doi:10.1186/1471-2164-12-162
Cite this article as:Rantalaet al.:A cell spot microarray method for production of high density siRNA transfection microarrays.BMC Genomics201112:162.
Submit your next manuscript to BioMed Central and take full advantage of:
• Convenient online submission
• Thorough peer review
• No space constraints or color figure charges
• Immediate publication on acceptance
• Inclusion in PubMed, CAS, Scopus and Google Scholar
• Research which is freely available for redistribution