This is a repository copy of
Using Mutation Analysis to Evolve Subdomains for Random
Testing
.
White Rose Research Online URL for this paper:
http://eprints.whiterose.ac.uk/81416/
Version: Accepted Version
Conference or Workshop Item:
Patrick, Matthew Timothy, Alexander, Rob orcid.org/0000-0003-3818-0310, Oriol, Manuel
Yves Antoine et al. (1 more author) (2013) Using Mutation Analysis to Evolve Subdomains
for Random Testing. In: Mutation 2013: 8th International Workshop on Mutation Analysis,
18 Mar 2013.
https://doi.org/10.1109/ICSTW.2013.14
[email protected] https://eprints.whiterose.ac.uk/
Reuse
Items deposited in White Rose Research Online are protected by copyright, with all rights reserved unless indicated otherwise. They may be downloaded and/or printed for private study, or other acts as permitted by national copyright laws. The publisher or other rights holders may allow further reproduction and re-use of the full text version. This is indicated by the licence information on the White Rose Research Online record for the item.
Takedown
If you consider content in White Rose Research Online to be in breach of UK law, please notify us by
Using Mutation Analysis to Evolve Subdomains for Random Testing
Matthew Patrick∗, Rob Alexander∗, Manuel Oriol∗† and John A. Clark∗
∗University of York
Heslington, York United Kingdom
{mtp, rda, manuel, jac}@cs.york.ac.uk
†Industrial Software Systems
ABB Corporate Research Baden-D¨attwil, Switzerland
Abstract—Random testing is inexpensive, but it can also be inefficient. We apply mutation analysis to evolve efficient subdomains for the input parameters of eight benchmark pro-grams that are frequently used in testing research. The evolved subdomains can be used for program analysis and regression testing. Test suites generated from the optimised subdomains outperform those generated from random subdomains with 10, 100 and 1000 test cases for uniform, Gaussian and exponential sampling. Our subdomains kill a large proportion of mutants for most of the programs we tested with just 10 test cases.
Keywords-mutation testing; input distribution; test case gen-eration; search based; evolution strategy;
I. INTRODUCTION
Random testing is a simple and inexpensive way to generate test data. It is often seen as ineffective compared to other testing techniques because it does not analyse the program under test [1]. Input values are selected from a uniform distribution or by some other straightforward means. The range from which scalar values are chosen has a profound effect on the effectiveness of a test suite [2]. Andrews et al. [2] report that the subdomain [0..31] gave the best results in testing a dictionary, but it is not clear how to discover this ‘magic number’. Similarly it is difficult to determine in advance whether sampling from uniform, Gaussian or exponential distributions will be more efficient. One way to assess the fault-finding capability of a test suite is to use mutation analysis. Experimental research has shown mutation analysis to be more stringent than other testing criteria and a good predictor of the real fault finding capability of a test suite [3] [4]. A test suite that can detect (kill) most of the artificial faults (mutants) can therefore be expected to perform well against real faults.
We have developed a technique to discover efficient input subdomains for random testing using mutation analysis. An evolution strategy (ES) is employed to evolve minimum and maximum values for each input parameter. The process of evolving subdomains is computationally expensive, but once this is achieved, it is inexpensive to generate further highly efficient test suites. Our technique can be applied in program analysis and regression testing. Compared to unoptimised random testing, our subdomains require fewer test cases and minimise the use of extreme values. This should reduce the human oracle cost of checking the output values [5].
The rest of this paper is organised as follows. Section II explores our background motivation, Section III explains the general principles, Section IV describes our experiments and Section V presents their results. Section VI discusses the related work, Section VII summarises our conclusions and Section VII introduces suggestions for future work.
II. BACKGROUND A. Metaheuristic Optimisation
Optimisation techniques use fitness functions to guide their search [6]. If the fitness landscape is smooth, deter-ministic algorithms (e.g. the simplex method [7]) can find exact solutions. Heuristics (e.g. greedy approximation [8]) may be used to find approximate solutions. Metaheuristic optimisation is used when deterministic algorithms cannot be applied and there is no known heuristic. Candidates are selected probabilistically using the relative fitness of existing solutions until a termination condition is reached [6].
Efficient fitness functions provide an accurate evaluation of each candidate solution and have modest computation requirements [6]. Fitness landscapes often contain locally optimal regions, inferior to the global optimum but superior to the surrounding values. Metaheuristic techniques must select new solutions far enough away from the existing candidates to avoid being stuck in a local optimum, but close enough to take advantage of the previous evaluations.
One way to improve the performance of a metaheuristic search is to tune the distance between existing and new candidate solutions, so as to balance the development of strong candidates with the exploration of new regions. Other techniques include maintaining a diverse population of can-didates, restarting the search in a new region and favouring certain lower performing values [6]. The challenge is to take advantage of the underlying patterns in the problem without necessarily knowing what they are.
B. Evolution Strategies
Evolution strategies are metaheuristic techniques inspired by the process of adaptation in nature [9]. They maintain a set of numerical parameter values (x1. . . xn) together with an update function (F). At each generation, new candidate solutions are produced by applying the update function to existing sets of values,x′
strategies differ from some genetic algorithms in that they optimise numerical values rather than bit strings and focus on mutation over recombination [13].
Evolution strategies were first developed in the 1960s by Bienert, Rechenberg and Schwefel to optimise aerodynamics [9]. They are ideal for the fine tuning of numerical proper-ties, as any disruption from recombination is largely avoided. Amongst many other applications, evolution strategies have been used to optimise image compression [10], network design [11] and web crawling [12].
For many problems, evolution strategies have been shown to be more effective than other evolutionary algorithms in terms of the number of function evaluations evaluated before the optimum value is reached. One evolution strategy tri-umphed in a research challenge for black box optimisation, by outperforming eleven other algorithms on a diverse set of 25 benchmark functions [14].
III. SUBDOMAINOPTIMISATION
We aim to find highly efficient subdomains of input values to the program under test. If the subdomains are too small it may not be possible to kill all the mutants, but if they are too large, the inefficiency of the resulting test suite may mean that more test cases are required to kill the same number of mutants. We evaluate the efficiency of subdomains by repeatedly sampling from them and calculating the mutation score of the generated test suites.
Take for example a hypothetical program, with three integer inputs (a, b and c). This program has somewhere within its internal branch structure the conditiona=b=c. Our task is to find a subdomain for each input parameter such that test case i consists of ai ∈ [Alower..Aupper], bi ∈ [Blower..Bupper] and ci ∈ [Clower..Cupper]. If the subdomains are too small or have poorly chosen ranges, it might not be possible to meet this branch condition along with the conditions of other branches in the program. If the subdomains are larger, the probability of selecting a value for a, b and c such that this condition holds may be reduced. In our work, a candidate solution consists of a series of subdomains with intervals in the following three forms:
Numerical subdomains
are represented with a lower and upper value. Test input values are selected only between these two values (inclusive).
Boolean subdomains
are described with an integer value between 0 and 100. This value represents the percentage proba-bility that a generated parameter value is ‘true’.
Character arrays
are fixed in length (by default to five characters). Each character is treated as a numerical subdomain and the selected values are then mapped to letters in the latin alphabet.
To search the solution space, we have chosen to use an evolution strategy. We take the traditional approach, whereby one new candidate is perturbed from the current solution at a time. The new candidate replaces the current solution if it evaluates as being superior, otherwise it is discarded. We use a Mersenne Twister [15] to generate pseudorandom numbers, mapped to a Gaussian distribution for perturbing each parameter. The Mersenne Twister is a fast algorithm with a long period that passes all the Diehard tests for randomness. Gaussian distributions favour new values close to the old ones, but still allow some exploration further away. If the variance of the Gaussian distribution is too small, the evolution strategy may never reach a global optimum, but if it is too large, an optimum could be passed over without it being detected. We follow Rechenberg’s one-fifth rule to adapt the variance for optimal effectiveness [16]. The ideal convergence rate is presumed to be achieved when one out of five new values perform better than their parents. This is achieved by applying Equation 1) every ten generations. Algorithm 1 applies the process we use to find new subdomains with our evolution strategy to the hypothetical program.
σ′=
σ∗0.85, if n <2
σ/0.85, if n >2
σ, if n= 2
(1)
IV. EXPERIMENTS
We set up experiments to answer two research questions in regard to optimising subdomains for mutation testing: A. Is it possible to kill mutants more efficiently than
a random approach by optimising the subdomains from which test inputs are generated?
B. Are some shapes of input distribution (within the evolved subdomains) more efficient at killing mutants than others?
For every experiment, we record the average result of 100 repeated trials. Each trial begins with subdomains assigned uniform random values between 0 and 100. The evolution strategy has an initial variance of 50 and optimises the subdomains through 300 generations (except for Replace, which requires 600 generations for convergence). Mutants are considered to be killed if they output a different result or error code to the original program, or they appear to be caught in an infinite loop (and the original program executes successfully for the same parameter values).
A. Is it possible to kill mutants more efficiently by optimising the subdomains from which test inputs are generated?
The first research question is addressed by optimising sets of subdomains to produce test suites of 10, 100 and 1000 test cases. Subdomains are optimised for each size of test suite in a separate experiment so that the optimisation process and resulting subdomains can be investigated for different numbers of test cases. If 10 test cases can be sampled such that they kill as many mutants as 100 or 1000 test cases, we say that this is more efficient. We aim to determine whether test input subdomains can be optimised such that they perform more efficiently than random testing.
At each generation, test cases are generated using input values sampled from within the range of the current subdo-mains. The mutation scores of these test suites are averaged over 100 trials and compared to the expected mutation score for a random test suite of the same size. If, at the end of the optimisation process, there is no discernible difference in mutation score between test suites generated by our technique and random testing, our technique has failed to optimise the subdomains for this program.
We calculated the number of mutants for each program expected to be killed by random test suites of 10, 100 and 1000 test cases (see Table II) using a combination of experimentation and probability theory. In Equation 2,e(s)
is the expected number of mutants killed for a random test suite sampled with stest cases, where for each mutant m, K is the number of test cases that killed the mutant and N is the total number of test cases from a large test suite. We chose to use a test suite of 100,000 random test cases
(values between 0 and 100) because it is important that N is much larger than sfor accurate results.
e(s) = X m∈mutants
1−(1−K/N)s
(2)
Table II
EXPECTED MUTATION SCORE FOR RANDOM TEST SUITES WITH10, 100 AND1000TEST CASES
Program s=10 s=100 s=1000
Power 0.963 0.994 1.00 TrashAndTakeOut 0.787 0.958 0.988 FourBalls 0.356 0.756 1.00 Tcas 0.0499 0.0569 0.0599 Cal 0.766 0.948 0.957 TriTyp 0.394 0.779 0.924 Schedule 0.236 0.840 0.853 Replace 0.209 0.321 0.329
B. Are some shapes of input distribution (within the evolved subdomains) more efficient at killing mutants than others?
So far in this paper, test suites have been generated by sampling uniformly across the range of each subdomain. It may be possible to generate more efficient test suites by sampling using different shapes of input distribution. We ad-dressed the second research question by evolving optimised subdomains for Uniform, Gaussian and Exponential samples then comparing the mutation scores achieved.
As random numbers are primitively generated from a uniform distribution between zero and one, they must be stretched to fit a particular distribution. To sample from a Uniform distribution, this is a straightforward process of multiplication and addition (see Algorithm 2). We used the polar form of the Box-Muller transformation for Gaus-sian sampling (see Algorithm 3) and the inverse transform method for Exponential sampling (see Algorithm 4). As Ex-ponential and Gaussian distributions are infinite, we needed to discard any values produced beyond the desired range. We therefore set the mean, variance and/or lambda to ensure 95% of the distribution probability area is inside the range. The remaining 5% are discarded and sampling is repeated until values are found within the desired range.
Algorithm 1 Optimisation for subdomains[Al..Au],[Bl..Bu] and[Cl..Cu] 1: Select initial random values for Al,Au,Bl,Bu,Cl andCu.
2: Evaluate mutation score ofs test cases, using values generated from[Al..Au],[Bl..Bu] and[Cl..Cu].
3: Sample new values from a Gaussian distribution with corresponding mean Alower...Cupper and variance σ2:
(Al, Au, Bl, Bu, Cl, Cu, σ2)→(Al′, A′u, Bl′, B′u, Cl′, Cu′, σ2).
4: Evaluate mutation score ofn test cases, using values generated from[A′
l..A′u],[Bl′..Bu′]and[Cl′..Cu′] 5: If the new subdomains kill more mutants, replace the old subdomains, otherwise discard them. 6: Repeat steps 2-5 ten times. Count the number of times the new subdomains kill more mutants (n) 7: If n <2:σ2=σ2∗0.85, else ifn >2:σ2=σ2/0.85, else:σ2=σ2.
Table I
TEST PROGRAMS USED IN THE EXPERIMENTS
Program Mutants LOC Function Reference
Power 58 35 Calculates the value ofxy [17]
TrashAndTakeOut 111 60 Performs different calculations for each input condition [17] FourBalls 189 40 Calculates the ratio of one input parameter to three others [18] Tcas 267 120 Evaluates factors for air traffic control [19] Cal 280 134 Counts the number of days between two dates [17] TriTyp 310 61 Classifies triangles as scalene, isoceles, equilateral and invalid [18] Schedule 373 200 Determines prioritised execution order [19]
Replace 1632 500 Performs substring replacement [19]
Our experiments use subject programs with a variety of forms of computation, from control programs to programs that perform string processing or numerical calculations. Distribution shapes emphasise different parts of the sub-domain. The impact of these changes will depend on the internal control and data flow of the program under test. We therefore expect each shape of input distribution to be better suited to some programs than others.
Algorithm 2 Restricted Uniform Random Sampling 1: iflef t > rightthen
2: swap(lef t, right) 3: end if
4: range=right−lef t 5: return rand()∗range+lef t
Algorithm 3 Restricted Gaussian Random Sampling [20] 1: iflef t > rightthen
2: swap(lef t, right) 3: end if
4: range=right−lef t 5: mean=range/2 +lef t
6: variance= (range/4)∗(range/4) 7: repeat
8: repeat
9: x= 2∗rand()−1 10: y= 2∗rand()−1 11: w=x∗x+y∗y 12: untilw <1
13: w=x∗sqrt((−2.0∗ln(w))/w) 14: untilabs(w)≤range/(2∗variance) 15: return mean+variance∗w
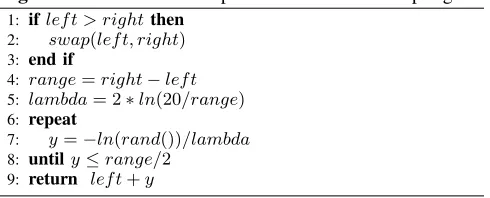
Algorithm 4 Restricted Exponential Random Sampling 1: iflef t > rightthen
2: swap(lef t, right) 3: end if
4: range=right−lef t 5: lambda= 2∗ln(20/range) 6: repeat
7: y=−ln(rand())/lambda 8: untily≤range/2
9: return lef t+y
V. RESULTS
Below we present the results of our experiments, address-ing each research question in turn.
A. Is it possible to kill mutants more efficiently than a random approach by optimising the subdomains from which test inputs are generated?
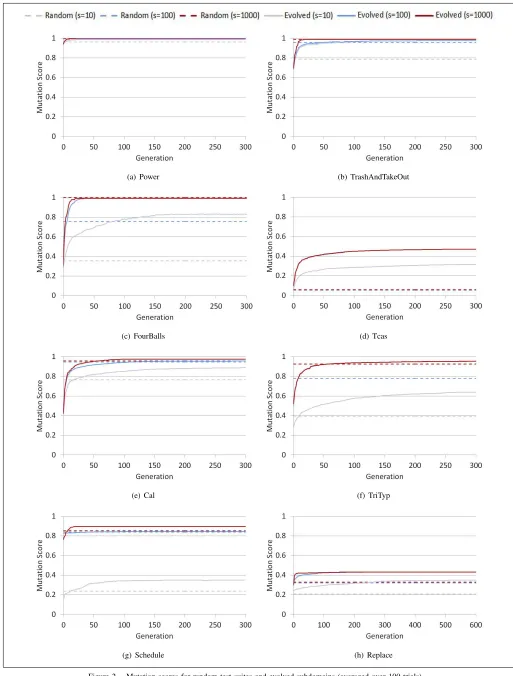
Our approach seeks highly efficient subdomains for each program under test. At the start of a run, the minimum and maximum value of each subdomain is generated uniformly at random from [0..100]. In our experiments, we optimised subdomains using three different sizes of test suite (s=10, s=100 and s=1000). The average mutation scores achieved at each generation are shown in Figure 2 along with the expected mutation scores for random test suites (generated uniformly from [0..100], without optimisation over time).
Optimised subdomains achieve a higher mutation score than the initial random subdomains for every program with all sizes of test suite. The average optimised mutation scores also exceed the expected mutation scores (with range [0..100]) on every program under test, with just three excep-tions (see Table III). In these three cases, all the mutants are expected to be killed by random testing, while the evolution strategy occasionally becomes stuck in a local optimum. In all other cases where random testing is not expected to kill all the mutants, our optimisation technique finds subdomains that kill more mutants.
We can compare the effectiveness of our approach against two experiments using dynamic symbolic execution (see Table IV). With 100 test cases, the average mutation score of our subdomains for TriTyp and Schedule outperformed that of dynamic symbolic execution by a considerable margin. Yet with Tcas and Replace, even the highest mutation score achieved by our subdomains fell short of that achieved by dynamic symbolic execution.
subdomains is correlated to the number of mutants and lines of code with -0.690 and -0.667 Spearman’s rank coefficients. There are some exceptions to this rule. Cal has almost twice the number of mutants as Fourballs, but 89% were killed by 10 test cases, compared to 83% with FourBalls (see Figures 2e and 2c). TriTyp has one more line of code than TrashAndTakeOut, but only 64% of its mutants are killed by 10 test cases (see Figures 2f and 2b). For the size of the program, the mutants of Tcas were the hardest to kill. The mutation score achieved with Tcas was only slightly higher than that achieved with Replace, but it has one sixth the number of mutants and one quarter the lines of code.
None of our original trials with Tcas were able to produce a mutation score above 0.05, the score predicted for random testing (see Figure 2d). Inspection of the program code reveals Tcas uses large constants in equality conditions. For example, unless the value of Cur V ertical Sep is greater than 600, most of the code will not execute. We improved the mutation score slightly by widening the initial subdomains, but it was more productive to scale the program constants. We transformed the program by dividing eight of its constants by 10, thus bringing them within the 0-100 range that we use for our initial subdomain limits. With the transformed program, the optimised programs achieved an average mutation score of 0.316 with 10 test cases. With 100 and 1000 test cases, the mutation score is even higher (see Figure 2d, NB: the s=100 line is covered by s=1000).
Subdomains discovered on the transformed program can be scaled up for use on the original program by multiplying the relevant values by 10. The subdomains identified by our technique were scaled to achieve an average mutation score of 0.401 for 1000 test cases, with one of the trials achieving 0.625. This is comparable to the 0.643 mutation score achieved by Papadakis et al. [19] with dynamic symbolic execution. The approach could easily be applied to other programs, although it would be difficult to automate this pro-cedure. It is necessary to identify the relationship between the input parameters and the internal program constants in order to determine which parameters should be scaled.
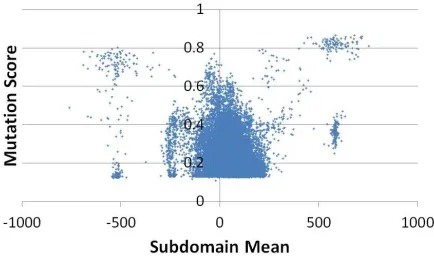
Schedule achieves an average mutation score of just 0.350 with 10 test cases, but 0.845 with 100 test cases
[image:6.612.327.544.184.315.2](see Figures 2g). Looking at the subdomains produced by optimisation (see Figure 1) suggests that parameters (such as ‘prio 1’) have important values in different areas of their input domain. Hence the optimised subdomains for Schedule are large and 10 test cases insufficient to cover the important input values. One possible solution would be to use multiple subdomains, one for each cluster of values that achieve a high mutation score.
Figure 1. Subdomain means for ’prio 1’
Evolved subdomains typically require fewer test cases than directed search techniques such as dynamic symbolic execution (see Table III). Papadakis and Malevris [19] used 8927 test cases to achieve a 56% mutation score with Replace. It should be noted that our technique evaluates test cases at each generation of subdomain evolution. It took an average of 244 generations to achieve convergence with Replace (see Table V. Therefore, for subdomains with 100 test cases, we evaluated on average almost three times as many test cases as dynamic symbolic execution. The real benefits of our technique only become available once the subdomains have been evolved.
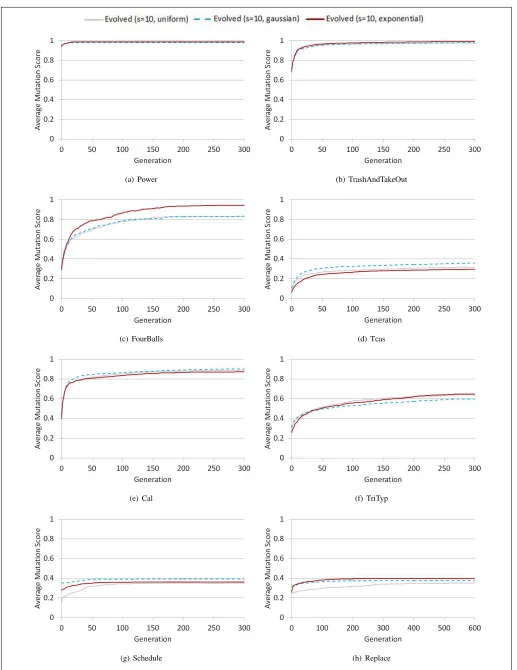
B. Are some shapes of input distribution (within the evolved subdomains) more efficient at killing mutants than others?
In addition to uniform sampling, subdomains were opti-mised for Gaussian and exponential distributions. There was a significant difference in average mutation score between the shapes of input distribution used to sample 10 test
Table III
DIFFERENCE BETWEEN OPTIMISED SUBDOMAINS AND RANDOM BENCHMARKS
Program 1) Compared to Initial 2) Compared to Expected s=10 s=100 s=1000 s=10 s=100 s=1000
Power +5.04% +5.72% +6.30% +2.45% -0.0645% -0.0918%
TrashAndTakeOut +44.7% 42.2% +42.4% +23.8% +1.68% +0.176% FourBalls +191% +231% +226% +134% +31.3% -0.733%
Table V
NUMBER OF GENERATIONS BEFORE CONVERGENCE
Program Number of generations Maximum Average
Power 36.0 5.68
TrashAndTakeOut 216 79.4 FourBalls 197 75.8
Tcas 297 183
Cal 297 203
TriTyp 300 207
Schedule 269 65.1
Replace 476 244
cases (see Figure 3). Gaussian distributions achieved higher mutation scores with Tcas, Cal and Schedule; exponential distributions performed better with Power, TrashAndTake-Out, FourBalls, TriTyp and Replace.
The difference between input distributions is very small, however, when compared to the improvement made by optimising the subdomain minimum and maximum values. The biggest improvement in mutation score (13.4%) was seen when changing the FourBalls sampling distribution from uniform to exponential with 10 test cases. This is much less than the improvement already made for this program by subdomain optimisation (134%). The difference is even smaller when more test cases are sampled. No significant difference was observed with FourBalls between the distribution shapes used to sample 1000 test cases.
On the eight programs evaluated, uniform sampling was never the best choice. This suggests it is useful to focus test cases on a particular part of each subdomain. The problem lies in deciding which distribution shape to use. In our experiments, choosing the right shape only provided a small increase in mutation score. Perhaps we should adopt a more complex approach to match the ideal shape more closely.
VI. RELATEDWORK
Despite its weaknesses, random testing is often used in research and industry [21]. It is has the ability to produce test cases quickly and can be implemented without analysing the source code. Random testingcanhandle complex struc-tures given an operational profile of expected usage and a sufficient number of test cases [21]. The computational cost is particularly high for mutation testing because, in addition to complex reachability conditions, it is also necessary for faults to propagate their effect to the output. This paper
presents a new approach that allows effective use of random testing for mutation coverage by carefully selecting subdo-mains of input to the program under test.
Previous research into random testing has aimed at dis-tributing test cases more evenly to reduce the time it takes to find faults. Adaptive Random Testing (ART) [22] maximises the distance between existing test cases and Restricted Ran-dom Testing (RRT) [23] sets up an exclusion zone around each test case. Quasi-random sequences [24] and lattices [25] have also been investigated. There are some limitations to this technique. Chen and Merkel [26] have proven that no strategy can find a fault in less than half the test cases as a purely random strategy without using information about the behaviour of the software. Arcuri and Briand [27] have shown that the added expense involved with these techniques can sometimes outweigh the benefits.
Most test generation strategies for mutation use directed structural search techniques. Fraser and Zeller [32] measure how close a test suite is to killing a mutant in terms of branch coverage and mutant impact. Dynamic symbolic execution has been used to exercise mutants [30] [19] [31]. Papadakis and Malevris [19] negate symbolic branch conditions to promote mutant propagation. Harman et al. [31] search for conditions that maximally disrupt the execution path after mutation. These techniques are all ‘white box’. Mutants are targeted individually and specific test cases produced. This approach does not work on every program and it is computationally expensive to produce new test cases. Our technique is more ‘black box’. It finds input subdomains, which can be used repeatedly and inexpensively to produce high performing test cases.
There are parallels between our work and statistical structural testing. Statistical testing has been used for spec-ification models [28] and also for branch coverage [29]. The aim is to find an input distribution for testing such that it achieves an even coverage of the program elements. Statistical structural testing optimises more complex shapes of input distribution than we achieve in our research. These techniques have not yet been applied to mutation testing. Mutation coverage is more difficult to achieve than branch coverage and there are questions over how to optimise complex input shapes for mutation testing. Our technique produces simple input subdomains which can easily be reused. It may also be possible to adapt our technique for more sophisticated shapes of subdomain input distribution.
Table IV
COMPARISON WITHDYNAMICSYMBOLICEXECUTION
Program Evolved subdomains (s=100) Papadakis and Malevris [19] Harman et al. [31] Highest mutation score Average Mutation Score Mutation Score Test Cases Mutation Score Test Cases
Tcas 62% 47% 64% 422 54%
-TriTyp 99% 95% 69% 90 59%
-Schedule 100% 85% 57% 301 57%
-(a) Power (b) TrashAndTakeOut
(c) FourBalls (d) Tcas
(e) Cal (f) TriTyp
[image:8.612.51.564.69.745.2](g) Schedule (h) Replace
(a) Power (b) TrashAndTakeOut
(c) FourBalls (d) Tcas
(e) Cal (f) TriTyp
[image:9.612.53.570.65.735.2](g) Schedule (h) Replace
VII. CONCLUSIONS
Our optimisation technique identified subdomains from which test cases can be selected with higher mutation score than from the interval [0..100] or random subdomains thereof. This was achieved for eight benchmark programs, three sizes of test suite and three shapes of input distri-bution. Our technique only failed to surpass the expected mutation score of subdomains selected from [0..100] when the expected mutation score was 100%.
Optimisation increased the mutation score of each test suite, but greater improvements were made using 10 test cases compared to 100 or 1000, largely because the initial mutation score was much lower. The three shapes of input distribution used to sample test cases had little effect on the mutation score. The distribution shapes used in our exper-iments are primitive. This allows us to specify a different distribution shape without any additional parameters, but more complex shapes may achieve better results.
Scaling the parameters of Tcas allows more effective identification of subdomains. Some basic understanding of the program code was necessary in order to determine which parameters to scale. This threatens the validity of subdomain optimisation as a black-box technique, but it was only necessary to have knowledge of the global constants in Tcas. No scaling was needed for the other seven programs.
The strengths of our technique are:
1) It allows black-box testing for an unknown program
2) It selects effective subdomains for regression testing
3) It provides some insight into how to choose good input values for testing a program (e.g. Tcas)
The weaknesses of our technique are:
1) It is computationally expensive if the resulting subdomains are only used once
2) It can be difficult to decide how best to represent the input parameters in an evolution strategy
3) It may not always possible to optimise subdomains without some understanding of the program code
VIII. FUTURE WORK Some suggestions for future work include:
1) Optimising more sophisticated shapes of input dis-tribution, from which to sample test cases
2) Experimenting with larger test programs, using examples from industry
3) Investigating whether we can learn about program behaviour using the optimised subdomains
Our technique can be made more sophisticated by opti-mising multiple subdomains for each input parameter. This may help in cases where important input values are located far apart (e.g. Schedule). The challenge will be to decide where to focus each subdomain. We could take a clustering approach based on the previous results. It would be simpler to optimise the subdomains simultaneously, using an extra parameter to determine how often each set of subdomains is used. This approach would effectively generate a mixture distribution of subdomains.
We can also use more generalised distributions such as the Weibull and exponentiated Weibull distribution, or build up a histogram of input values (using similar techniques to statistical testing). The disadvantage of extending our technique in this way is that the extra complexity of adding more parameters may make optimisation more difficult.
We can improve the evolution strategy by adapting a separate variance for each parameter. Different parameters require different sized steps away from the mean for optimal fine-tuning. Techniques such as CMA-ES take this into account by adapting a covariance matrix rather than a single variance for Gaussian adaptation. It is difficult to make generalised statements from our current results. With more advanced forms of evolution strategy, we should be able to apply our technique to larger programs used in industry.
REFERENCES
[1] G. J. Myerset al., “Test-case design,” inThe Art of Software Testing,3rd ed. Hoboken, NJ: Wiley, 2011, ch. 4, pp. 41-84.
[2] J. H. Andrewset al., “Tool support for randomized unit testing” in Proc. 1st Int. Workshop Random Testing, Portland, ME, 2006, pp. 36-45.
[3] P. G. Frankl et al., “All-uses versus mutation testing: an experimental comparison of effectiveness,”J. Syst. Softw., vol. 38, no. 3, pp. 235-253, June 1996.
[4] J. H. Andrewset al., “Is mutation an appropriate tool for testing experiments?” inProc. 27th Int. Conf. Software Engineering, St. Louis, MO, 2005, pp. 402-411.
[5] P. McMinn et al., “Reduding qualitative human oracle costs asssociated with automatically generated test data” in Proc. 1st Int. Workshop Software Test Output Validation, Trento, IT, 2010, pp. 1-4.
[6] X.-S. Yang,Nature-Inspired Metaheuristic Algorithms,2nd ed. Frome, England: Luniver, 2011, ch. 1, pp. 1-5.
[7] G. B. Dantzig, “Maximisation of a linear function of variables subject to linear inequalities,” in Activity Analysis of Produc-tion and AllocaProduc-tion, T. C. Koopmans, Ed., New York, NY: Wiley, 1951, ch. 11, pp. 339-347.
[8] J. B. Kruskal, “On the shortest spanning subtree of a graph and the traveling salesman problem,”Proc. Amer. Math. Soc., vol. 7, no. 1, pp. 48-50, Feb. 1956.
[9] T. B¨ack, “Evolution strategies,” inEvolutionary Algorithms in Theory and Practice, Oxford, England: Oxford Univ. Press, 1996.
[10] B. Babb et al., “State-of-the-art lossy compression of mar-tianimages via the CMA-ES evolution strategy,”Proc. Int. Soc. Optics Photonics, vol. 8305, pp. 22-26, Feb. 2012.
[11] V. Nissen and S. Gold, “Survivable network design with an evolution strategy,” in Success in Evolutionary Computation (Studies in Computational Intelligence), A. Yang et al. Eds., Berlin, Germany: Springer, 2008, pp. 263-283.
[12] J. Jung, “Using evolution strategy for cooperative focused crawling on semantic web,” Neural Comput. Appl., vol. 18, no. 3, pp. 213-221 Apr. 2009.
[13] T. Weise, “Evolution strategy,” Global Optimization Al-gorithms - Theory and Application, 2nd ed. Kassel, Ger-many: Weise, 2009. [E-book] Available: http://www.it-weise.de/projects/book.pdf [Accessed 10 Jan. 2013].
[14] S. Garc´ıaet al., “A study on the use of non-parametric tests for analyzing the evolutionary algorithms behaviour: a case study on the CEC 2005 Special Session on Real Parameter Optimization,”J. Heuristics, vol. 15, no. 6, pp. 617-644, Dec. 2009.
[15] M. Matsumoto and T. Nishimura, “Mersenne twister: a 623-dimensionally equidistributed uniform pseudo-random number generator,”ACM Trans. Modeling Comput. Simulation, vol. 8, no. 1, pp. 3-30, Jan. 1998.
[16] H.-G. Beyer and H.-P. Schwefel, “Evolution strategies: a comprehensive introduction,”Natural Computing, vol. 1, no. 1, pp. 3-52, May 2002.
[17] P. Ammann and J. Offutt, “Introduction to software testing,” New York, NY: Cambridge Univ. Press, 2008.
[18] M. P. Usaolaet al., “Reduction of test suites using mutation,” in Proc. 15th Int. Conf. Fundamental Approaches Software Engineering, Tallinn, Estonia, 2012, pp. 425-438.
[19] M. Papadakis and N. Malevris, “Automatic mutation test case generation via dynamic symbolic execution,” in Proc. 21st IEEE Int. Symp. Software Reliability Engineering, San Jose, CA, 2010, pp. 121-130.
[20] G. E. P. Box and M. E. Muller, “A Note on the Generation of Random Normal Deviates,”Ann. Math. Statist., vol. 29, no. 2, pp. 610-611, Jan. 1958.
[21] D. Hamlet, “When only random testing will do,” inProc. 1st Int. Workshop Random Testing, Portland, ME, 2006, pp. 1-9.
[22] T. Y. Chenet al., “Adaptive random testing,” in Proc. 9th ASIAN Computing Science Conf., Chiang Mai, Thailand, 2004, pp. 320-329.
[23] K. P. Chanet al., “Restricted random testing,” inProc. 7th Int. Conf. Software Quality, Helsinki, Finland, 2002, pp. 321-330.
[24] T. Y. Chen and R. G. Merkel, “Quasi-random testing,”IEEE Trans. Reliab., vol. 56, no. 3, pp. 562-568, Sept. 2007.
[25] J. Mayer, “Lattice-based adaptive random testing,” inProc. 20th Int. Conf. Automated Software Engineering, Long Beach, CA, 2005, pp. 333-336.
[26] T. Y., Chen and R. G. Merkel, “An upper bound on software testing effectiveness,”ACM Trans. Software Eng. Methodology, vol. 17, no. 3, article no. 16, June 2008.
[27] A. Arcuri and L. Briand, “Adaptive random testing: an illusion of effectiveness?” in Proc. 20th IEEE Int. Symp. Software Testing Analysis, Toronto, Canada, 2011, pp. 265-275.
[28] P. Th´evenod-Fosse and H. Waeselynck, “STATEMATE ap-plied to statistical software testing,” inProc. IEEE Int. Symp. Software Testing Analysis, Cambridge, MA, 1993, pp. 99-109.
[29] S. Poulding and J. A. Clark, “Efficient software verification: statistical testing using automated search,” Trans. Software Eng., vol. 36, no. 6, pp. 763-777, Nov. 2010.
[30] L. Zhang et al., “Test generation via dynamic symbolic execution for mutation testing,” in Proc. IEEE Int. Conf. Software Maintenance, Timis¸oara, Romania, 2010, pp. 533-543.
[31] M. Harmanet al., “Strong higher order mutation-based test data generation,” inACM SIGSOFT Symp. Foundations Soft-ware Engineering, Szeged, Hungary, 2011, pp. 212-222.