the I-mode regime.
White Rose Research Online URL for this paper:
http://eprints.whiterose.ac.uk/133757/
Version: Accepted Version
Article:
Hubbard, A. E., Osborne, T., Ryter, F. et al. (29 more authors) (2016) Multi-device studies
of pedestal physics and confinement in the I-mode regime. Nuclear Fusion. 086003. ISSN
1741-4326
https://doi.org/10.1088/0029-5515/56/8/086003
[email protected] https://eprints.whiterose.ac.uk/ Reuse
Items deposited in White Rose Research Online are protected by copyright, with all rights reserved unless indicated otherwise. They may be downloaded and/or printed for private study, or other acts as permitted by national copyright laws. The publisher or other rights holders may allow further reproduction and re-use of the full text version. This is indicated by the licence information on the White Rose Research Online record for the item.
Takedown
If you consider content in White Rose Research Online to be in breach of UK law, please notify us by
Multi-device Studies of Pedestal Physics and Confinement in the
I-mode Regime
A. E. Hubbard1, T. Osborne2, F. Ryter3, M. Austin4, L. Barrera Orte3,a, R. M. Churchill7, I. Cziegler5,b, M. Fenstermacher6, R. Fischer3, S. Gerhardt7, R. Groebner2, P. Gohil2, T. Happel3, J. W. Hughes1, A. Loarte8, R. Maingi7, P. Manz3, A. Marinoni1, E. S. Marmar1,
R.M. McDermott3, G. McKee9, T. L. Rhodes10, J.E. Rice1, L. Schmitz10, C. Theiler11, E. Viezzer3, J. R. Walk1, A. White1, D. Whyte1, S. Wolfe1, E. Wolfrum3, Z. Yan9,
and the Alcator C-Mod, ASDEX Upgrade and DIII-D Teams
1
Plasma Science and Fusion Center, Massachusetts Institute of Technology, Cambridge, MA, USA.
2
General Atomics, PO Box 85608, San Diego, California 92186-5608, USA.
3
Max-Planck-Institut für Plasmaphysik, Boltzmannstraße 2, D-85748 Garching, Germany.
4
Institute for Fusion Studies, University of Texas, Texas 78712, USA.
5
University of California San Diego, Center for Momentum Transport and Flow Organization, La Jolla, California, USA.
6
Lawrence Livermore National Laboratory, 7000 East Avenue, Livermore, California 94550, USA.
7
Princeton Plasma Physics Laboratory, P.O. Box 451, Princeton, New Jersey 08543-0451, USA.
8
ITER Organization, Route de Vinon-sur-Verdon, CS 90 046, 13067 St Paul Lez Durance Cedex, France.
9
University of Wisconsin-Madison, Madison, Wisconsin 53706, USA.
10
University of California Los Angeles, P.O. Box 957099, Los Angeles, California 90095-7099, USA.
11
Ecole Polytechnique Fédérale de Lausanne (EPFL), Swiss Plasma Center (SPC), CH-1015 Lausanne, Switzerland.
E-mail contact of main author: [email protected]
Abstract. This paper describes joint ITPA studies of the I-mode regime, which features an edge thermal barrier together with L-mode-like particle and impurity transport and no Edge Localized Modes (ELMs). The regime has been demonstrated on the Alcator C-Mod, ASDEX Upgrade and DIII-D tokamaks, over a wide range of device parameters and pedestal conditions. Dimensionless parameters at the pedestal show overlap across devices and extend
a
Present affiliation: ITER Physics Department, EUROfusion - Programme Management Unit, Boltzmannstrasse
2, 85748 Garching.Germany
b
to low collisionality. When they are matched, pedestal temperature profiles are also similar. Pedestals are stable to peeling ballooning modes, consistent with lack of ELMs. Access to I-mode is independent of heating method (neutral beam injection, Ion Cyclotron and/or Electron Cyclotron Resonance Heating). Normalized energy confinement H98,y2 ≥ 1 has been achieved for a range of 3≤q95≤4.9 and scales favourably with power. Changes in turbulence in the pedestal region accompany the transition from L-mode to I-mode. The L-I threshold increases with plasma density and current, and with device size, but has a weak dependence on toroidal magnetic field BT. The upper limit of power for I-modes, which is set by I-H transitions, increases with BT and the power range is largest on Alcator C-Mod at B > 5 T. Issues for extrapolation to ITER and other future fusion devices are discussed.
Keywords: FEC 2014, tokamak, I-mode, pedestal
1. Introduction
about degradation of the pedestal and resulting fusion performance. These issues will be even more serious for a reactor; hence development and exploration of intrinsically ELM-free regimes, including I-mode and alternatives such as Quiescent H-mode [5] are important.
Key to the potential extrapolation of the I-mode regime to ITER and future reactors is the scaling of accessibility conditions and performance. The multi-machine experiments reported here, supported by the Pedestal and Edge Physics as well as Transport and Confinement topical groups of the International Tokamak Physics Activity (ITPA), are the start of such studies. The regime has been most extensively studied in Alcator C-Mod but has also been explored for several years in ASDEX Upgrade [6]. More recently, I-mode has been observed on DIII-D [7]. Experiments on EAST, KSTAR, TCV and NSTX-U are planned soon, and this study aims to guide the choice of initial experimental parameters. Observations on the different devices share some general characteristics, but also reveal some differences.
This paper describes the experience and typical observations of the I-mode regime in each device, including density, temperature and electric field profiles and measured fluctuations in the transport barrier or ‘pedestal’ region (Section 2). In Section 3, we compare the operational spaces in which the regime has been observed to date, in terms of both global and pedestal parameters and energy confinement. Comparison of pedestal profiles in a dedicated identity experiment between C-Mod and AUG, shown in Section 4, provides further evidence of common physics across devices. Initial studies of power thresholds for accessing and remaining in I-mode are presented in Section 5. Section 6 discusses prospects and key open issues for extrapolation to future devices, including ITER.
2. Observations of the I-mode Regime in Tokamaks
The common means of accessing I-mode in tokamaks is to operate with ‘unfavourable’ ion
B×B drift, away from the active X-point, and to increase the input power such that it remains below the H-mode threshold P(L-H), which is higher in this configuration. All discharges used in this paper are in this configuration and feature D as the main ion species, though some observations have been made in the favourable B×B configuration [8] and using H [6].
The I-mode regime and time of transitions are identified using the primary defining characteristics, namely
1) The formation of an edge temperature pedestal, i.e. a locally increased gradient, either abruptly or gradually, without a significant change in edge density profile with respect to L-mode.
2) Changes in edge turbulence, indicative of a change in local transport in the vicinity of the pedestal.
Signatures of an L-H-mode transition, namely an abrupt increase of density and drop in D,
should be absent. As will be described for each experiment below, I-mode discharges on Alcator C-Mod, ASDEX-Upgrade and DIII-D each share these characteristics. There are, as may be expected, differences in the degree of these changes with plasma parameters, and some other features which have been observed to be typically associated with the regime.
2.1. Alcator C-Mod
The I-mode regime has been most extensively and routinely studied in the Alcator C-Mod tokamak, a compact, high magnetic field device with Mo PFCs, major radius R=0.68 m, minor radius a=0.21 m and elongation ~1.6-1.7. Heating has been from Ion Cyclotron Resonance Heating (ICRH), with up to 5 MW coupled. Both reversed field, lower single null (LSN) and normal field upper null (USN) configurations have been used; in each case B×B
drift is away from the X-point. LSN has provided best performance and widest operating space, perhaps due to the shaped lower divertor designed for high heat flux. As reported in the IAEA Fusion Energy Conference 2012 [9], stationary I-mode plasmas with E reaching or often exceeding the ITER H98,y2 scaling have been demonstrated over a wide range of plasma conditions. Experiments in 2014 have further extended the range of parameters and improved measurements. The lower magnetic field range has been extended to 2.8 T and some examples of I-mode have been noted in earlier 8 T experiments with D(He3) ICRH. Further extensions, including I-modes up to 8 T and examples in near double null configurations were made in the recently completed 2015 campaign, but these data have not yet been included in the multidevice datasets reported here.
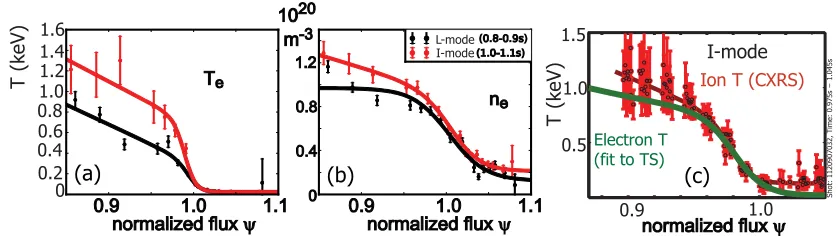
power step, when pedestal and core Te strongly increase but there is no break in slope in density. Te pedestals, measured by Edge Thomson Scattering and Electron Cyclotron Emission (ECE), can reach 1 keV (Figure 2), while pedestal density stays near L-mode. Ti pedestals, measured by Charge Exchange Recombination Spectroscopy (CXRS), are equal to Te in terms of gradient and height and can be overlaid within alignment uncertainties. A radial electric field ( Er) well forms in the same location as the Ti pedestal [10]. The pressure pedestal width exceeds that obtained in ELMy H-modes modes at the same pedestal value of poloidal beta, and is in fact wider than the semi-empirical scaling utilized in the EPED1.0 model. While the width is of the same order as the poloidal ion gyroradius, no correlation with i,pol is found [11]. Stability analysis confirms that the pedestal is well below the peeling-ballooning stability limit, consistent with the typical lack of ELMs [3]. The margin between the observed pped and the stability limit indicates room to increase pedestal and global performance further; the upper bound is set either by available heating power, at optimal configuration and density, or in some cases by transitions from I-mode to H-mode. Initial confinement scalings show total plasma stored energy, W, increasing nearly linearly with the product of power and plasma current, resulting in a weak power degradation of energy confinement, at most E~P-0.28[11]. For comparison, the H-mode scaling 98,y2 degrades much more strongly, with P-0.69 [12]. Impurity confinement imp is similar in level and scaling to that in L-mode, 15-30 ms for both Ca and Mo injected species, vs 0.1-1 s in H-mode [13].
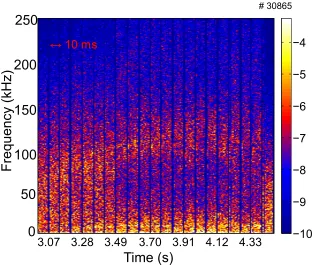
a fluctuating zonal flow at the Geodesic Acoustic Mode (GAM) frequency, typically 20 kHz, is observed in the pedestal region only in the I-mode regime [16]. An example of both turbulent features is shown in Figure 3. The narrow feature in vis at the GAM frequency,
while the broad density fluctuation in the bottom panel is the WCM. Energy is transferred between the WCM and the GAM, away from the peak WCM frequency. This process likely contributes to the broad frequency spectrum (f/f~0.5) of the WCM.
Reductions in the core ne and Te turbulence, by typically 10-30%, have also been observed at the L-I transition, consistent with the decrease in core thermal transport [17]. Nonlinear gyrokinetic simulations of I-mode [18] show that I-mode core ion temperature and electron temperature profiles are more stiff than L-mode core plasmas. Scans of the input ExB shear in GYRO simulations show that ExB shearing of turbulence is a stronger effect in the core of mode than L-mode, which can help explain why core turbulence levels are reduced in I-mode. The nonlinear simulations show that I-mode resembles H-mode plasmas with regards to marginal stability of ITG modes and temperature profile stiffness.
2.2ASDEX Upgrade
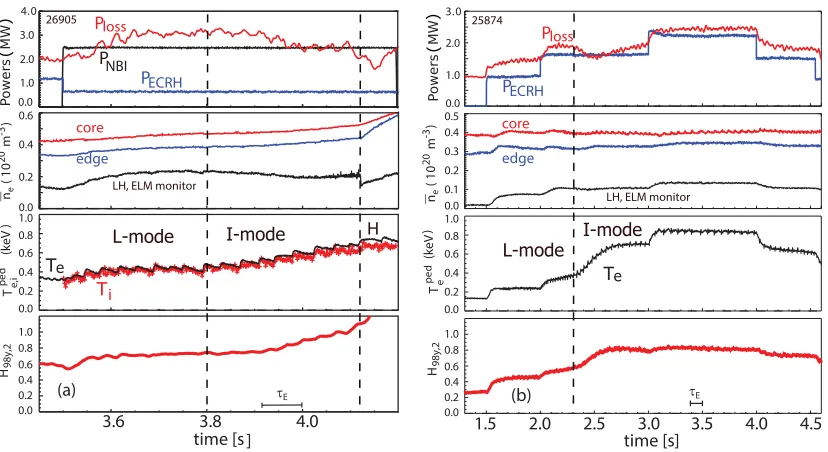
An example of an I-mode discharge on ASDEX Upgrade is shown in Figure 4(a). In this case pedestal temperatures and global confinement increase gradually, starting at about 3.8 s. H98,y2 exceeds 1.0 by 4.1 s. However, a spontaneous transition to H-mode, as evidenced by sharp changes in density and D emission, occurs at 4.12 s. In other cases, such as the example in Figure 4(b), I-mode remains stationary for many energy confinement times[6]. Detailed measurements of ne and Te profiles in the pedestal and core are available from Thomson scattering, DCN interferometry, ECE and a lithium beam. Ti, rotation and Er are measured using CXRS. Example profiles, with Ti close to Te, are shown in Figure 5. Core Te and Ti are also approximately equal in this scenario. With ECH, pedestals are similar but Te exceeds Ti in the core. An Er well also gradually develops in the region of the temperature and pressure pedestal, which is intermediate between L and H-mode [19,20].
Reflectometry measurements in the AUG pedestal region exhibit a density oscillation whose characteristics are very similar to the C-Mod WCM. The frequency is in the range 70 - 150 kHz with a bandwidth (fwhm) of about 50 kHz. The amplitude of the density fluctuations in this frequency range increases somewhat as the I-mode pedestal develops while the amplitude of the fluctuations outside of the WCM frequency band decreases, such that the peak becomes more visible. The mode appears in close relation with the L-I transition independently of the heating method and seems to require a minimum value of the pressure gradient. It should be noted that the WCM is very similar to the "edge MHD mode" found in RF heated L-mode discharges in AUG [21].
The development of the I-mode pedestal is also accompanied, in this radial region, by an increase in the time-averaged perpendicular velocity of the density fluctuations, while the erratic variations of this quantity also become more pronounced as the pedestal develops. Although the background turbulence level decreases, intermittent strong turbulence events of short duration (~10 s) are observed [20].
2.3DIII-D
I-mode experiments on DIII-D (R=1.67 m, a=0.67, carbon PFCs) have used the lower single null, reversed BT configuration. The plasma current was kept in its typical orientation. Most discharges used NBI, with variable modulation to scan the average input power. ECH, and different combinations of co and counter NBI, were also assessed in the most recent experiments. Toroidal magnetic field was 2.05 T. Ip was varied from1-1.6 MA, giving q95=3.3-5.2. Shaping was scanned from L=0.37-0.72 and=1.62-1.72, with most parameter scans at a fixed L=0.53, =1.7.
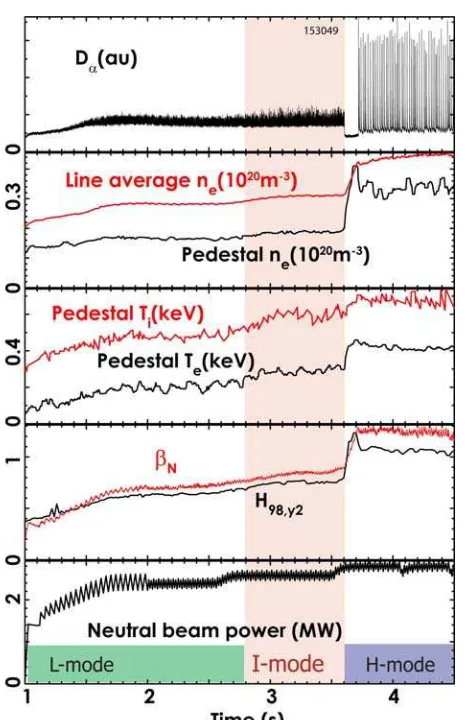
The time history of a typical discharge is shown in Figure 7. As NBI power is slightly increased, there is a gradual increase in pedestal Te and Ti and clear formation of an edge T gradient. Stored energy and normalized confinement time also increase, while density and D emission change only slightly. At slightly higher NBI power, the discharge transitions to ELMy H-mode, with a strong increase in ne. The discharge thus shows the key feature of I-mode, though it is less robust than on the other tokamaks. As on ASDEX Upgrade, transitions were similar with NBI heating and/or ECH. Pedestal profiles from a different example, with Ip=1.2 MA, q95=4.3, are shown in Fig. 8. Density profiles in I-mode are very similar to L-mode, while Te is intermediate between L-mode and H-mode. A difference from ASDEX Upgrade and C-Mod is that, in all regimes, pedestal ion temperatures are significantly higher than electron temperatures, indicating weak electron-ion coupling. Similar to C-Mod and AUG, Er shear increases in the regions of the Ti pedestal, and is also intermediate between L-mode and H-mode levels [7].
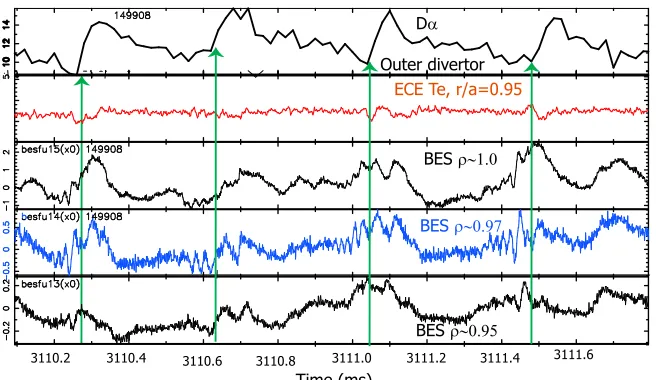
shows a weak minimum at f~ 200 kHz and a peak at 300-400 kHz [7]. Examples of PCI spectra are shown in Figure 9(a). Doppler back-scattering, which is also sensitive to ne fluctuations [23], localizes the decrease to a region near the pedestal top (Fig 9(b)). The characteristics are intermediate between L-mode and H-mode turbulence, and evolve gradually during the period in which a T pedestal forms. Bursts of ne and Te fluctuations in the 60 kHz range have also been observed in some discharges, localized near the top of the Te pedestal and accompanied by small increases in divertor D. An example is shown in Figure 10. This ‘burstiness’ in D can also be seen as an increased fluctuation level in the example of Fig. 7, and may indicate more intermittent transport in I-mode as seen on AUG. The instability causing these fluctuations is unclear. Similar to the C-Mod results [3], the pedestal p in I-mode is low, more than a factor of 4 below the critical gradient for peeling-ballooning mode stability reached before the ELMs in the H-mode phase as computed with ELITE [24], and also roughly a factor of 2 below the ideal infinite-n ballooning mode limit. Hence the D bursts are not typical Type I ELMs. The lower pressure gradient, and the fact that the pedestal width in DIII-D I-mode is a factor of 2 to 5 larger than EPED1.0 scaling [25], as shown in Figure 11, also indicates that I-mode edge pressure gradient is not set by the kinetic ballooning mode as is thought to be the case in H-mode.
3. Comparison of achieved global and local parameters for I-mode.
An important task of this joint activity has been to assemble and compare a database of plasma parameters in achieved I-modes in each of the above devices. It should be noted that it is not exhaustive, in that experiments have not yet assessed all of the operating space in each tokamak. Rather it provides a map of where I-modes have been achieved to date and serves as a guide to potentially important parameters, and for extrapolation to other tokamaks.
up to 0.8. In both C-Mod and AUG, E in I-mode does not degrade significantly with power as in H-mode [9,3,6,11], thus the best normalized and absolute performance is achieved when maximum power can be applied and pedestal pressures achieved. This trend contrasts with the E~P-0.7 scaling of H98,y2. Trends in pedestal pressure with power are similar, consistent with the peeling-ballooning stable pedestals noted in Section 2. Global parameters for I-modes to date are summarized in Table 1.
C-Mod AUG DIII-D
Ip (MA) 0.56-1.4 0.8-1.0 0.96-1.4
BT (T) 2.8-8.0 1.9-2.5 2.04
q95 2.4-5.2 3.0-4.1 3.5-5.2
e
n (1020 m-3) 0.9-2.3 0.16-0.3 0.22-0.51
e
n /nG 0.11-0.35 0.22-0.6 0.26-0.53
Ploss (MW) 1.5-5.1 1.6-3.0 2.4-4.1 Heating method ICRH NBI, ECH,
ICRH
NBI, ECH
The three tokamaks also span an extremely wide range of pedestal parameters in I-mode, as shown in Figure 13(a). Alcator C-Mod has the absolute highest densities, up to ne,ped=1.6x10²⁰m-3 (ne=2.3x10
20
ITPA L-H threshold scaling (for favourable magnetic configuration), could be added without transitions, and Tped and pped continued to increase with Ploss. The upper range of average pressure in I-modes is set by the same limitations of thresholds and power. To date, the maximum normalized pressure on all devices has been modest, up to N=1.4. However, there is not an apparent MHD limit encountered.
The devices show greater commonality in dimensionless pedestal parameters. Figure 13(b) shows pedestal gyroradius *=i/a, computed using Te,ped, vs electron collisionality *ped, computed assuming Zeff=1.2. A wide range is seen in both parameters, with *ped=0.17-4.3, and *=2.2-5.5x10⁻³. AUG pedestal data and the C-Mod pedestals at BT=4-6 T have strong overlap; indeed some of the experiments were carried out with the aim of producing dimensionless matches as discussed in Section 4. Importantly for future devices, many of the high performance I-modes are at low *, and there is no indication of a lower limit in collisionality or q95. This contrasts with the operation spaces for ‘grassy’, Type II and Enhanced D-alpha (EDA) H-mode small or no ELM regimes as found in a prior ITPA study [26].
Due to the lack of a particle barrier, natural density ranges in I-mode tend to be lower than in H-mode. Above a certain target density, discharges typically transition directly from L-mode to H-L-mode. However, C-Mod has demonstrated that the density can be increased by fueling after the transition to I-mode [9]. With sufficient input power, Tped can be maintained [3]. The limits in density, as for pressure, are generally set by I-H transitions. The I-mode operating space is thus dependent on transition physics and scalings, the subject of Section 5.
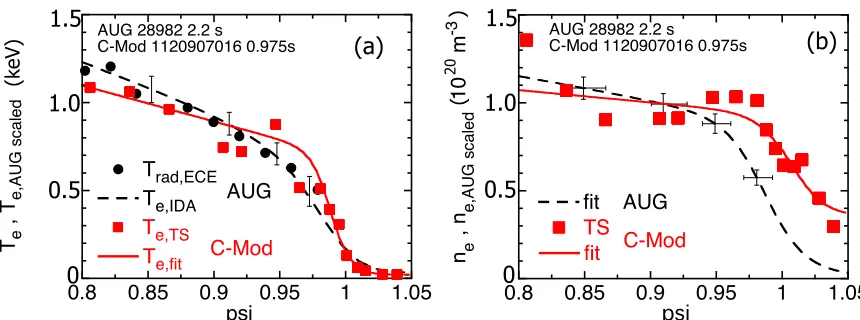
4. Dimensionless identity experiment between AUG and C-Mod
and C-Mod. In the frame of the ITPA TC-18 joint experiment, this method has been applied for I-modes in, and the emphasis was put on the identity in the pedestal region. In this approach, the following scaling rules are applied to obtain the identity of the plasma parameters: BT ~ R-5/4, IP ~ R-1/4, ne ~ R-2 and T ~ R-1/2, which for equivalent confinement, constant, should require Ploss ~ R-3/4. In addition q95, plasma shape, heat deposition profiles should be kept as similar as possible. A similar approach has proven valuable for multidevice comparisons of H-mode pedestals and L-H transitions, eg [30].
Close but not exact matches of these parameters, and of shape, were achieved in these experiments, with magnetic field and density 5.8 T and 1.5x10²⁰ m-3 on C-Mod and 1.9 T and 0.25x10²⁰ m-3 on AUG. As shown by Figures 15(a) and (b), the density in C-Mod is at the upper boundary of the I-mode domain, whereas it is at the low boundary for AUG, limiting somewhat the flexibility in these experiments. The plasma gas was deuterium and in both cases the ion B×B drift was away from the active X-point as required for reliable I-modes. In C-Mod the heating method was ICRH hydrogen minority, while in AUG NBI was used with in addition about 20% of central ECRH to prevent any risk of tungsten accumulation. This leads to dominant electron heating in the central part, qe/qi > 1.4 for tor < 0.5, while qe≈ qi at the plasma edge, as revealed by the power balance calculations.
tokamaks DIII-D32 and JET33, likely reflecting the influence of particle sources; ionization lengths are influenced by atomic physics and are shorter at high absolute density.
Despite the good match in the pedestal, the BT values differ significantly with BT = 0.266 in C-Mod and BT = 0.173±0.02 [T s] in AUG. The loss power is 2.9 MW in C-Mod and 1.8 MW in AUG, which would correspond to a scaled value of 3.5 MW. Considering the good agreement in the pedestal, this difference BT most likely arises from the core, whereby a possible explanation for the lower value in AUG can be the high Te/Ti ratio in the central part of the plasma, linked to the higher local electron heat flux mentioned above. Indeed Te/Ti > 1.5 for tor < 0.5 such that the ion energy content contributes to only one third of the total plasma energy content. In addition, the heating methods and profiles were different, with a more peaked central deposition on C-Mod; uncertainties in ICRH absorption could also contribute to the differences in Ploss and E.
We also observed that, in the matched density cases, the scaled threshold power, P(L-I) and edge temperature, and the increase of Tped with Ploss, were also very similar between C-Mod and AUG. Thus, despite some differences in the core, these results indicate that the I-mode threshold and pedestal physics are indeed similar across devices.
5. Power thresholds for L-I and I-H transitions.
To be attractive as a regime for fusion, I-mode must be accessible at a reasonably low power, and also be maintained, without transitions to H-mode or back transitions to L-mode, for a sufficiently high power and at high enough density to reach high fusion power. Studying thresholds for both L-I and I-H transitions is thus important. To this end, we have analysed in addition to time slices within the I-mode phase, powers and parameters just before the transitions, denoted as threshold conditions. We define Ploss=Poh+Pheat(absorbed)–dW/dt, where Poh is the ohmic power, Pheat is the auxiliary power (ICRH, NBI and/or ECH) and W the stored energy. For AUG and DIII-D, only thermal contributions to W are included.
LSN discharges with BT 5-6 T and Ip 1-1.1 MA, is shown in Figure 15(a). An increase in PL-I is seenbelow a certain lower density, as is typical for L-H thresholds. AUG observes an offset linear dependence of PL-I with ne, as shown in Figure 15(b) which includes all conditions. L-I transitions on DL-IL-IL-I-D, in contrast, do not show a clear density dependence (Fig. 15(c)). L-It should be noted that transitions from L-mode to I-mode on DIII-D tend to be very gradual, as shown in Figure 7, and it can be difficult to pinpoint an exact time from profile measurements alone, hence the L-I “thresholds” give an approximate indication of the lower range of power in I-mode. However, the lack of an increase in power with density suggests that many of these discharges were at densities below the minimum threshold. The range of power for given density is relatively narrow, typically 2 MW.
I-H power thresholds are much more variable. On C-Mod, at high L-mode target density, prompt H-mode transitions can occur at moderate power. Such a case is included in Fig. 15 (a) (black open triangle). However, by increasing power and density together, the range of each can be significantly increased [9]. In this high density I-mode regime, I-H transitions can sometimes be triggered by a decrease in heating power. These results suggest a possible limit in collisionality, which should be explored further, For AUG also, I-H thresholds are scattered and at high density can even be at lower Ploss than L-I transitions. Thus, a simple power scaling does not seem to capture all the relevant physics of I-H transitions. On DIII-D, I-H transitions do occur at the upper range of power, but P(I-H) exhibits an inverse dependence on density, again suggesting the experiments were in a density regime below the minimum threshold for I-mode. I-mode formation did not depend strongly on heating method (ECH vs NBI) in either AUG or DIII-D. A torque scan was conducted on DIII-D to vary Er and E×B velocity shear. Discharges showed a modest reduction in the I-H transition power with balanced NBI injection while with ECH the threshold was similar to the co-NBI injection cases; these trends are similar to those for L-H threshold power on DIII-D [35].
DIII-D (S~52 m2) we find the size dependence at most linear with surface area S, as shown in Figure 16. Given the variation in the dataset, somewhat weaker dependences, such as S0.7 (dotted curve) would also be consistent. Noting the differences in plasma parameters between devices, further experiments on other tokamaks will help to clarify such dependences.
An experiment was carried out on C-Mod to assess the toroidal field dependence of the power range in I-mode. Discharges at 2.8 T, 550 kA, at the same shape and q95 as the example shown in Figure 1, and the dataset in Figure 15(a), were heated using 2nd harmonic H minority ICRH. The observed power and density ranges for I-mode were much lower; L-I transitions occurred with 1.2 MW ICRF (Ploss=1.46 MW), at n = 1.04x10e
20
m-3, while discharges transitioned to H-mode at only 1.5 MW (Ploss=1.54). This very narrow (5%) power range contrasts strongly with the much wider range, more than a factor of two, seen at 5.6 T. It is closer to that observed on DIII-D and AUG. Figure 17 shows normalized power Ploss/neS vs BT. As for
Figure 16, we have restricted to 3<q95<4.4 and densities above the minimum P(L-I). We note that C-Mod magnetic field ranges other than 4-6 T use heating scenarios which may have lower absorption than assumed here, hence powers are an upper bound. For both C-Mod and the combined dataset, it appears that the lower bound of L-I thresholds has a weak dependence on BT; a value of P/neS=0.15-0.25x10
-20
6. Conclusions and implications for future experiments.
The multi-machine studies in this paper have shown that the I-mode regime can be achieved in the ‘unfavourable’ ion B×B drift configuration over a very wide range of global and local parameters (BT=1.9-8 T, Ip=0.55-1.4 MA), and with multiple heating methods (ICRH, ECRH and NBI). The main features of I-mode are common to Alcator C-Mod, ASDEX Upgrade and DIII-D and include:
− formation of ion and electron temperature pedestals,
− increase in stored energy,
− little or no change in density,
− Er well developing in T pedestal region, intermediate between L-mode and H-mode,
− usually no ELMs.
Similar changes in pedestal turbulence are also seen in each device. While details differ, each sees a reduction in part of the spectrum, and a peak in density fluctuations at higher frequency. A fluctuating flow at the GAM frequency also plays a role, strongly interacting with the Weakly Coherent Mode on both AUG and C-Mod. Greater intermittency in turbulence is also observed; this has been most carefully studied on AUG.
The L-mode like particle transport found in the I-mode regime is advantageous for fusion in several respects, avoiding impurity accumulation and providing steady, readily controllable densities and compatibility with impurity seeding to reduce divertor heat fluxes. Notably, both C-Mod and AUG operate with high Z plasma facing components (Mo and W, respectively). The three devices span a wide range of pedestal ne and Te, and also *, q95 and
Perhaps the most important issue for I-mode concerns the threshold conditions to access the regime, and to maintain it without transitions to H-mode. Both C-Mod and AUG find P(L-I) increasing with density. C-Mod results show a scaling with plasma current. From the multi-machine dataset, the size scaling is at most linear with surface area. A threshold of Ploss/neS=1.5-2.5x10
-21
MW m fits most of the current observations on all three tokamaks.
The power range for which I-mode can be maintained differs between devices. Recent C-Mod experiments, and our multi-machine dataset, indicate that this is due to different toroidal magnetic field; L-I thresholds have a weak dependence on BT, while the upper range in power increases strongly with BT. The result is encouraging for ITER, which will also operate at 5.3 T, and implies that I-mode may be especially well suited to even higher magnetic field tokamaks such as have been proposed for future compact fusion devices [37,38]. For ITER, with S=678 m2, this would imply an L-I threshold of 68 MW atne=5x10¹⁹m-3 for deuterium plasmas, which is somewhat larger than the expected H-mode threshold for the favourable BT direction of 52 MW for deuterium plasmas (42 MW for DT). If size scaling is weaker, as could also be consistent with the data, or the L-I threshold with DT is reduced compared to deuterium plasmas as is the case for the L-H threshold, the required power could be much lower.
Another open and important issue under study is the extent to which density can be increased, along with total heating and fusion power, while remaining in I-mode. The observed upper range for I-modes of Ploss/neS ≤ 5x10
-21
MW m at 5.4 T would correspond to Ploss ≤350 MW for ITER atne=1020m-3. This is well above the expected auxiliary + alpha power power in the typical high QDT operational scenarios in ITER (Ploss ≤ 150 MW), hence it should be possible to stay in I-mode. A related issue, important for extrapolation to steady state reactors, is how high a normalized pressure, or N, can be achieved in I-modes. In general, the physics and scaling of I-H transitions and thresholds requires further study.
in reversed Ip-BT has operational requirements that cannot be met by the NBI injection system planned in ITER; therefore ICRH and ECRH are foreseen to be the heating schemes to be applied if the I-mode regime is investigated in ITER. Future new fusion facilities planning to exploit the I-mode regime should design for flexibility in magnetic drift direction. Further studies on our present devices will extend the studies of transitions, and physics underlying them, including fluctuations and flows in the pedestal region.
Acknowledgements
0.0 0.5
1.0 HITER98y2
1120907028 1.1 MA LSN
0 1 2 3 4 5
PICRF (MW)
0.0 0.5 1.0 1.5 2.0
ne (1020m-3)
0 4
8 Te(0) (keV)
0.00 0.50
1.00 Te,ped (keV)
0.5 0.6 0.7 0.8 0.9 1.0 1.1 1.2
time (s) 0 1 2 Dα I-mode no ELMs L-mode 1.5
0.5 0.6 0.7 0.8 0.9 1.0 1.1 1.2
0.0 0.5 1.0 1.5
< P > (atm)
(a) (b) (c) (d) (e) (f) (g)
FIG. 1: Stationary high confinement I-mode
discharge on Alcator C-Mod (Pulse 1120907028, 5.8 T, 1.1 MA, LSN). Early in the second step of ICRF power (a), core Te (c), pedestal Te (d) and plasma pressure (e),
approximately double, indicating the transition from L-mode to I-L-mode. Density (b) and D emission (g) remain at L-mode levels. Normalized energy confinement HITER98y2 (f) increases from 0.6 to 1.2.
[image:20.612.95.347.123.471.2]Fig 2 Fig 3: 0.9 1.0 0.5 1.0 1.5 T (keV)
Shot: 1120907032, Time: 0.975s − 1.045s
Ion T (CXRS)
Electron T (fit to TS)
I-mode
(a) (b) (c)
T (keV) 1.0 1.4 0.6 0.2 1.6 1.2 0.8 0.4 0 I-mode L-mode
FIG 2. Electron temperature (a) and density (b) profiles for the discharge of Figure 1, in I-mode (red) and L-mode (black) phases. (c) Pedestal Ti in I-mode (red) measured for a
slightly higher density discharge (1140907032) in the same experiment, is equal to Te
(green) within relative alignment uncertainties.
1 2 3 4 5 T T e e (keV) (keV) 0.4 0.6 0.8 20 40 60 80 100 f (kHz)
1.1 1.2 1.3 1.4
t (s) 0 100 200 300 400 f (kHz) 1 101209031
core Te
edge Te
v fluct.θ
density fluct.
I-mode
[image:21.612.98.321.340.532.2]Fig 4.
3.6 3.8 4.0
time [s ]
H98y,2 0.0 0.2 0.4 0.6 0.8 1.0 L-mode I-mode 4.0 0.0 1.0 2.0 3.0 0.0 0.2 0.4 0.6
n ( 1
0 20 m -3) e Te,i (keV ) pe d 0.0 0.2 0.4 0.6 0.8 1.0 T Ti e H 26905 (a) E | core edge
LH, ELM monitor
PNBI Te pe d H98y,2 0.0 0.2 0.4 0.6 0.8 1.0 0.0 0.2 0.4 0.6 0.8 1.0 0.0 0.1 0.2 0.3 0.4 0.5 0.0 1.0 2.0 3.0 core edge PECRH Ploss 25874 E
1.5 2.0 2.5 3.0 3.5 4.0 4.5 time [s]
LH, ELM monitor
(b) L-mode I-mode Te PECRH Ploss ) ( (keV )
n ( 1
0 20 m -3) e | ) (
FIG 4(a). Time traces from an I-mode discharge (26905) on ASDEX Upgrade. In this case the pedestal evolves slowly and there is a transition to H-mode. (b) Example of an I-mode phase which after initial slow evolution continues until the end of the heating, over 20 confinement times (25874). Traces show, from top, heating powers, core and edge density, pedestal temperatures, and normalized confinement H98y2. Other parameters are
[image:22.612.102.516.110.336.2]Fig 5
[image:23.612.100.513.82.288.2]
Fig 6.
(a)
(b)
0.4 0.5 0.6 0.7
0.3
0.2
0.1
20
)
(
)
(
FIG. 5. Pedestal Te and Ti profiles (a) and electron density profiles (b) in the same AUG
discharge as Fig. 4(a). Temperatures in I-mode (red) are higher and steeper than in L-mode (black). Density profiles in I and L-L-mode are very similar, and as usual increase sharply in H-mode (blue).
Time (s)
Frequency (kHz)
100
50
150
200
0
250
[image:23.612.100.413.395.660.2]Fig 7
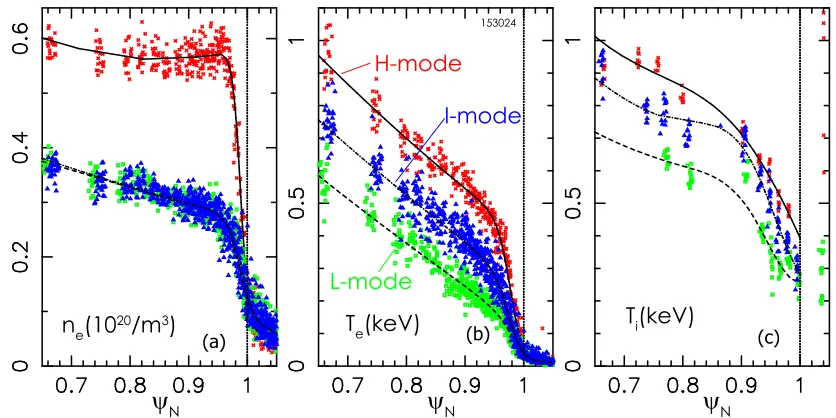
[image:24.612.138.371.86.446.2]Fig 8
Te(keV)
ne(1020/m3)
H-mode
L-mode
I-mode
153024
ψ
Nψ
NTi(keV)
ψ
N(a) (b) (c)
[image:25.612.86.504.138.347.2]Fig 9
FIG. 9(a). Power spectral density measured by Phase Contrast Imaging, for DIII-D discharge 153031. (b) Time dependence of ne fluctuations from Doppler Backscattering
[image:26.612.102.513.107.312.2]Fig 10
ECE Te, r/a=0.95
Dα
BES ρ∼1.0
BES ρ∼0.95
BES ρ∼0.97
Time (ms)
3110.6 3110.8
3110.4
3110.2 3111.0 3111.2 3111.4 3111.6
Outer divertor
FIG. 10. Details of D emission (top), Te fluctuations from Electron Cyclotron Emission
[image:27.612.102.430.103.293.2]Fig 11
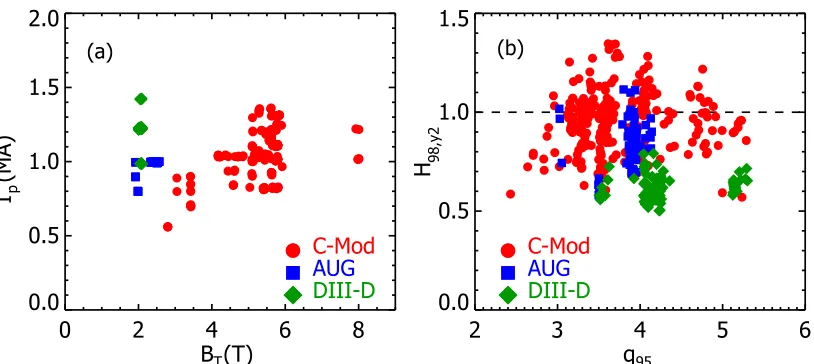
Fig 12
(a)
0 2 4 6 8
BT(T) 0.0
0.5 1.0 1.5 2.0
Ip
(MA)
C-Mod
AUG DIII-D
2 3 4 5 6
q95 0.0
0.5 1.0 1.5
H 98,y2
C-Mod
AUG DIII-D (b)
FIG. 12. Global parameters from a database of C-Mod, AUG and DIII-D I-mode discharges. (a) Plasma current vs toroidal magnetic field (both directions) (b) Normalized energy confinement H98,y2 vs q95.
0 0.01 0.02 0.03 0.04
0 0.05 0.1 0.15
w
EPED1=0.076(
β
PPED)
1/2W
α
20130507, 20130509
H-mode
I-mode
DIII-D
FIG. 11: Width of DIII-D pressure pedestal vs prediction of EPED1 model, using the
measured pedestal pressure, for some recent I-mode and H-mode experiments. H-mode
time slices (red) agree with predictions as expected, while I-modes (blue) are significantly
Fig 13
Fig 14
0.0 0.5 1.0 1.5
n
e,ped (1020m-3) 00.2 0.4 0.6 0.8 1.0 1.2
T
ped(keV)
C-Mod Te
AUG Te0 1 2 3 4
ν
*
ped 0.0000.002 0.004 0.006
ρ
*
pedC-Mod
DIII-D
AUG
DIII-D T
i(a) (b)
DIII-D T
eFIG. 13. Parameters at the electron pedestal top from a database of C-Mod, AUG and DIII-D I-mode discharges. (a) T vs ne at pedestal top. For C-Mod and AUG, only Te is shown; the
solid C-Mod points are from tanh fits to better resolved pedestal profile data. For DIII-D, solid diamonds are from fits to Te pedestals and open diamonds are Ti at the same radial
location, where available. (b) Normalized ion gyroradius * vs *, computed using Te,ped.
(a) (b)
(keV)
1.0
0.5 1.5
0
1.0
0.5 1.5
0
20
)
(
FIG. 14. Pedestal profiles of (a) electron temperature and (b) density in mode for a pair of I-mode discharges on C-Mod and AUG. AUG profiles have been scaled by RC-Mod/RAUG-0.5 for Te
and R-2 for ne. Te pedestal profiles are very similar in height and width, while density is
[image:29.612.93.523.459.619.2]Fig 15
0.0
0.2
0.4
0.6
0
1
2
3
4
P
loss(MW)
ASDEX Upgrade
Average n
e
(10
20m
-3)
(b)
0.0
0.5
1.0
1.5
2.0
2.5
0
1
2
3
4
5
P
loss(MW)
Alcator C-Mod
(a)
(c)
DIII-D
0.0 0.2 0.4 0.6
0 1 2 3 4 5
Ploss
(MW)
Average n
e
(10
20m
-3)
Average n
e
(10
20m
-3)
I-mode
L-I
I-H
L-H
I-mode
I-H
L-I
I-mode
I-H
L-I
FIG. 15. Loss power vs line average ne for I-modes (red circles), L-I transitions (green
Fig 16
Fig 17
q=3-4.3, n>n
min0
20
40
60
S(m
2)
0
2
4
6
8
10
P
L-I/n ~ S
P
L-I/n ~ S
0.7-20
MW m
3)
(10
P
lossn
e
_
C-Mod AUG DIII-DFIG. 16. Size scaling of normalized L-I threshold power P(L-I)/ne vs plasma surface
area S. While there is considerable scatter in this parameter, the scaling with S appears at
most linear and perhaps weaker; the red dotted curve shows S 0.7.
C-Mod I-mode
C-Mod L-I
AUG I-mode
AUG L-I
DIII-D I-mode
DIII-D L-I
0.0
0.2
0.4
0.6
0.8
-20MW m
)
(10
P
lossn
e
S
_
0
2
4
6
B
T
(T)
L-mode
q = 3-4.3, n>n
95 minH-mode
FIG. 17: Normalized power Ploss/neS, vs BT. Solid triangles are L-I transitions, while open
[image:31.612.99.381.435.677.2]References
[1] WHYTE D. G., HUBBARD A. E., HUGHES J.W. et al 2010 Nuclear Fusion50 105005. [2] BEURSKENS M. A. et al 2014 Nucl. Fusion 54 043001.
[3] WALK J.R. et al 2014 Phys. Plasmas 21 056103. [4] LOARTE A. et al 2014 Nucl. Fusion 54 033007. [5] BURRELL K.H. et al 2013 Nucl. Fusion 53 073038.
[6] RYTER F. et al (for the ASDEX Upgrade Team), 2011 38th EPS Conference on Plasma Physics (Strasbourg, June 2011), Europhysics Conference Abstracts 35G, P5.112.
[7] MARINONI A. et al 2015 Nucl. Fusion 55 093019. [8] HUBBARD A. E. et al 2011Phys. Plasmas 18 056115.
[9] HUBBARD A.E. et al, 2012 Proc. 24th Int. Conf. on Fusion Energy (San Diego, 2012) [EX/1-3] http://www-naweb.iaea.org/napc/physics/FEC/FEC2012/index.htm.
[10] THEILER C., CHURCHILL R.M. et al 2014 Nuclear Fusion 54 083017. [11] WALK, J.R., Ph.D. Thesis, Massachusetts Institute of Technology 2014.
[12] ITER Physics Basis Expert Groups on Confinement and Transport and Confinement Modelling and Database, ITER Physics Basis Editors 1999 Nucl. Fusion 39 21751999 Nucl.Fusion 39 2175.
[13] RICE J.E. et al 2015 Nucl. Fusion 55 033014. [14] WHITE A.E. et al 2011 Nuclear Fusion, 51 113005.
[ 15 ] DOMINGUEZ A. Ph.D. Thesis, Physics Department, Massachusetts Institute of Technology (2012).
[16] CZIEGLER I. et al 2013 Phys. Plasmas 20 055904. [17] WHITE A.E. et al 2014 Nucl. Fusion 54 083019.
[18] WHITE A. E., HOWARD N. T., CREELY A. J. et al 2015 Phys. Plasmas 22, 056109. [19] VIEZZER E. et al 2013 Nucl. Fusion 53 053005.
[20] HAPPEL T. et al “Turbulence intermittency in the confinement region of I-mode plasmas in the ASDEX Upgrade tokamak”. Nucl. Fusion, in press.
[21] DA GRACA S. et al 2007 Plasma Phys. Control. Fusion 49 1849–1872.
[24] WILSON H. R., SNYDER P. B., HUYSMAN, G. T. A. and MILLER R. L. 2002 Phys. Plasmas 9, 1277.
[25] SNYDER P. et al 2011 Nucl. Fusion 51 103016.
[26] OYAMA N. et al 2006 Plasma Physics and Controlled Fusion 48, 5A, A171. [27] CONNOR J.W. 1988 Plasma Phys. Control. Fusion 30 619.
[28] LUCE, T.C. et al 2008 Plasma Phys. Control. Fusion 50 043001. [29] PETTY C.C. et al 2008 Physics of Plasmas 15, 080501.
[30] SUTTROP W. et al. Fusion Energy 2002 (Proc. 19th Int. Conf. Lyon, 2002) (Vienna: IAEA) CD-ROM file and
http://www.iaea.org/programmes/ripc/physics/fec2002/html/fec2002.htm Vol. IAEA-CSP-19/CD (2003), IAEA-CN-94/EX/P5-07.
[31] RATHGEBER S. K. et al 2013 Plasma Phys. Control. Fusion 55 025004.
[32] MOSSESSIAN D. et al 2003 Phys. Plasmas 10 1720. [33] MADDISON G.P. et al 2009 Nucl. Fusion 49 125004. [34] HUBBARD A.E. et al 2012 Nucl. Fusion 52 114009. [35] GOHIL P. et al 2008 J. Physics: Conf Series. 123 012017.
[36] MARTIN,Y., TAKIZUKA T. et al, 2008 J. Physics: Conf Series. 123 012033. [37] LABOMBARD, B. et al 2015 Nucl. Fusion 55 053020.