TABLE OF CONTENTS: VOL. 55, NO. 2, March 2002
FEATURE ARTICLE
106 Perspectives on water flow and the interpretation of FLIR images by S.L.
Larson, L.L. Larson, and P.A. Larson Economics
112 Cull cow management and its implications for cow-calf profitability by Randall D. Little, Allen R. Williams, R. Curt Lacy, and Charlie S. Forrest 117 Elk management strategies and profitability of beef cattle ranches by
Wendy L. F. Torstenson, Michael W. Tess, and James E. Knight Grazing Management
127 Evaluating the ecological relevance of habitat maps for wild herbivores by Marc E. Stalmans, Ed T.F. Witkowski, and Kevin Balkwill
135 Intensive-early stocking for yearling cattle in the Northern Great Plains by E.E. Grings, R.K. Heitschmidt, R.E. Short, and M.R. Haferkamp
Plant/Animal
139 Nutritional value and intake of prickly pear by goats by Zeno McMillan, Cody B. Scott, Charles A. Taylor, Jr., and J. Ed Huston
144 Day and night grazing by cattle in the Sahel by Augustine A. Ayantunde, Salvador Fernandez-Rivera, Pierre H. Hiernaux, Herman Van Keulen, and Henk M.J. Udo
Plant Ecology
150 Bud viability in perennial grasses: Water stress and defoliation effects by Andrea C. Flemmer, Carlos A. Busso, and Osvaldo A. Fernandez
164 Northern dry mixed prairie responses to summer wildlife and drought by Catherine Erichsen-Arychuk, Edward W. Bork, and Arthur W. Bailey
171 Vegetation responses following wildfire on grazed and ungrazed sagebrush semi-desert by Neil E. West and Terence P. Yorks
Published bimonthly-January, March, May, July, September, November
Copyright 2002 by the Society for Range Management
INDIVIDUAL SUBSCRIPTION is by membership in the Society for Range Management.
LIBRARY or other INSTITUTIONAL SUBSCRIP- TIONS on a calendar year basis are $95.00 for the United States postpaid and $112.00 for other coun- tries, postpaid. Payment from outside the United States should be remitted in US dollars by interna- tional money order or draft on a New York bank.
BUSINESS CORRESPONDENCE, concerning subscriptions, advertising, reprints, back issues, and related matters, should be addressed to the Managing Editor, 445 Union Blvd., Suite 230, Lakewood, Colorado 80228.
EDITORIAL CORRESPONDENCE, concerning manuscripts or other editorial matters, should be addressed to the Editor, Gary Frasier, 7820 Stag Hollow Road, Loveland, Colorado 80538. Page proofs should be returned to the Production Editor, 3059A Hwy 92, Hotchkiss, CO 81419-9548..
INSTRUCTIONS FOR AUTHORS appear on the inside back cover of most issues. THE JOURNAL OF RANGE MANAGEMENT (ISSN 0022-409X) is published bimonthly for $56.00 per year by the Society for Range Management, 445 Union Blvd., Ste 230, Lakewood, Colorado 80228. PERIODICALS POSTAGE paid at Denver, Colorado and additional offices.
POSTMASTER: Return entire journal with address change-Address Service Requested to Society for Range Management, 445 Union Blvd., Suite 230, Lakewood, Colorado 80228.
PRINTED IN USA Editor-In-Chief SAM ALBRECHT
445 Union Blvd., Ste 230 Lakewood, Colorado 80228
(303) 986-3309 Fax: (303) 986-3892 e-mail address:
[email protected] Editor/Copy Editor
GARY FRASIER/JO FRASIER 7820 Stag Hollow Road Loveland, Colorado 80538 e-mail address:
[email protected] Production Editor
PATTY RICH
Society for Range Management 3059A Hwy 92
Hotchkiss, Colorado 81419-9548 e-mail address:
[email protected] Book Review Editor DAVID L. SCARNECCHIA
Dept of Natural Res. Sci.
Washington State University Pullman, Washington 99164-6410 e-mail address:
scarneda @ mail.wsu.edu Electronic JRM Editor M. KEITH OWENS
Texas A&M University Research Center 1619 Garner Field Road Ulvade, Texas
e-mail address:
Plant Physiology
182 Seasonal dynamics of prairie sandreed rizhome development by Patrick E.
Reece, Jennifer S. Nixon, Lowell E. Moser, and Steven S. Waller Reclamation
188 Seed longevity and seeding strategies affect sagebrush revegetation by D.
Terrance Booth Improvements
194 Herbicide residues and perennial grass on establishment perennial pepperweed sites by James A. Young, Charlie D. Clements, and Robert R. Blank
Plant Ecology
197 Drought and grazing: IV. Blue grama and western wheatgrass by E.J. Eneboe, B.F. Sowell, R.K. Heitschmidt, M.G. Karl, and M.R. Haferkamp
Book Reviews
204 Toxic Plants of North America by George E. Burrows and Ronald J. Tyrl; Africa's Elephant: A Biography by Martin Meredith; Millions of Monarchs, Bunches of Beetles: How Bugs Find Strength in Numbers by Gilbert Waldbauer.
Associate Editors YUGUANG BAI
Dept. Plant Sciences University of Saskatchewan
51 Campus Drive Saskatoon, Saskatchewan S7N 5A8
CANADA
KLAAS BROERSMA
Agriculture and Agri-Food Canada 3015 Ord Rd.
Kamloops, British Columbia V2B 8A9 CANADA
JOE E. BRUMMER Mt. Meadows Res.
P.O. Box 598
Ctr.
Gunnison, Colorado 81230
DAVID ELDRIDGE
Dept. Land and Water Conservation School of Geography
University of New South Wales Sydney, New South Wales 2052 AUSTRALIA
ROBERT GILLEN USDA-ARS
Southern Plains Range Res. Sta.
200018th Street
Woodward, Oklahoma 73801
ELAINE E. GRINGS USDA-ARS Fort Keogh-LARRL Route 1, Box 2021 Miles City, Montana 59301
MARSHALL HAFERKAMP USDA-ARS
Fort Keogh-LARRL Route 1, Box 2021 Miles City, Montana 59301 ROBERT A. MASTERS Dow AgroSciences LLC 3618 South 75th Street Lincoln, Nebraska 68506
MITCHEL McCLARAN University of Arizona 301 Biological Science East Tucson, Arizona 85721-0001
ROBERT PEARCE 5028 Highway 6 Bishop, California 93514
MICHAEL H. RALPHS USDA-ARS
Poisonous Plant Lab 1150 E 1400 N
Logan, Utah 84341-2881
LARRY REDMON TAREC P.O. Drawer E Overton, Texas 74684
NEIL RIMBEY University of Idaho 16952 S. 10th Ave.
Caldwell, Idaho 83607 CAROLYN HULL SIEG
S.W. Science Complex 2500 South Pine Knoll Flagstaff, Arizona 86001
STEVE WARREN
Colorado State University Center for Environmental Management of Military Land Dept. of Forestry Sciences Fort Collins, Colorado 80523
J. Range Manage.
55:197-203 March 2002
Drought and grazing: IV. Blue grams and western wheatg rass
E.J. ENEBOE, B.F. SOWELL, R.K. HEITSCHMIDT, M.G. KARL, AND M.R. HAFERKAMP
Authors are former graduate student and Associate Professor, Dept. of Animal and Range Sci. Mont. State Univ., Bozeman, Mont. 59715; Supervisory Rangeland Scientist, former Postdoctoral Rangeland Scientist, and Rangeland Scientist USDA-ARS, Fort Keogh Livestock and Range Research Laboratory, 243 Fort Keogh Rd., Miles City, Mont. 59301.
Abstract
An understanding of the impacts of grazing during and follow- ing drought on rangeland ecosystems is critical for developing effective drought management strategies. This study was designed to examine the effects of drought and grazing on blue grama [Bouteloua gracilis (H.B.K) Lag. ex Griffiths] and western wheatgrass [Pascopyrum smithii Rydb. (Love)] tiller growth dynamics. Research was conducted from 1993 to 1996 at the Fort Keogh Livestock and Range Research Laboratory located near Miles City, Mont. An automated rainout shelter was used during 1994 to impose a severe late spring to early fall (May to October) drought on 6 of twelve, 5- x 10-m non-weighing lysimeters. Twice replicated grazing treatments were: 1) grazed both the year of (1994) and the year after (1995) drought; 2) grazed the year of and rested the year after drought; and 3) no grazing either year.
Drought had minimal impact on tiller relative growth rates of plants grazed twice, although it reduced (P <_ 0.01) rates of axil- lary tiller emergence for blue grama (79%) and western wheat- grass (91%). Defoliation periodically increased relative growth rates (P <_ 0.05) and tiller emergence (P <_ 0.01) of both species.
Neither drought nor grazing affected tiller densities or tiller replacement rates of either species nor did they affect productivi- ty of blue grama. Drought, however, reduced (P <_ 0.01) produc- tivity of western wheatgrass 50% in 1994 whereas grazing reduced productivity (P <_ 0.01) by 46% in 1994 and 69% in 1995. Moderate stocking levels (40-50% utilization) during and after drought did not adversely affect the sustainability of these dominant native grasses.
Key Words: Bouteloua gracilis, Pascopyrum smithii, production, rainout shelter, rest, water potential
The Northern Great Plains support 7 million animal units (AUs) in the U.S. and Canada (USDA 1993, Willms and Jefferson 1993).
Campbell (1936) stated that 2 or 3 years out of 10 would be drought years in the Northern Great Plains. Drought and grazing can affect plant productivity and decrease plant longevity (Ludlow 1986). Large portions of plant communities within the Northern Great Plains are dominated by blue grama (Bouteloua gracilis,
This research was conducted under a cooperative agreement between USDA-ARS and the Montana Agric. Exp. Sta. Mention of a proprietary product does not constitute a guar- antee or warranty of the product by USDA, Montana Agric. Exp. Sta., or the authors and does not imply its approval to the exclusion of other products that may also be suitable.
USDA-Agricultural Research Service, Northern Plains Area, is an equal opportunity/affir- mative action employer and all agency_ services are available without discrimination.
Manuscript accepted 26 Mar. 01.
Resumen
Un entendimiento de los impactos del apacentamiento durante y despues de la sequia en los ecosistemas de pastizal es critico para desarrollar estrategias efectivas de manejo de la sequia.
Este estudio se diseno para examinar los efectos de la sequia y el apacentamiento en al dinamica de crecimiento de los hijuelos de
"Blue grama" [Bouteloua gracilis (H.B.K) Lag. ex Griffiths] y
"Western wheatgrass" [Pascopyrum smithii Rydb. (Love)]. La investigacion se condujo de 1993 a 1996 en el Laboratorio de Investigacion de Ganado y Pastizales Fort Keogh cerca de Miles City, Mont. Durante 1994 se utilizo un protector de lluvia autom- atizado para aplicar una sequia severa de fines de primavera e inicios de otono (Mayo a Octubre) en 6 de los 121isimetros de 5 x 10 m. Los tratamiento de apacentamiento se repitieron 2 veces y fueron:l) apacentado en el ano de la sequia (1994) y el ano sigu- iente (1995), 2) apacentado el ano de la sequia y descansado el ano siguiente y 3) sin apacentamiento en ambos anos. La sequia tuvo un impacto minimo en las tasas relativas de crecimiento de los hijuelos de plantas apacentadas doble, aunque redujo (P <_
0.01) las tasas de emergencia de hijuelos auxiliares del "Blue grama" (79%) y "Western wheatgrass" (91%). La defoliacion periodica incremento las tasas relativas de crecimiento (P <_ 0.05) y la emergencia de hijuelos (P < 0.01) de ambas especies. Ni la sequia ni el apacentamiento afectaron las densidades de hijuelos o las tasas de remplazo de estos en ninguna de las especies, tam- poco afectaron la productividad del "Blue grama". Sin embargo, la sequia redujo la productividad (P <_ 0.01) de "Western wheat- grass", en 50% en 1994, mientras que el apacentamiento redujo la productividad (P <_ 0.01) en 46% en 1994 y 69% en 1995.
Niveles moderados de carga (40-50% de utilization) durante y despues de la sequia no afectan adversamente la sustentabilidad de estos zacates nativos dominantes.
[H.B.K] Lag. ex Griffiths) and western wheatgrass (Pascopyrum smithii, Rydb.). It is apparent that these 2 plant species have evolved with the combined effects of drought and herbivory.
Therefore, it is important when managing rangelands to know how individual plants persist in the face of these stressors.
Many researchers have examined the role of tillers in plant sur- vival (Richards et al. 1987, Olson and Richards 1988, Bullock et al. 1994, Zhang and Romo 1995), but quantitative studies on the impacts of grazing during and after drought on tiller population dynamics are lacking. It has been hypothesized that grazing dur- ing and following drought can suppress recovery rates of individ- ual plants as well as plant communities (Pieper and Heitschmidt
JOURNAL OF RANGE MANAGEMENT 55(2) March 197
1988, Burkhardt 1996). To test this hypothesis, we examined the effects of grazing during and after a growing season drought on xylem water potentials, tiller relative growth rates (RGR), seasonal axil- lary tiller emergence, annual tiller replace- ment, tiller densities, and aboveground net primary production (ANPP) of blue grama and western wheatgrass. Heitschmidt et al.
(1999) have published effects of drought on soil water, vegetative productivity and plant species composition.
Materials and Methods
Study Area
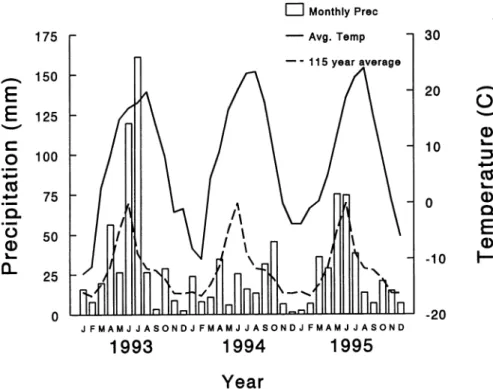
This study was part of a large rainout shelter project conducted on the USDA, ARS Fort Keogh Livestock and Range Research Laboratory near Miles City, Mont. (46°19'45'N 105°49'45'W). This area is representative of the semi-arid mixed grass prairie of the Northern Great Plains. Native vegetation on the 22,500-ha research station is a grama-needlegrass- wheatgrass (Bouteloua-Stipa-Agropyron) mix (Ki chler 1964). Long-term annual precipitation averages 34-cm (NOAA 1996) with about 60-70% received during the mid-April through mid-September growing season (Fig 1). Temperatures may exceed 38°C during summer and decrease to -40°C during winter. The average frost-free period is 150 days.
The experiment was conducted from
1993 to 1996 on native rangeland that had not been grazed 2 years prior to the study.
Precipitation was 30% (530 mm) above average (NOAA 1996) the year before the study. The study site was located on a gen- tly sloping (4%), clayey range site in high fair range condition. The soils were very deep, well-drained, fine, montmorillonitic, frigid Aridic Ustochrepts. Vegetation at the site was dominated by blue grama (40-45% by weight) and western wheat- grass (30-35% by weight).
Lysimeters and Treatments
Twelve, 5- X 10-m non-weighing
lysimeters were arranged perpendicularly to the slope along a 65-m transect in 2 groups of 6 lysimeters with a 5-m area between groups within a grazing exclo- sure. An automated rainout shelter was constructed to control the amount of pre- cipitation received on 1 of the 2 sets of 6 lysimeters. The 12- X 35-m metal framed
"roof" was mounted on 15-cm diameter plastic wheels atop seven, 5-cm wide rails stationed about 75-cm above the soil sur- face. Rails extended from the top edge
20
15
10
5
0 J M M J S NJ M M J S NJ M M J S N J M M J S N
1993 1994 1995 1996
Fig. 1. Monthly precipitation (cm) from January 1993 through December 1996 and long-term (115 yr) average at Miles City, Mont. including the drought treatment in 1994 (NOAA 1996;
Heitschmidt et a1.1999).
(i.e., upslope) to 15-m below the bottom edge of the lysimeters. Rails were located directly over lysimeter borders. The shel- ter was equipped with a moisture sensitive conductance plate that when wetted, acti- vated a small electric motor and its associ- ated drive system, which moved the shel- ter across the lysimeters.
Following the 1993 pre-treatment base- line year, twice replicated treatments
were: 1) grazed during the year of drought and rested the year after, hereafter referred to as G94; 2) grazed both the year of the simulated drought and the year after, here- after referred to as the G94-95; and 3) rested in all years, hereafter referred to as the ungrazed treatment (UG). The same 3
treatments were repeated in the non- drought set of lysimeters. Lysimeters were grazed intensively with 6 ewes and their twin lambs for a few hours in early June and early July of both 1994 and 1995 to achieve 40-50% utilization. The simulated drought was imposed (1 growing season) from mid-May to early October 1994.
Precipitation, Soil Water, and Xylem Water Potentials
Precipitation was monitored on site using standard rain gauges (Heitschmidt et al. 1999). Soil water was estimated a mini- mum of once a month from April through October at depths of 15-, 30-, 60-, 90- and 120-cm using a dielectric soil water probe (Heitschmidt et al. 1999).
Xylem water potentials of blue grama and western wheatgrass plants growing in the ungrazed drought and non-drought treatments were estimated on 7 dates between 18 May and 28 July, 1994 and 6
dates between 15 May and 2 August,
1995. Measurements were made at 0430 and 1230 hours on the youngest fully expanded leaves of individual plants using standard pressure chamber techniques (Scholander et al. 1965). Sample plants were randomly selected along a transect within each lysimeter. Sample size per species/sample date/sample timellysimeter was 1 in 1994 and 2 in 1995.
Tiller and Production Measurements Six permanent 14- X 18-cm quadrats per lysimeter were randomly established with- in mixed blue grama and western wheat- grass communities. Quadrat locations were restricted to areas not previously sampled, and at least 50-cm inside the plot edge. Colored wire rings were used to per- manently identify 10 study tillers per quadrat, 5 each of blue grama and western wheatgrass. The same quadrats were used for the duration of the research. If a marked tiller produced axillary tillers at anytime during the growing season, the axillary tillers were marked with a differ- ent color to distinguish them from primary tillers. Different tillers were marked in the same manner in 1995.
From an initial population of 360 tillers per species, repeated, season-long measure- ments (n = 17 in 1994; n = 14 in 1995) were taken on 270 blue grama and 329 western wheatgrass tillers in 1994 and 320 blue grama and 341 western wheatgrass tillers in 1995. Differences between marked and measured tillers were due to lost mark- ers or excluding data from tillers which were not grazed twice. Tiller measurements began in mid-May and continued weekly through August with additional measure- ments for quantification of any autumn
198 JOURNAL OF RANGE MANAGEMENT 55(2) March 2002
growth. Information gathered on an indi- vidual tiller during each visit included:
plant height, phenology, number of leaves, axillary tillering and tiller senescence.
Measuring tillers nondestructively pre- vented direct estimates of cumulative bio- mass through time. Height measurements were converted to biomass by developing height-weight relationships of tillers locat- ed on the same clayey range site in the near vicinity of the lysimeters. For each species, tillers were measured, clipped at the soil surface and bundled together with other tillers of the same height (+l-1 cm).
Five bundles per species representing the range of heights for those tillers found in the lysimeters were collected before each grazing event. Individual bundles contain- ing 5 western wheatgrass and 10 blue grama tillers were placed in plastic bags, transported to the laboratory and immedi- ately cut into segments. Tiller bundles were cut from the base upward in seg- ments of 1-cm for blue grama and 3-cm for western wheatgrass in a manner simi- lar to Tusler (1993), so all height ranges of plants found in the lysimeters were repre- sented. All segments were oven dried at 60°C for 48 hours before weighing.
Tiller relative growth rates (g g' day-`) were calculated according to Radford (1967) as:
Tiller relative growth rates =
(loge Wt+1- loge Wt) * I-' (1) where W was tiller weight (g), t was initial time, and I was time increment in days.
Density of western wheatgrass was determined by counting total number of live tillers within each quadrat. Because of the "mat-like" growth form of blue grama, density was determined by counting the number of tillers within a 5.75-cm2 circu- lar plot, or 2% of the quadrat area, ran- domly located within each permanent quadrat. Densities were measured on 24 May 1994, 1995, and 1996.
Standing crop inside 20 randomly locat- ed 250-cm2 quadrats per lysimeter was harvested monthly by species from 1993 to 1996 (Heitschmidt et al. 1999). Samples were oven dried at 60°C, separated into live and dead components and then weighed. Aboveground net primary pro- duction was calculated for blue grama and western wheatgrass by summing all posi- tive increases in standing crop from April to November.
Data Summarization and Analyses Soil water measurements were analyzed using repeated measures analysis of vari- ance (AOV) with year, depth, treatments
and dates in the model. Years and/or dates and all associated 2- and 3-way interac- tions were analyzed as within plot repeat- ed measures and tested using full model residuals (Heitschmidt et al. 1999).
Pre-dawn and mid-day water potential data were analyzed separately using repeated measures AOV with drought treatment, plant species, and date as main effects. The error terms for testing the main effects of drought treatments were the replication by treatment interaction.
The error terms for testing the main effects of species and the interaction effects of species and drought treatments were repli- cation by treatment by species. The full model residuals were used to test the repeated measures effects of dates and all associate 2- and 3-way interaction effects.
Growth records were summarized using average tiller relative growth rate within 3
time periods. Time periods were: 1) the last 2 weeks of May before the first graz- ing event; 2) the entire month of June between the first and second grazing event; and 3) July to October of 1994 and July to early September 1995. The number of 1994 post-grazing sampling dates was 8, but this was reduced to 4 in 1995, as
both species were essentially dormant throughout both summer periods.
A univariate, repeated measures analysis of variance model was used to analyze tiller relative growth rate data. A 2-way AOV was used to determine the effects of drought and grazing on percent tiller recruitment. Tiller relative growth rates and tiller recruitment are reported for tillers that were grazed twice, since the majority (> 85%) of the tillers in the lysimeters were grazed during both graz- ing events. This was done to reduce con- founding effects of combining once grazed and twice grazed tillers.
Tiller densities from May 1994 (i.e., pre-treatment) were included as a covari- ate in the 2 following years' data. Means were considered to be significantly differ- ent when P < 0.05, unless noted otherwise.
Individual lysimeters were considered experimental units for all analyses.
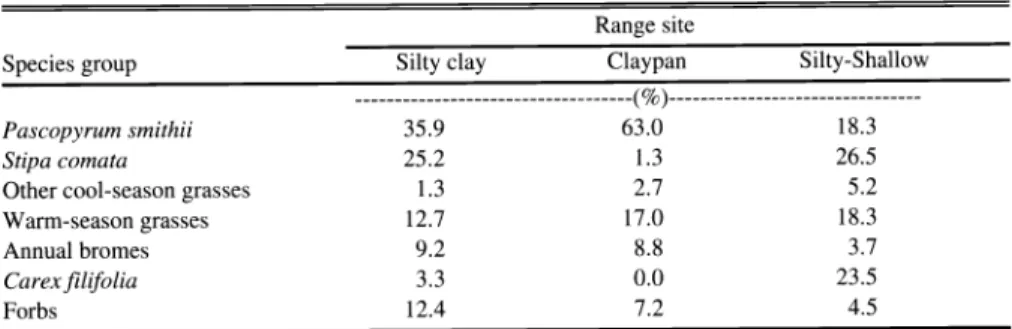
Heitschmidt et al. (1999) reported plant functional group and species composition- al differences among treatment plots in 1993. We initially used the pre-treatment year (1993) blue grama and western wheatgrass productivity estimates as covariates in subsequent year analyses.
Since the covariates were never significant
(P >_ 0.22), they were subsequently exclud-
ed from the final analyses.
Drought treatments might be considered pseudo-replicated, according to Huribert
(1984), since the rainout shelter size and cost precluded classical treatment replica- tion. The use of a single rainout shelter to test the effects of drought is common in the literature (Busso 1988, Busso et al.
1989, 1990, Frank and Ries 1990, NeSmith and Ritchie 1992, Busso and Richards 1993, 1995). Statistical tests used in our study were conservative, since the experimental units were not quadrats, indi- vidual plants or individual tillers. In addi- tion, analyses were conducted in a manner similar to the first paper in this series (Heitschmidt et al. 1999).
Results
Precipitation, Soil Water, and Water Stress
In 1993, the pre-treatment year, total annual precipitation was 38% above the long-term average of 34-cm (Fig. 1).
Annual precipitation in 1994 was 24.7-cm, 24% below average. Precipitation from 1 May to 31 October 1994 was 16.3 cm compared to the 27.1-cm average. Total annual precipitation for 1995 and 1996 was similar to the long-term average
(Heitschmidt et al. 1999).
Heitschmidt et al. (1999) previously reported no differences in soil water dynamics between imposed 1994 drought and natural precipitation and grazing treat- ment lysimeters. The only significant main effects were year and date.
The drought treatment did not affect either pre-dawn or mid-day leaf water potential of either blue grama (P = 0.93) or western wheatgrass (P = 0.40; Table 1).
Water potentials were affected by plant species (midday; P < 0.01), date (P <_ 0.01) and their interaction (P 0.01). Date was the most important factor accounting for 85% of the total sum of squares for predawn and 58% for midday water poten- tials. Species accounted for less than 5%
of the total sum of squares. The date effect followed anticipated seasonal trends of increasing water potentials with decreas- ing soil water content. The absence of sig- nificant drought treatment-by-date (P >
0.18) and drought treatment-by-date-by- species (P > 0.86) interactions showed that the magnitude of water stress was similar in both the drought and non-drought treat- ment plots during 1994 (i.e., the year of the imposed drought) as well as 1995.
Utilization
Ninety-eight percent of marked blue grama tillers (265 of 270) in 1994, and 97% (309 of 320) in 1995 remained in a
JOURNAL OF RANGE MANAGEMENT 55(2) March 199
Table 1. Predawn and midday leaf water potentials (MPa) for western wheatgrass (Pasm) and blue grama (Bogr) plants growing in drought and nondroughtl lysimeters at Fort Keogh in 1994 and 1995.
Pre-dawn2 Mid-day2
Year Date Pasm
---(MPa) ---
1994 18 May -0.324
31 Mayy3 -0.244 -0.314
14 Jun -0.44cd -0.204
23 Jun3 -0.75cd -1.39c
30 Jun -4.18a -4.04b
13 Jul4 -104bc -492a 4 OOa 28a
28 Ju1 3 .46a -S.OOa
1995 15 May -0.43cd
2 Jun -0.99bc -0.594
16 Jun -0.5lcd -0.314
30 Jun3 -0.46cd -0.504
17 Jul -1.42b -1.42c
2 Aug -3.88a -4.25b
exposed to the imposed 1994 drought than for non-drought plants, but rates were sim- ilar (P >_ 0.30) thereafter (Fig. 2). Relative growth rates in the ungrazed treatment during May 1995 were 19% greater (P = 0.02) than in either grazing treatment.
However, following the first grazing event of 1995 (i.e., June), relative growth rates were greater (P = 0.02) in the G94-95 treatment than the ungrazed control and greater (P = 0.003) than the G94 treat- ment. Relative growth rates from July through August were not different (P >_
0.10) from zero (Fig. 2).
Relative growth rates of marked western wheatgrass tillers grazed twice, were unaf- fected by drought in 1994 (P = 0.61).
Relative growth rates were greater (P 0.01) in the 2 grazed treatments (G94 and G94-95) compared to the ungrazed treat- ment (0.007 vs. 0.002 g' day') in June, and declined from July to October (Fig. 3).
ZThere were no significant (P >_ 0.10) differences in drought versus nondrought treatments. 0.01) recruitment 315 % compared to
Means within columns with different letters are significantly different at P S 0.05.
3 Significant treatments. Sixty percent of
4Significant (P <_ 0.05) mid-day species effects.
Significant (P <_ 0.05) predawn species effects. daughter tillers were produced after the
vegetative phenological stage. On average, utilization was 39% and 47% on blue grama tillers for the first and second graz- ing events in 1994, and 23% and 45% for the first and second grazing events in 1995. Over 85% of the marked blue grama tillers in the grazed lysimeters were grazed twice in both years.
Ninety-eight percent (323 of 329) in 1994 and 94% (322 of 341) in 1995 of marked western wheatgrass tillers remained in a vegetative phenological stage during the growing seasons. On average, utilization was 49% and 51% for the first and second grazing events in 1994 and 53% and 46% for the first and second grazing events in 1995. Over 90% of marked western wheatgrass tillers were
grazed twice in 1994 and 1995.
were 18% greater (P = 0.01) for plants
first grazing event. Of those producing axillary tillers, none in the drought treat- ment produced more than 1 axillary tiller.
Eighteen percent in the non-drought treat- ment produced 2 secondary tillers.
In 1995, the magnitude of recruitment by blue grama was similar (P = 0.16) between drought and non-drought treat- ments (Table 2). Tiller recruitment for combined grazing treatments was 78%
greater (P <_ 0.01) than without grazing.
Ninety-eight percent of the tiller recruit- ment occurred after the first grazing event.
On average, 30% of the blue grama tillers producing axillary tillers produced 2 sec- ondary tillers. It appeared that the seasonal pattern of axillary tillering by blue grama
was similar in 1994 and 1995.
Recruitment by western wheatgrass tillers grazed twice also varied in magni- tude between the 1994 drought and graz- ing treatments (Table 2). Drought reduced
(P <_ 0.01) recruitment 91% (Table 2).
Grazed tillers exhibited greater (P = 0.04) Tiller Relative Growth Rates
Analyses of relative growth rates of twice-grazed blue grama tillers revealed significant (P <_ 0.01) treatment-by-time interactions (Fig. 2). Relative growth rates were reduced (P = 0.01) 29% by drought before grazing treatments were imposed (i.e., May) but not different (P >_ 0.30) from June through October in 1994 (Fig.
2). Growth rates of defoliated tillers were 107% greater (P <_ 0.01) than undefoliated tillers after the first grazing event (i.e., June), but similar (P = 0.08) thereafter and not different (P >_ 0.10) from zero from July through October (Fig. 2).
The year following the imposed drought (i.e., 1995), the blue grama time-by- drought (P = 0.02) and time-by-grazing treatment interactions were significant (P 0.01). In May, relative regrowth rates
Tiller relative growth rates were not dif- ferent (P > 0.15) from zero from July through October (Fig. 3).
Results were similar for western wheat- grass in 1995 in that relative growth rates were unaffected by drought treatment (P =
0.69), were greater (P <_ 0.01) in the grazed (G94-95) than the 2 ungrazed (G94 and ungrazed) treatments in June, and declined through the season (Fig. 3).
Tiller Recruitment
The percent of primary blue grama tillers which produced an axillary tiller, varied during the 1994 growing season in response to drought and grazing (Table 2).
Drought reduced (P <_ 0.01) total recruit- ment 80%, whereas grazing increased (P <_
Table 2. Least square means (%), SE and P-values proportions of marked primary tillers that produced at least 1 axillary tiller during the growing season for blue grama and western wheat.
grass subjected to drought and grazing treatments.
Year
Drought Treatments)
D ND SE P
Grazing Treatments
G94 G94-95 UG SE P D*G3
BlueGrama4 ---(%)---
1994 8a 40b 3 < 0.01
1995 39 49 4 0.16
Western Wheatgrass4
1994 7a 79b 3 < 0.01
1995 6 11 3 0.18
---(%)--- 31 a 32a l Ob
47a 60a 30b 5
47a 46a 35b 3
5 15 6 3
ID =Drought, ND = Non Drought.
3G94 = Grazed in 1994, G94-95 = Grazed in 1994 and 1995, UG = Ungrazed.
DIG = Drought by grazing interaction P-value.
4Drought or grazing treatment means in the same year (row), with different letters are significantly different at P S 0.05.
200 JOURNAL OF RANGE MANAGEMENT 55(2) March 2002