Teacher Workload
Survey 2016
Research brief
February 2017
John Higton, Sarah Leonardi, Neil Richards and Arifa
Choudhoury, CFE Research
The Teacher Workload Survey
Background
The Workload Challenge undertaken by the Department for Education from 22 October to 21 November 2014 asked teachers to share their experiences, ideas and solutions on how to tackle unnecessary and unproductive workload. In response, the Government set out a programme of action to address unnecessary workload (DfE, 2015). One of these actions was a commitment to undertake a large scale and robust survey of teacher workload in English schools in the spring term every two years. This report describes the findings of the first, baseline study in this series, which was designed to survey teachers in a large sample of schools, and yield data comparable (as far as possible) with the Organisation for Economic Co-operation and Development’s
(OECD’s) Teaching and Learning International Survey (TALIS) subset of questions relating to working time and attitudes to workload.
Survey method
An online survey was disseminated to a sample of schools across England. A sampling method of randomly selecting schools based on probability proportionate to size (PPS) was used (see Section 1.7 of the main report and Annex 2 of the accompanying technical report for more detail). In total 900 schools were selected and approached. One selected school had closed giving a final survey sample of 899. Of these schools, 245 agreed to take part in the survey and distributed the survey link to all teachers representing a total of 10,410 teachers. At least one completed survey was received from 218 of these schools and, in total, 3,186 teachers completed the survey. This represents a 34% response rate at the teacher level. Overall, the majority of characteristics (including demographic and school characteristics) for teachers responding to the survey were similar to the average for the overall teaching population as described by the School Workforce Census1 (see Section 2.1 of the main report / Annex 2 in the technical report for more detail). To
address any differences, the data has been weighted to reflect the national population of teachers from the School Workforce Census.
1 The DfE microsite for the school workforce census is:
https://www.gov.uk/government/collections/statistics-school-workforce
Comparing the Teacher Workload Survey and TALIS
2Whilst the Teacher Workload Survey was designed to be as comparable as possible to TALIS, there are some methodological differences that need to be taken into account. These key differences are:
• The Teacher Workload Survey collected data from primary and secondary schools, whilst England participated in the TALIS 2013 survey of Key Stage 3 secondary school teachers and headteachers only. Comparisons in this report are therefore restricted to secondary schools only; and,
• The Teacher Workload Survey collected information from classroom teachers and, teachers who self-identified themselves as middle leaders or senior leaders, whilst TALIS collects data from teachers and headteachers, and does not distinguish or identify middle leaders. In order to provide the most robust comparison possible, data from secondary school classroom teachers and middle leaders in the Teacher Workload Survey were combined and compared with teachers, but not headteachers, in the TALIS 2013 survey.
Key findings
Working hours
• The average total, self-reported working hours in the reference week3 for all classroom
teachers and middle leaders was 54.4 hours. As per prior workload studies, primary classroom teachers and middle leaders self-reported higher total working hours (a mean of 55.5 hours) than teachers in secondary schools (53.5 hours)4.
• Secondary school senior leaders reported longer total working hours than those in primary schools (62.1 hours compared to 59.8). Across all schools, senior leaders reported an average total of 60.0 hours in the reference week.
• Almost a third of part-time teachers reported that 40% of their total hours were worked outside of school hours (i.e. in the evening, early mornings and weekends) in the reference period, compared to almost a quarter of full-time teachers.
• Primary teachers with less than six years’ experience reported working a total of 18.8 hours per week outside of school hours. This was two hours more than their more
2 Further details on TALIS 2013 can be found in the main report.
3 The full working week including the weekend prior to the interview. Fieldwork took place 1-21 March
2016.
4 For definition of primary and secondary schools, see Phase definition in the Glossary of the main report.
experienced primary colleagues, and an hour and a half more than secondary teachers with the same level of experience.
• Further analysis showed that teacher-level factors, including perceptions of performance evaluation by management and school-level factors such as phase and the size of the school, had an impact on the total number of hours reported by teachers in the reference week. The largest source of variation in workload was attributable to factors which acted on individual teachers (for example, their level of experience or how their performance is evaluated) rather than those that impacted on the school. The implication is that effective interventions to reduce workload would need to target teachers across the population of schools.
Working hours: Comparisons with TALIS
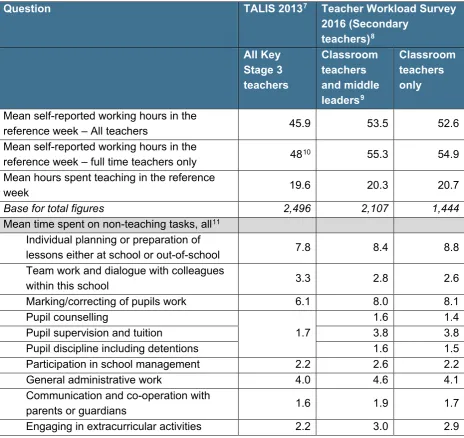
• When comparing figures with teachers who taught Key Stage 3 in TALIS 2013, Table E1 below shows that the mean self-reported working hours in the reference week was 45.9 in TALIS, compared to 53.5 for secondary school classroom teachers and middle leaders in the current research5.
• The self-reported mean time spent on most non-teaching tasks was higher in the Teacher Workload Survey 2016 compared to TALIS 2013. For example, Key Stage 3 teachers in TALIS 2013 reported spending an average of 6.1 hours on marking/correcting pupil work, compared to 8.0 hours for secondary school classroom teachers and middle leaders.
• One difference to note in the comparisons in Table E1 is around pupil counselling. TALIS 2013 included one question on pupil counselling, tuition and discipline, which, following cognitive testing, was separated out for the purposes of the current research6.
Comparisons show that when these items are separated out, secondary school classroom teachers and middle leaders in the Teacher Workload Survey report spending more time on these than on the one aggregated measure in TALIS 2013.
5 The mean self-reported working hours in the reference week for secondary school classroom teachers
only was 52.6, compared with 45.9 for Key Stage 3 teachers in TALIS 2013.
6 Respondents were first asked to provide an overall figure of working hours in the reference week followed
by questions about time taken on specific tasks.
Table E1: Comparing TALIS 2013 with the Teacher Workload Survey
Question TALIS 20137 Teacher Workload Survey
2016 (Secondary teachers)8 All Key Stage 3 teachers Classroom teachers and middle leaders9 Classroom teachers only
Mean self-reported working hours in the
reference week – All teachers 45.9 53.5 52.6
Mean self-reported working hours in the
reference week – full time teachers only 4810 55.3 54.9 Mean hours spent teaching in the reference
week 19.6 20.3 20.7
Base for total figures 2,496 2,107 1,444
Mean time spent on non-teaching tasks, all11
Individual planning or preparation of
lessons either at school or out-of-school 7.8 8.4 8.8 Team work and dialogue with colleagues
within this school 3.3 2.8 2.6
Marking/correcting of pupils work 6.1 8.0 8.1 Pupil counselling
1.7
1.6 1.4
Pupil supervision and tuition 3.8 3.8
Pupil discipline including detentions 1.6 1.5 Participation in school management 2.2 2.6 2.2
General administrative work 4.0 4.6 4.1
Communication and co-operation with
parents or guardians 1.6 1.9 1.7
Engaging in extracurricular activities 2.2 3.0 2.9
Activities undertaken
• In total, classroom teachers and middle leaders spent an average of 21.6 hours teaching, or 40% of the self-reported total hours spent working in the reference week. Primary
7 OECD (2014), TALIS 2013 Results. Database Table 6.12. p.162.
8 DfE figures show approximately 88% of all secondary school teachers teach at Key Stage 3. See table 11
in DfE (2016) School Workforce in England: November 2015.
9 Note that figures for classroom teachers and middle leaders in the Teacher Workload Survey were
combined to provide as robust a comparison as possible with TALIS 2013.
10 From Micklewright et al, 2014. No equivalent figure to one decimal place in the TALIS Database Tables 11 Note that time spent on individual tasks cannot be summed to equate to the overall working hours. These
questions were asked separately (as in TALIS).
teachers spent nearly three hours more teaching than secondary teachers. Classroom teachers spent nearly two hours more teaching than middle leaders.
• Classroom teachers and middle leaders in both primary and secondary schools spent an average of 33 hours on non-teaching tasks. About half of this time was spent on two activities: Individual planning or preparation of lessons either at school or out-of-school; and marking/correcting of pupils’ work. Furthermore, most teachers said they generally spent too long on each of these activities, as well as spending too much time on general administrative work.
• Differences in working practices between phases were reflected in the proportion of primary and secondary teachers who undertook the listed professional activities. For example, primary teachers were more likely to say they undertook communication and co-operation with parents or guardians and were much less likely to undertake pupil
supervision and tuition and pupil discipline including detentions compared to secondary teachers. In addition, secondary teachers were three times as likely to have undertaken non-regular teaching cover for absent colleagueswithin their school's timetabled day
during the reference period.
Attitudes towards workload
• The majority (93%) of respondents stated that workload in their school was at least a fairly serious problem; just over half of those surveyed (52%) cited workload as a very serious problem. This group worked an average of 57 hours in the reference week with 19 hours out-of-school time compared to 53 hours and 13 hours respectively for others.
• Over three-quarters of staff were dissatisfied with the number of hours they usually worked. Most staff disagreed that they can complete their workload in their contracted hours, have an acceptable workload and that they can achieve a good balance between their work and private life. Those who strongly disagreed with these statements again reported longer total hours, more hours working out of the regular school day and more additional hours beyond their contract.
• Senior leaders said they used different strategies to try to manage and plan professional time. The most common mechanisms were statutory protected blocks of non-teaching time, working collaboratively with other staff to plan work and using existing schemes of work and associated lesson plans which can be adapted by teaching staff. Over one in five (22%) senior leaders in schools rated as Outstanding by Ofsted reported the