Teachers’ Workloads
Diary Survey 2009
Research Report DCSF-RR159
Research Report No
DCSF-RR159
Teachers’ Workloads Diary Survey 2009
Helen Angle, Alice Fearn, David Elston,
Claire Bassett, and Stephen McGinigal
Table of Contents
Executive Summary ... 1
Acknowledgements ... 2
1 Introduction ... 3
1.1 Background... 3
1.2 Response rate ... 4
1.3 The 2009 survey ... 4
2 Summary of Findings ... 6
2.1 Comparisons between 2009 and previous surveys ... 6
2.2 Total hours worked ... 6
2.3 Teaching hours ... 9
2.4 Perceptions of workload ... 11
2.5 The 2009 survey results ... 13
References... 17
Annex A Survey results... 18
Annex B1 Technical notes ... 53
Annex B2 Achieved sample details... 60
List of Charts and Tables
Table 1 School response rate by type of school, 2009 ... 4Table 2 Response rates over time ... 4
Chart 1 Average hours, primary schools 2000-2009 ... 6
Chart 2 Average hours, secondary schools 2000-2009... 7
Table 3 Average total hours worked by full-time teachers in one week, 1994-2009 ... 9
Executive Summary
• The 2009 teachers’ workloads survey provides data on the hours and working patterns teachers in maintained primary, secondary and special schools in England and Wales. This year’s survey was conducted on a basis similar to the previous nine surveys, with diaries being completed during a single week in March 2009. A sample of 1,572 teachers was achieved.
• Most categories of teacher in 2009 continue to report working over 50 hours per week (the exceptions are secondary heads of faculty or department and special school classroom teachers). Working hours reported by primary heads in 2009 are still lower than in 2000 but have been increasing since 2005. The working hours reported by primary deputy heads have decreased since 2000, although this was not statistically significant. The number of hours worked by primary classroom teachers is lower than in 2000, but have not decreased significantly since 2003.
• The number of hours reported by secondary classroom teachers has remained fairly steady, and although there has been an increase since 2007, the number of hour worked in 2009 is not significantly different from the number of hours worked in 2000. In contrast, the number of hours reported by secondary heads and deputies has been volatile; both have decreased significantly since 2006. The total number of hours worked by secondary heads of faculty or department has decreased significantly since 2000, including a statistically significant decrease between 2008 and 2009.
• The total hours worked by special school classroom teachers have decreased
significantly since 2000, including a significant decrease between 2008 and 2009 (48.3 hours in 2008 and 42.8 hours in 2009).
• Head teachers in primary schools are more likely to think they are expected to do things that are not part of their job most or all of the time compared to other types of teachers. In particular administration and clerical work are mentioned as something which teachers do not think should be part of their job, and they would like to spend less time doing it.
• Primary head teachers are most likely to feel unable to do things which should be part of their job all or most of the time. In primary schools and secondary schools, the main activities that teachers think should be part of their job but they have been unable to do are planning and preparation and assessing/marking pupil work.
• Full-time secondary classroom teachers and heads of department would like to spend more time doing planning and preparation while primary classroom teachers would like to spend more time teaching. Head teachers in primary schools would like to spend more time with children.
Acknowledgements
BMRB wishes to thank the range of stakeholders who assisted with the design of the diary survey and for organising the support of the parties and their detailed comments and suggestions. These contributed to the successful mounting of the study.
1
Introduction
The 2009 teachers’ workloads survey provides independently-collected data on the hours and working patterns of the 1,572 randomly-selected teachers in maintained primary,
secondary and special schools in England and Wales who returned useable questionnaires. It is the tenth survey to examine teachers’ workloads; the previous surveys were carried out in 1994, 1996, 2000, and annually from 2003. The 2009 survey is sponsored by the
Department for Children, Schools and Families.
1.1 Background
Evidence gathered in 2000 by the School Teachers’ Review Body (STRB), from teacher associations and other parties as well as directly from teachers during school visits, showed mounting concern among the profession about teacher workload and its effect on morale. This concern reflected the results of three previous workload surveys commissioned by the STRB, which showed clear increases in average teacher workload between 1994 and 2000. Against this background, the STRB’s Tenth Report, published in February 2001,
recommended that the Department for Education and Employment (as it then was) organise an independent programme to look at the workload of teachers, and the factors contributing to it. The Department subsequently commissioned PricewaterhouseCoopers (PwC) to undertake such a study and formed a Steering Group comprising representatives of all main stakeholders to oversee and guide PwC’s work.
After PwC’s final report, published in December 2001, the then Secretary of State remitted the STRB to consider teacher workload and conditions of service in some detail, and
established a concurrent working party on the remodelling of teaching. The STRB produced recommendations in May 2002 in its Special Review of Approaches to Reducing Teacher Workload.
After a consultation period and further discussions within the working party, most of the organisations represented on that group signed up to a national agreement1, Raising
Standards and Tackling Workload, in January 2003. The agreement acknowledged the
pressure on schools to raise standards and tackle workload and introduced a set of changes to teachers’ conditions of service to be introduced in three annual phases from September 2003:
• 1 September 2003: routine delegation of administrative and clerical tasks, introduction of work / life balance clauses, and introduction of leadership and management time for those with corresponding responsibilities.
• 1 September 2004: introduction of new limits on covering for absent colleagues (38 hours per year).
• 1 September 2005: introduction of guaranteed professional time for planning,
preparation and assessment, introduction of dedicated headship time, and introduction of new invigilation arrangements.
1
1.2 Response rate
Of the 460 schools sampled for the 2009 Teachers’ Workload survey, 169 schools (37%) “co-operated” (meaning at least one completed diary was returned). Across these 169 schools, 2,170 teachers were sampled and 1,572 (72%) of these returned a usable
completed diary. A more detailed description of the methods and diary used can be found in Annex B1.
Table 1 shows that there was a relatively poor school response rate amongst secondary schools (22%) compared with primary (53%) and special schools (75%).
Table 1 School response rate by type of school, 2009
All schools Primary schools
Secondary schools
Special schools
Issued sample 460 180 260 20
Co-operating schools 169 96 58 15
% of schools co-operating 37% 53% 22% 75%
With the exception of a slight improvement in 2007, the school response rate has
consistently fallen since 1996 (Table 2), reaching its lowest level of 37% in 2009, down from 42% in 2008 and 80% in 1996. The overall response rate fall from 2008 can be attributed to a drop in response amongst secondary schools (from 33% to 22%). The main reasons given by schools for not participating in the survey were being too busy and having too many other surveys to complete.
In contrast to the school response rate, the teacher response rate has only declined very slightly over the years the survey has been running, ranging between 76% and 78% in the years 2004 to 2008, and down to 72% in 2009.
Table 2 Response rates over time
1996 2000 2003 2004 2005 2006 2007 2008 2009
Schools 80% 78% 63% 58% 50% 43% 48% 42% 37%
Teachers 83% 87% 82% 78% 77% 78% 76% 78% 72%
1.3 The 2009 survey
2
Summary of Findings
2.1 Comparisons between 2009 and previous surveys
Charts 1 and 2 and Table 3 compare average total hours worked from the 2009 survey with previous years for various categories of teacher. Table 4 gives the same comparison for average hours worked on teaching activities. Tables A1 to A29 in Annex A provide more detailed breakdowns of the survey results.
2.2 Total hours worked
Charts 1 and 2 show the average total hours worked by teachers in primary and secondary schools respectively (detailed figures are set out in Table 3).
Chart 1 Average hours, primary schools 2000-2009
Average total hours, primary schools, 2000-2009
45 50 55 60
2000 2003 2004 2005 2006 2007 2008 2009
A
ve
rag
e ho
ur
s
pe
r
w
eek
Head teachers Deputy heads Classroom teachers
Chart 2 Average hours, secondary schools 2000-2009
Average total hours, secondary schools, 2000-2009
45 50 55 60 65 70
2000 2003 2004 2005 2006 2007 2008 2009
A
ve
rag
e ho
ur
s
p
er
w
ee
k
Head teachers Deputy heads Faculty heads Classroom teachers
Chart 2 shows that the number of hours reported by secondary classroom teachers has remained fairly steady, and although there has been a slight increase since 2007 there has been no significant change since 2000. In contrast, the number of hours reported by
secondary heads and deputies has been volatile, currently lying a little below the long-term average. Estimates of hours worked by these groups are more prone to change than those for classroom teachers due to smaller sample sizes. The working hours reported by heads of faculty or department have fallen since 2000.
The 2009 survey has seen some statistically significant changes3 in the reported numbers of
hours worked by full-time teachers between 2008 and 2009 (shown in Table 3):
• There has been a decrease in the reported number of hours worked by secondary heads of faculty or department, from 52.9 hours in 2008 to 49.5 hours in 2009. The hours worked by teachers in this grade has returned to a level similar to that in 2007 (50.2 hours). The most notable decreases are in the number of hours spent on non-teaching pupil / parent contact and on individual/professional activities.
There are also a number of statistically significant decreases when comparing hours worked in 2000 with hours worked in 2009:
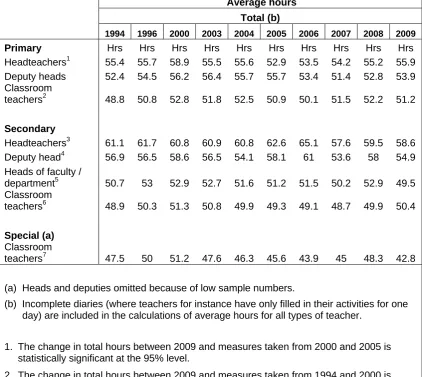
• The total hours worked by primary heads has decreased from 58.9 hours per week in 2000 to 55.9 in 2009.
• Primary classroom teachers report working fewer hours in 2009 than in 2000 (down from 52.8 hours in 2000 to 51.2 hours in 2009).
• Secondary deputy heads report working fewer hours in 2009 (54.9 hours) than in 2000 (58.6 hours).
• The total hours worked by secondary heads of faculty or department has decreased from 52.9 hours in 2000 to 49.5 hours in 2009.
Table 3 Average total hours worked by full-time teachers in one week, 1994-2009
Average hours
Total (b)
1994 1996 2000 2003 2004 2005 2006 2007 2008 2009
Primary Hrs Hrs Hrs Hrs Hrs Hrs Hrs Hrs Hrs Hrs
Headteachers1 55.4 55.7 58.9 55.5 55.6 52.9 53.5 54.2 55.2 55.9
Deputy heads 52.4 54.5 56.2 56.4 55.7 55.7 53.4 51.4 52.8 53.9
Classroom
teachers2 48.8 50.8 52.8 51.8 52.5 50.9 50.1 51.5 52.2 51.2
Secondary
Headteachers3 61.1 61.7 60.8 60.9 60.8 62.6 65.1 57.6 59.5 58.6
Deputy head4 56.9 56.5 58.6 56.5 54.1 58.1 61 53.6 58 54.9
Heads of faculty /
department5 50.7 53 52.9 52.7 51.6 51.2 51.5 50.2 52.9 49.5
Classroom
teachers6 48.9 50.3 51.3 50.8 49.9 49.3 49.1 48.7 49.9 50.4
Special (a)
Classroom
teachers7 47.5 50 51.2 47.6 46.3 45.6 43.9 45 48.3 42.8
(a) Heads and deputies omitted because of low sample numbers.
(b) Incomplete diaries (where teachers for instance have only filled in their activities for one day) are included in the calculations of average hours for all types of teacher.
1. The change in total hours between 2009 and measures taken from 2000 and 2005 is statistically significant at the 95% level.
2. The change in total hours between 2009 and measures taken from 1994 and 2000 is statistically significant at the 95% level.
3. The change in total hours between 2009 and measures taken from 2006 is statistically significant at the 95% level.
4. The change in total hours between 2009 and measures taken from 2000, 2005 and 2006 is statistically significant t at the 95% level.
5. The change in total hours between 2009 and measures taken from 1996, 2000, 2003, 2004 and 2008 is statistically significant at the 95% level.
6. The change in total hours between 2009 and measures taken from 1994 and 2007 is statistically significant at the 95% level.
7. The change in total hours between 2009 and measures taken from 2000, 2003 and 2008 is statistically significant at the 95% level.
2.3 Teaching hours
changes, which have been maintained for the 2009 survey, some time which would previously have been classed as teaching is now classed as non-teaching. Therefore, a direct comparison of teaching hours between pre- and post-2007 surveys should not be made.
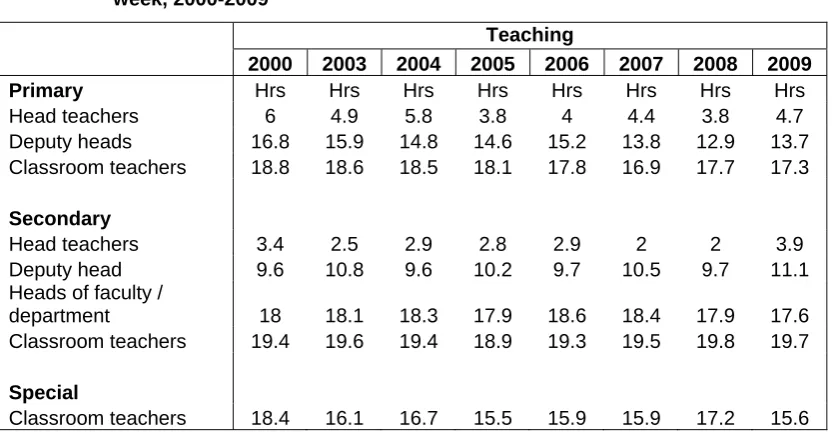
Table 4 Average total teaching hours worked by full-time teachers in one week, 2000-2009
Average hours
Teaching (b)
2000 2003 2004 2005 2006 2007† 2008† 2009†
Primary Hrs Hrs Hrs Hrs Hrs Hrs Hrs Hrs
Headteachers 6 4.9 5.8 3.8 4 3.4 3.3 3.8
Deputy heads 16.8 15.9 14.8 14.6 15.2 13.1 12.4 12.5
Classroom teachers 18.8 18.6 18.5 18.1 17.8 16.6 17.2 16.7
Secondary
Headteachers 3.4 2.5 2.9 2.8 2.9 1.7 1.9 2.3
Deputy head 9.6 10.8 9.6 10.2 9.7 9.9 8.9 10.5
Heads of faculty /
department 18 18.1 18.3 17.9 18.6 17.6 17.2 17.2
Classroom teachers 19.4 19.6 19.4 18.9 19.3 18.8 19 18.8
Special (a)
Classroom teachers 18.4 16.1 16.7 15.5 15.9 15.7 15.6 15.4
(a) Heads and deputies omitted because of low sample numbers.
(b) Teaching hours as defined in 2003, 2004, 2005, 2006, 2007, 2008 and 2009 are not comparable with those of previous years - these exclude administering/invigilating tests, registration, and pastoral / counselling sessions. The figures were recalculated using the new definition for the 2000 data shown here.
† Definition of teaching has changed from previous years: some classroom supervision, which was previously included in the teaching codes, is now classified as non-teaching pupil/parent contact
Total teaching hours worked by full-time teachers can be compared between the 2007, 2008 and 2009 surveys, but this comparison does not reveal any significant changes.
Table 5 Average teaching hours (2000-2006 definition) worked by full-time teachers in a week, 2000-2009
Teaching
2000 2003 2004 2005 2006 2007 2008 2009
Primary Hrs Hrs Hrs Hrs Hrs Hrs Hrs Hrs
Head teachers 6 4.9 5.8 3.8 4 4.4 3.8 4.7
Deputy heads 16.8 15.9 14.8 14.6 15.2 13.8 12.9 13.7
Classroom teachers 18.8 18.6 18.5 18.1 17.8 16.9 17.7 17.3
Secondary
Head teachers 3.4 2.5 2.9 2.8 2.9 2 2 3.9
Deputy head 9.6 10.8 9.6 10.2 9.7 10.5 9.7 11.1
Heads of faculty /
department 18 18.1 18.3 17.9 18.6 18.4 17.9 17.6
Classroom teachers 19.4 19.6 19.4 18.9 19.3 19.5 19.8 19.7
Special
Classroom teachers 18.4 16.1 16.7 15.5 15.9 15.9 17.2 15.6
Typically, recalculating teaching hours in this way adds between half an hour and an hour to the average teaching hours for each grade. In 2009 about one and a half hours was added to the average teaching hours for secondary head teachers (due to a relatively large amount of time spent on educational visits) and less than a quarter of an hour was added to the
average teaching time for special school classroom teachers.
2.4 Perceptions of workload
The first phase of contractual changes arising from the national agreement (implemented 1 September 2003), guaranteed that teachers would not be routinely required to perform administrative and clerical tasks; that all teachers should enjoy a reasonable work / life balance; and that all those with leadership and management responsibilities within the school should have time to focus on these activities.
Phase two (1 September 2004) saw the introduction of new limits on covering for absent colleagues (38 hours per year).
The third and final phase (1 September 2005) guaranteed professional time for planning, preparation and assessment; that headteachers must have dedicated time in which to lead, not just manage, their schools; and that teachers will no longer routinely required to invigilate external examinations.
In light of these changes, the survey asked teachers a number of questions about their perception of their workload (Tables A26-A28 in Annex A). Around a quarter of teachers did not respond to these attitudinal questions and this should be borne in mind when interpreting the responses. Findings from the questions relating to teachers’ general attitudes to their jobs and workloads are shown in Table A26.
Key findings from 2009 were:
• Primary head teachers are also more likely than secondary head teachers to say they felt that all or most of the time they were unable to do things which should be part of their job: 24 per cent of full-time primary heads say this compared with 10 per cent of full-time secondary heads. There has been a decrease for special classroom teachers, from 33 per cent in 2008 to 11 per cent in 2009.
• Primary head teachers are less likely than other teachers to say that all or most of the time it is possible for them to do their job as they feel it should be done: 39 per cent of full-time primary heads say this compared with, for example, 57 per cent of full-time primary classroom teachers. There has been a decrease in the proportion of primary assistant and deputy heads who think that all or most of the time it is possible for them to do their job as they feel it should be done (48 per cent in 2009 compared with 68 per cent in 2008).
• Special school classroom teachers are more likely than primary classroom teachers to say that their duties represented a good use of their time: 70 per cent of them say that this was true all or most of the time, compared with 64 per cent or primary school classroom teachers. In turn, primary classroom teachers are more likely than
secondary classroom teachers to say that their duties represented a good use of their time: 56 per cent of secondary classroom teachers. The proportion for both primary and secondary classroom teachers has increased from 2008 (52 per cent for primary and 45 per cent for secondary in 2008). Primary part-time classroom teachers (49 per cent) are less likely than their full-time counterparts (64 per cent) to say that all or most of the time their duties represented a good use of their time.
• For each category of primary and secondary full time teacher, between 23 and 32 percent feel their workload rarely or never allowed them to pursue personal interests outside work (Table A26). More special classroom teachers have said that their workload allows them to pursue personal interests outside work all or most of the time (48 per cent in 2009 compared with 29 per cent in 2008).
As a follow up to the questions on teachers’ perceptions of their workload, four questions were asked to explore: the types of activities teachers are expected to do that they do not think should be part of their job; the types of activities teachers are unable to do that they think should be part of their job; activities in general that teachers would like to spend less time doing; and activities in general that teachers would like to spend more time doing. Tables A27 to A30 in Annex A show the findings from these questions. The main themes that emerged were:
• Three in ten special school teachers (all grades) who say they are unable to do things that should be part of their job all or most of the time or from time to time give planning and preparation as an example. This is also the most frequently given response by secondary teachers (mentioned by 21 per cent) and primary teachers (14 per cent). Primary and secondary teachers frequently give the examples of assessing and marking pupil work (12 per cent of primary teachers and 18 per cent of secondary). Primary teachers also give responses related to more quality time with pupils, such as more time talking to children and teaching in smaller groups (11 per cent each). Special school teachers also frequently mention teaching, including teaching in smaller group (11 per cent) and making or preparing resources (10 per cent).
• The top activity teachers of all grades say they would like to spend less of their time doing was administration and clerical work (for example, this was mentioned by 34 per cent of primary full-time classroom teachers). Other disliked activities are more
dependent on the type of teacher: 16 per cent of full-time primary head teachers want to spend less of their time carrying out what they perceived to be the caretaker’s role; full-time classroom teachers are keen to spend less time assessing and marking pupil work (mentioned by 13 per cent of those in primary schools and 18 per cent of those in secondary schools).
• The activities most teachers said they would like to spend more of their time doing also varies depending on the type of teacher asked. Primary full-time head teachers want to spend more time with, or talking to, the children (20 per cent) or supporting and
mentoring teachers (18 per cent). The most frequently mentioned activity by secondary full-time head teachers is also to spend more time with, or talking to, the children (24 per cent). Secondary heads also mention strategic planning (17 per cent) and
supporting and mentoring teachers (16 per cent) frequently. Sixteen per cent of full-time primary classroom teachers say they would like to spend more time teaching (either generally or more specifically teaching in smaller groups). Full-time secondary
classroom teachers want to spend more time on planning and preparation (mentioned by 23 per cent).
2.5 The 2009 survey results
Analysis of the grouped activities that make up teachers’ workload is summarised in Table 6 (with more detailed analyses in Tables A20-A22 in Annex A). Key findings are:
2.5.1 Teaching
Classroom teachers in primary and secondary schools spend, on average, around one third of their working time on teaching activities, with the figure slightly higher in secondary
schools than in primaries. Deputy and assistant heads in primary schools spend just under a quarter of their working time teaching, compared with 19 per cent by deputy heads in
secondary schools.
2.5.2 Planning, preparation and assessment
2.5.3 Non-teaching contact with pupils and parents
Teachers in primary and secondary schools spend between 11 per cent (primary classroom teachers) and 16 per cent (primary and secondary heads) of their time on non-teaching contact with pupils and parents.
2.5.4 School / staff management
Heads in both primary and secondary schools spend over half of their working time on management (54 per cent for primary and 57 per cent for secondary). Deputy heads in secondary schools spend 31 per cent of their time on management; the corresponding figure in primary schools is 21 per cent.
2.5.5 General administrative support
For all grades of teacher, the proportion of average hours spent on general administrative support tends to be higher in primary schools than in secondary schools.
2.5.6 Individual / professional activity
On average, primary heads spend around 8 per cent and secondary heads 9 per cent of their time on individual or professional activities, compared with around 6 per cent for primary classroom teachers and 5 per cent for secondary classroom.
2.5.7 Weekend and evening work
On average, full-time teachers in primary schools work between 5 and 9 per cent of their hours at weekends. In secondary schools, the averages range from 8 to 11 per cent. A further 13 to 18 per cent of hours worked in primary and secondary schools are worked after 6.00 pm, or before school starts, on weekdays (Table A23).
Table 6 Average hours worked by full-time teachers, in total and on grouped activities
Heads (a) Deputy heads (a) Classroom teachers
Secondary
Primary Secondary Primary Secondary Primary Head dept Classroom Special
Hrs % Hrs % Hrs % Hrs % Hrs % Hrs % Hrs % Hrs %
Teaching 3.8 6.7% 2.3 3.9% 12.5 23.2% 10.5 19.0% 16.7 32.6% 17.2 34.7% 18.8 37.4% 15.4 36.0%
Planning, preparation and assessment 3.1 5.6% 3.5 6.0% 13.1 24.2% 10.1 18.4% 16.4 32.1% 14.1 28.4% 16.0 31.7% 11.1 25.9%
Non-teaching pupil/parent contact 9.1 16.3% 9.2 15.7% 7.3 13.5% 7.4 13.5% 5.8 11.4% 6.3 12.8% 6.6 13.1% 5.8 13.6%
School / staff management 30.4 54.3% 33.7 57.5% 11.5 21.4% 16.9 30.7% 3.6 7.0% 5.1 10.4% 3.3 6.5% 3.8 8.8%
General administrative support 3.9 7.0% 2.9 4.9% 4.9 9.0% 3.4 6.2% 4.8 9.3% 3.6 7.2% 2.4 4.8% 2.8 6.5%
Individual / professional activity (b) 4.3 7.8% 5.4 9.3% 3.4 6.2% 5.9 10.7% 2.8 5.5% 2.3 4.7% 2.4 4.7% 2.7 6.4%
All known working activities 54.6 97.6% 57.0 97.2% 52.7 97.6% 54.1 98.5% 50.2 97.9% 48.6 98.2% 49.4 98.1% 41.6 97.2%
Other working activities 1.3 2.4% 1.6 2.8% 1.3 2.4% 0.8 1.5% 1.1 2.1% 0.9 1.8% 1.0 1.9% 1.2 2.8%
All working activities 55.9 100% 58.6 100% 53.9 100% 54.9 100% 51.2 100% 49.5 100% 50.4 100% 42.8 100%
(a) - excluding special schools where sample numbers were very low
(b) - includes up to one hour for completing the diary survey
Other activities comprise multi-tasking working codes, imputed working codes, and authorised absence in school hours
Tables A1 to A31 in Annex A provide detailed tabulations of the survey data. Please note that the tabulations are based on survey estimates and are therefore subject to sampling error (see Annex B1 for more details).
The following list summarises the breakdowns of total hours available in the detailed tables: • Gender and teacher category - Tables A1-A4. (These breakdowns are only provided for
those categories of teachers where the sample size for each gender is greater than 50, i.e. heads of department in secondary schools and full-time classroom teachers in primary and secondary schools.)
• Classroom teacher demographics - Tables A5-A7
• Distribution of total hours and teaching hours - Tables A8-A16 • Part-time teachers - Table A17
• Special Schools - Tables A18-A19 • Detailed activities - Tables A20-A22
• Weekend and ‘out of hours’ working - Tables A23-A25
References
DfES (2003) Raising Standards and Tackling Workload: A National Agreement. London: DfES. Available:
http://publications.teachernet.gov.uk/eOrderingDownload/DfES%200172%20200MIG1975.pd f[16 July 2009]
PricewaterhouseCoopers (2001) Teacher Workload Study. London: PwC. Available: http://www.teachernet.gov.uk/_doc/932/ACF19E2.doc[16 July 2009]
School Teachers' Review Body (1994) Teachers’ Workloads Diary Survey. London: OME. School Teachers' Review Body (1996) Teachers’ Workloads Diary Survey. London: OME. School Teachers' Review Body (2000) Teachers’ Workloads Diary Survey. London: OME. School Teachers' Review Body (2001) Tenth Report. Cm 4990. London: TSO. Available: http://www.ome.uk.com/downloads/t0KYJOVW.pdf[16 July 2009]
School Teachers' Review Body (2002). Special Review of Approaches to Reducing Teacher
Workload. Cm 5497. London: TSO. Available:
Annex A
Survey results
Table A1 Average hours worked by full-time heads of department in secondary schools ... 20 Table A2 Average hours worked by full-time classroom teachers... 21 Table A3 Average hours worked by full-time classroom teachers with Teaching and Learning
Responsibility Payment ... 22 Table A4 Average hours worked by full-time classroom teachers without Teaching and Learning Responsibility Payment ... 23 Table A5 Average total hours worked by full-time classroom teachers in primary school by
demographics... 24 Table A6 Average total hours worked by full-time classroom teachers in secondary school by
demographics... 25 Table A7 Average hours worked by full-time classroom teachers by school demographics ... 26 Table A8 Distribution of total hours worked by full-time headteachers... 27 Table A9 Distribution of total hours worked by full-time deputy and assistant headteachers ... 27 Table A10 Distribution of total hours worked by full-time heads of department in secondary
schools ... 28 Table A11 Distribution of total hours worked by full-time classroom teachers ... 28 Table A12 Distribution of total hours worked by full-time classroom teachers with Teaching and
Learning Responsibility Payment ... 29 Table A13 Distribution of total hours worked by full-time classroom teachers without Teaching
and Learning Responsibility Payment ... 29 Table A14 Distribution of teaching hours (a) worked by full-time classroom teachers ... 30 Table A15 Distribution of teaching hours (a) worked by full-time classroom teachers with
Teaching and Learning Responsibility Payment ... 30 Table A16 Distribution of teaching hours (a) worked by full-time classroom teachers without
Table A22 Average hours spent on individual activities by full-time classroom teachers in special schools ... 37 Table A23 Percentage of total hours worked by full-time teachers at weekends, before school or
after 6pm on weekdays ... 39 Table A24 Composition of hours worked at weekends, before school and after 6pm for full-time
classroom teachers ... 40 Table A25 Relationship of total hours worked at weekends, before school and after 6pm for
full-time classroom teachers ... 41 Table A26 General attitudes of teachers to their jobs and workloads ... 42 Table A27 Examples of the type of activities teachers are expected to do that they do not think
should be part of their job... 44 Table A28 Examples of the type of activities teachers have been unable to do but think they
should be part of their job... 46 Table A29 Activities teachers would like to spend less of their time doing... 48 Table A30 Activities teachers would like to more of their time doing... 50 Table A31 Average total hours, teaching hours and hours worked at weekends, before school
and after 6pm for full-time classroom teachers, by the teachers view of "how much of the time it was possible to do the job as it should be done" ... 52 Notes on tables in Annex A
All tables are based on weighted data.
All bases are unweighted unless otherwise stated. The following conventions have been used:
- nil
Table A1 Average hours worked by full-time heads of department in secondary schools
Weighted
Average hours Percentage of total
Hrs %
ALL
Total 49.5 100%
On grouped activities
Teaching 17.2 34.7%
Planning, preparation and assessment 14.1 28.4%
Non-teaching pupil / parent contact 6.3 12.8%
School / staff management 5.1 10.4%
General administrative support 3.6 7.2%
Individual / professional activity 2.3 4.7%
Other working activities 0.9 1.8%
MALES (a)
Total 49.5 100%
On grouped activities
Teaching 17.4 35.1%
Planning, preparation and assessment 14.5 29.4%
Non-teaching pupil / parent contact 6.5 13.1%
School / staff management 5.0 10.1%
General administrative support 2.8 5.6%
Individual / professional activity 2.8 5.6%
Other working activities 0.6 1.2%
FEMALES (b)
Total 49.5 100%
On grouped activities
Teaching 17.1 34.5%
Planning, preparation and assessment 13.7 27.7%
Non-teaching pupil / parent contact 6.2 12.5%
School / staff management 5.3 10.6%
General administrative support 4.2 8.4%
Individual / professional activity 2.0 4.1%
Other working activities 1.1 2.2%
(a) - 68 teachers (b) - 96 teachers
Other activities comprise multi-tasking working codes, imputed working codes, and authorised absence in school hours
Table A2 Average hours worked by full-time classroom teachers
Weighted
Average hours Percentage of total
Primary Secondary Primary Secondary
Hrs Hrs % %
ALL
Total 51.2 50.4 100% 100%
On grouped activities
Teaching 16.7 18.8 32.6% 37.4%
Planning, preparation and assessment 16.4 16.0 32.1% 31.7%
Non-teaching pupil / parent contact 5.8 6.6 11.4% 13.1%
School / staff management 3.6 3.3 7.0% 6.5%
General administrative support 4.8 2.4 9.3% 4.8%
Individual / professional activity 2.8 2.4 5.5% 4.7%
Other activities 1.1 1.0 2.1% 1.9%
MALES (a)
Total 50.1 50.5 100% 100%
On grouped activities
Teaching 17.8 18.4 35.4% 36.4%
Planning, preparation and assessment 17.1 16.3 34.2% 32.3%
Non-teaching pupil / parent contact 4.9 6.9 9.8% 13.7%
School / staff management 3.0 3.2 6.0% 6.4%
General administrative support 3.1 2.2 6.1% 4.4%
Individual / professional activity 3.3 2.6 6.7% 5.1%
Other activities 0.9 0.9 1.8% 1.7%
FEMALES (b)
Total 51.4 50.3 100% 100%
On grouped activities
Teaching 16.5 19.1 32.2% 38.0%
Planning, preparation and assessment 16.3 15.7 31.8% 31.3%
Non-teaching pupil / parent contact 6.0 6.4 11.6% 12.7%
School / staff management 3.7 3.3 7.2% 6.5%
General administrative support 5.0 2.5 9.8% 5.1%
Individual / professional activity 2.8 2.3 5.4% 4.5%
Other activities 1.1 1.0 2.1% 2.0%
(a) - 64 teachers in primary schools and 89 in secondary schools (b) - 460 teachers in primary schools and 148 in secondary schools
Other activities comprise multi-tasking working codes, imputed working codes, and authorised absence in school hours
Table A3 Average hours worked by full-time classroom teachers with Teaching and Learning Responsibility Payment
Weighted
Average hours Percentage of total Primary Secondary Primary Secondary
Hrs Hrs % %
ALL
Total 51.9 51.5 100% 100%
On grouped activities
Teaching 15.7 17.9 30.2% 34.8%
Planning, preparation and assessment 15.8 16.9 30.5% 32.8%
Non-teaching pupil / parent contact 6.3 7.1 12.2% 13.9%
School / staff management 5.1 3.6 9.8% 7.0%
General administrative support 4.7 2.6 9.0% 5.0%
Individual / professional activity 2.9 2.4 5.7% 4.7%
Other activities 1.3 1.0 2.5% 1.9%
MALES (a)
Total
On grouped activities
Teaching
Planning, preparation and assessment
Non-teaching pupil / parent contact
School / staff management (c) (c) (c) (c)
General administrative support
Individual / professional activity
Other activities
FEMALES (b)
Total 52.6 100%
On grouped activities
Teaching 15.4 29.3%
Planning, preparation and assessment 15.9 30.2%
Non-teaching pupil / parent contact 6.5 12.3%
School / staff management 5.5 (c) 10.4% (c)
General administrative support 5.1 9.7%
Individual / professional activity 2.9 5.5%
Other activities 1.4 2.6%
Table A4 Average hours worked by full-time classroom teachers without Teaching and Learning Responsibility Payment
Weighted
Average hours Percentage of total Primary Secondary Primary Secondary
Hrs Hrs % %
ALL
Total 50.8 49.2 100% 100%
On grouped activities
Teaching 16.9 19.4 33.3% 39.5%
Planning, preparation and assessment 16.5 15.8 32.4% 32.0%
Non-teaching pupil / parent contact 5.8 6.0 11.4% 12.1%
School / staff management 3.0 2.6 5.9% 5.2%
General administrative support 4.8 2.3 9.5% 4.6%
Individual / professional activity 2.8 2.4 5.6% 4.8%
Other activities 0.9 0.9 1.9% 1.8%
MALES (a)
Total
On grouped activities
Teaching
Planning, preparation and assessment
Non-teaching pupil / parent contact
School / staff management (c) (c) (c) (c)
General administrative support
Individual / professional activity
Other activities
FEMALES (b)
Total 50.9 49.4 100% 100%
On grouped activities
Teaching 16.8 20.0 33.1% 40.4%
Planning, preparation and assessment 16.4 15.7 32.2% 31.8%
Non-teaching pupil / parent contact 5.9 5.5 11.6% 11.1%
School / staff management 3.1 2.3 6.0% 4.6%
General administrative support 5.0 2.6 9.8% 5.2%
Individual / professional activity 2.7 2.3 5.4% 4.7%
Other activities 0.9 1.1 1.8% 2.2%
(a) - 39 teachers in primary schools and 47 in secondary schools (b) - 281 teachers in primary schools and 74 in secondary schools (c) - Omitted because of low sample numbers
68 teachers in primary schools and 39 teachers in secondary schools are excluded from tables A4 and A5 for failing to give a valid answer
Other activities comprise multi-tasking working codes, imputed working codes, and authorised absence in school hours
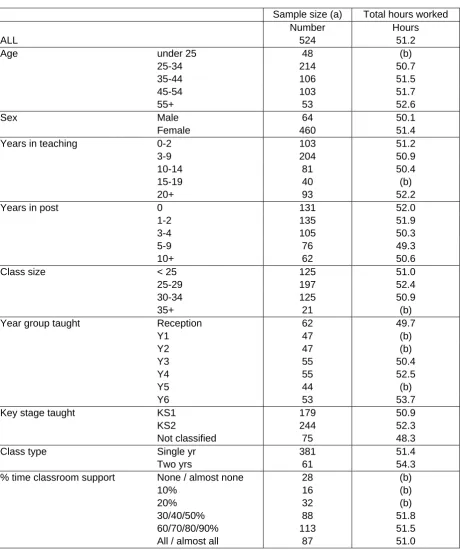
Table A5 Average total hours worked by full-time classroom teachers in primary school by demographics
Weighted
Sample size (a) Total hours worked
Number Hours
ALL 524 51.2
Age under 25 48 (b)
25-34 214 50.7
35-44 106 51.5
45-54 103 51.7
55+ 53 52.6
Sex Male 64 50.1
Female 460 51.4
Years in teaching 0-2 103 51.2
3-9 204 50.9
10-14 81 50.4
15-19 40 (b)
20+ 93 52.2
Years in post 0 131 52.0
1-2 135 51.9
3-4 105 50.3
5-9 76 49.3
10+ 62 50.6
Class size < 25 125 51.0
25-29 197 52.4
30-34 125 50.9
35+ 21 (b)
Year group taught Reception 62 49.7
Y1 47 (b)
Y2 47 (b)
Y3 55 50.4
Y4 55 52.5
Y5 44 (b)
Y6 53 53.7
Key stage taught KS1 179 50.9
KS2 244 52.3
Not classified 75 48.3
Class type Single yr 381 51.4
Two yrs 61 54.3
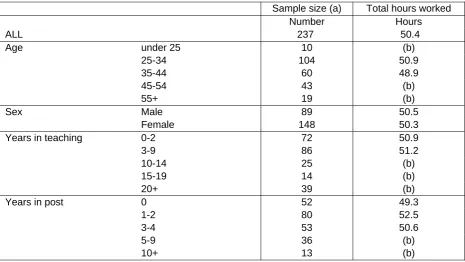
Table A6 Average total hours worked by full-time classroom teachers in secondary school by demographics
Weighted
Sample size (a) Total hours worked
Number Hours
ALL 237 50.4
Age under 25 10 (b)
25-34 104 50.9
35-44 60 48.9
45-54 43 (b)
55+ 19 (b)
Sex Male 89 50.5
Female 148 50.3
Years in teaching 0-2 72 50.9
3-9 86 51.2
10-14 25 (b)
15-19 14 (b)
20+ 39 (b)
Years in post 0 52 49.3
1-2 80 52.5
3-4 53 50.6
5-9 36 (b)
10+ 13 (b)
(a) Unweighted sample size given
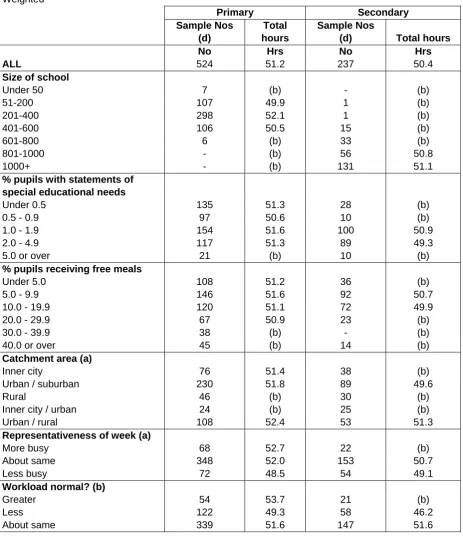
Table A7 Average hours worked by full-time classroom teachers by school demographics Weighted
Primary Secondary Sample Nos
(d)
Total hours
Sample Nos
(d) Total hours
No Hrs No Hrs
ALL 524 51.2 237 50.4
Size of school
Under 50 7 (b) - (b)
51-200 107 49.9 1 (b)
201-400 298 52.1 1 (b)
401-600 106 50.5 15 (b)
601-800 6 (b) 33 (b)
801-1000 - (b) 56 50.8
1000+ - (b) 131 51.1
% pupils with statements of
special educational needs
Under 0.5 135 51.3 28 (b)
0.5 - 0.9 97 50.6 10 (b)
1.0 - 1.9 154 51.6 100 50.9
2.0 - 4.9 117 51.3 89 49.3
5.0 or over 21 (b) 10 (b)
% pupils receiving free meals
Under 5.0 108 51.2 36 (b)
5.0 - 9.9 146 51.6 92 50.7
10.0 - 19.9 120 51.1 72 49.9
20.0 - 29.9 67 50.9 23 (b)
30.0 - 39.9 38 (b) - (b)
40.0 or over 45 (b) 14 (b)
Catchment area (a)
Inner city 76 51.4 38 (b)
Urban / suburban 230 51.8 89 49.6
Rural 46 (b) 30 (b)
Inner city / urban 24 (b) 25 (b)
Urban / rural 108 52.4 53 51.3
Representativeness of week (a)
More busy 68 52.7 22 (b)
About same 348 52.0 153 50.7
Less busy 72 48.5 54 49.1
Workload normal? (b)
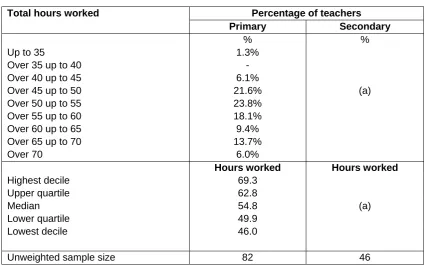
Table A8 Distribution of total hours worked by full-time headteachers
Weighted
Total hours worked Percentage of teachers
Primary Secondary
% %
Up to 35 1.3%
Over 35 up to 40 -
Over 40 up to 45 6.1%
Over 45 up to 50 21.6% (a)
Over 50 up to 55 23.8%
Over 55 up to 60 18.1%
Over 60 up to 65 9.4%
Over 65 up to 70 13.7%
Over 70 6.0%
Hours worked Hours worked
Highest decile 69.3
Upper quartile 62.8
Median 54.8 (a)
Lower quartile 49.9
Lowest decile 46.0
Unweighted sample size 82 46
[image:31.595.57.481.458.718.2](a) Omitted because of low sample numbers
Table A9 Distribution of total hours worked by full-time deputy and assistant headteachers
Weighted
Total hours worked Percentage of teachers
Primary Secondary
% %
Up to 35 5.2%
Over 35 up to 40 2.0%
Over 40 up to 45 8.0%
Over 45 up to 50 13.7% (a)
Over 50 up to 55 28.9%
Over 55 up to 60 19.8%
Over 60 up to 65 10.2%
Over 65 up to 70 5.1%
Over 70 7.1%
Hours worked Hours worked
Highest decile 65.2
Upper quartile 58.8
Median 53.8 (a)
Lower quartile 49.6
Lowest decile 41.0
Table A10 Distribution of total hours worked by full-time heads of department in secondary schools
Weighted
Total hours worked Percentage of teachers
%
Up to 35 6.2%
Over 35 up to 40 7.1%
Over 40 up to 45 12.2%
Over 45 up to 50 24.6%
Over 50 up to 55 25.7%
Over 55 up to 60 13.1%
Over 60 up to 65 6.7%
Over 65 up to 70 2.2%
Over 70 2.2%
Highest decile 61.1
Upper quartile 54.5
Median 50.0
Lower quartile 44.9
Lowest decile 39.0
[image:32.595.55.491.433.694.2]
Unweighted sample size 164
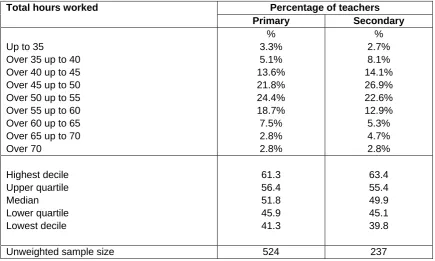
Table A11 Distribution of total hours worked by full-time classroom teachers
Weighted
Total hours worked Percentage of teachers
Primary Secondary
% %
Up to 35 3.3% 2.7%
Over 35 up to 40 5.1% 8.1%
Over 40 up to 45 13.6% 14.1%
Over 45 up to 50 21.8% 26.9%
Over 50 up to 55 24.4% 22.6%
Over 55 up to 60 18.7% 12.9%
Over 60 up to 65 7.5% 5.3%
Over 65 up to 70 2.8% 4.7%
Over 70 2.8% 2.8%
Table A12 Distribution of total hours worked by full-time classroom teachers with Teaching and Learning Responsibility Payment
Weighted
Total hours worked Percentage of teachers
Primary Secondary
% %
Up to 35 2.4% 1.7%
Over 35 up to 40 5.8% 8.3%
Over 40 up to 45 12.1% 13.7%
Over 45 up to 50 23.6% 25.8%
Over 50 up to 55 21.3% 23.4%
Over 55 up to 60 18.2% 13.0%
Over 60 up to 65 10.8% 3.9%
Over 65 up to 70 2.4% 4.1%
Over 70 3.5% 6.1%
Unweighted sample size 136 77
68 teachers in primary schools and 39 teachers in secondary schools are excluded from tables A12 and A13 for failing to give a valid answer
Table A13 Distribution of total hours worked by full-time classroom teachers without Teaching and Learning Responsibility Payment
Weighted
Total hours worked Percentage of teachers
Primary Secondary
% %
Up to 35 3.3% 3.9%
Over 35 up to 40 5.7% 7.5%
Over 40 up to 45 14.7% 15.1%
Over 45 up to 50 21.2% 28.5%
Over 50 up to 55 26.2% 21.9%
Over 55 up to 60 17.8% 12.2%
Over 60 up to 65 5.5% 7.8%
Over 65 up to 70 2.8% 3.2%
Over 70 2.9% -
Unweighted sample size 320 121
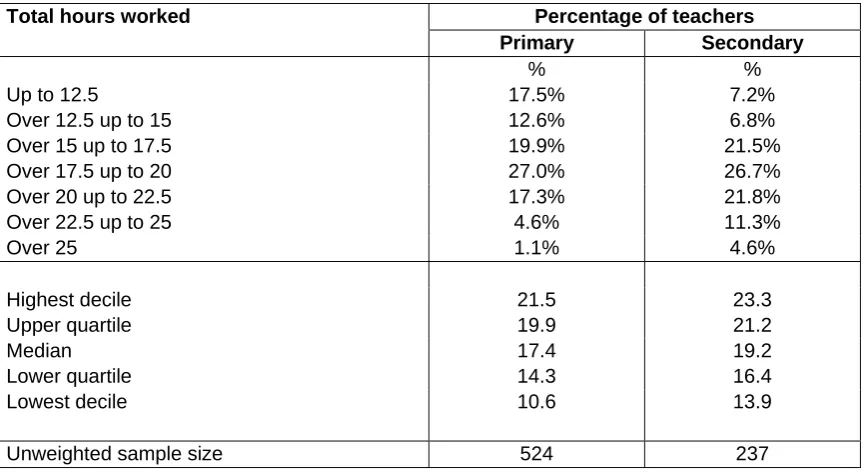
Table A14 Distribution of teaching hours (a) worked by full-time classroom teachers
Weighted
Total hours worked Percentage of teachers
Primary Secondary
% %
Up to 12.5 17.5% 7.2%
Over 12.5 up to 15 12.6% 6.8%
Over 15 up to 17.5 19.9% 21.5%
Over 17.5 up to 20 27.0% 26.7%
Over 20 up to 22.5 17.3% 21.8%
Over 22.5 up to 25 4.6% 11.3%
Over 25 1.1% 4.6%
Highest decile 21.5 23.3
Upper quartile 19.9 21.2
Median 17.4 19.2
Lower quartile 14.3 16.4
Lowest decile 10.6 13.9
Unweighted sample size 524 237
[image:34.595.58.490.112.348.2](a) Own lessons etc, cover, teaching outside the timetabled day, assisting in other lessons and educational visits
Table A15 Distribution of teaching hours (a) worked by full-time classroom teachers with Teaching and Learning Responsibility Payment
Weighted
Total hours worked Percentage of teachers
Primary Secondary
% %
Up to 12.5 22.5% 5.4%
Over 12.5 up to 15 17.8% 9.7%
Over 15 up to 17.5 22.0% 28.1%
Over 17.5 up to 20 22.3% 28.9%
Over 20 up to 22.5 11.6% 18.4%
Over 22.5 up to 25 3.1% 8.9%
Over 25 0.6% 0.5%
Table A16 Distribution of teaching hours (a) worked by full-time classroom teachers without Teaching and Learning Responsibility Payment
Weighted
Total hours worked Percentage of teachers
Primary Secondary
% %
Up to 12.5 16.0% 7.3%
Over 12.5 up to 15 10.7% 6.1%
Over 15 up to 17.5 20.7% 15.0%
Over 17.5 up to 20 27.9% 24.0%
Over 20 up to 22.5 18.7% 27.1%
Over 22.5 up to 25 5.3% 13.5%
Over 25 0.7% 7.0%
Unweighted sample size 320 121
(a) Own lessons etc, cover, teaching outside the timetabled day, assisting in other lessons and educational visits
68 teachers in primary schools and 39 teachers in secondary schools are excluded from tables A15 and A16 for failing to give a valid answer
Table A17 Average hours worked by part-time classroom teachers
Weighted
Average hours Percentage of total Primary Secondary Primary Secondary
Hrs Hrs % %
Total 32.8 31.4 100.0% 100.0%
On grouped activities
Teaching 11.0 11.2 33.6% 35.5%
Planning, preparation and assessment 11.4 10.7 34.7% 34.0%
Non-teaching pupil / parent contact 3.1 3.1 9.5% 9.7%
School / staff management 2.6 1.9 8.0% 6.1%
General administrative support 2.7 2.0 8.2% 6.3%
Individual / professional activity (a) 1.4 1.7 4.3% 5.5%
Other working activities (b) 0.6 0.9 1.7% 2.9%
Unweighted sample size 170 58
(a) Total hours worked and individual / professional activity include, as in previous years, completing the diary, which takes around an hour on average
Table A18 Average hours worked by full-time teachers in special schools
Weighted
Classroom teachers
%
Percentage distribution of hours worked
on grouped activities
Teaching 36.0%
Planning, preparation and assessment 25.9%
Non-teaching contact 13.6%
School / staff management 8.8%
General admin tasks 6.5%
Individual / professional activity 6.4%
Other working activities 2.8%
Average hours worked Hrs 42.8
Unweighted sample size 86
Other working activities comprise multi-tasking working codes, imputed working codes, and authorised absence in school hours
[image:36.595.56.489.406.678.2]Individual / professional activity includes, as in previous years, completing the diary, which takes around an hour on average
Table A19 Distribution of total hours and teaching hours worked by full-time classroom teachers in special schools
Weighted
Percentage of teachers
%
Total hours
Up to 35 15.7%
Over 35 up to 40 12.6%
Over 40 up to 45 24.0%
Over 45 up to 50 19.4%
Over 50 up to 55 17.5%
Over 55 up to 60 8.4%
Over 60 up to 65 1.8%
Over 65 up to 70 0.6%
Over 70 -
Teaching hours
Up to 12.5 25.7%
Table A20 Average hours spent on individual activities by full-time headteachers, deputy headteachers and classroom teachers in primary schools
Weighted Headteacher Deputy head Classroom teacher
Hrs Hrs Hrs
Teaching 3.8 12.5 16.7
Regular timetabled teaching within own timetabled day 2.0 10.9 15.9
Non-regular teaching during cover for absent colleague within school's timetabled day (not cover supervision - this is
code P22) 0.7 0.2 0.2
Teaching / tutorial outside the timetabled day (e.g.homework
classes) 0.2 0.3 0.2
Assisting pupils in another teacher’s lesson 0.4 0.2 0.2
Teaching pupils on an educational visit 0.4 1.0 0.2
Non-teaching pupil / parent contact 9.1 7.3 5.8
Supervising pupils before / during / after pupil day (e.g. at break, taking / supervising assembly, going to / from sporting
/ cultural activities) 3.7 2.6 2.2
Registration / general classroom management / pastoral /
counselling session 0.1 0.7 1.1
Covering for absent colleague, when cover takes the form of
supervising pre-set work 0.1 0.3 0.0
Conducting external examinations (e.g. practical and oral
examinations in your own subject) - - *
Invigilating external examinations (e.g. National Curriculum
tests, GCSE examinations) - - 0.0
Conducting other tests / exams * 0.0 0.1
Invigilating other tests / exams 0.0 - 0.0
Coaching sport, rehearsing drama / music or organising pupil
clubs / societies (not as part of timetabled teaching) 0.4 0.4 0.5
Disciplining / praising pupils (inc. detention) 0.6 0.6 0.2
Pastoral care with individual pupils 0.4 0.3 0.1
Any contact with parents / families (inc. contact with
individual parents, PTA, parents’ evening) 2.4 1.0 0.7
Supervising pupils on educational visits, or while external
provider is teaching pupils 0.8 0.9 0.6
Other non-teaching activities relating to particular pupils or
parents 0.6 0.7 0.4
Planning, preparation and assessment 3.1 13.1 16.4
Planning / preparing lesson, practical test or assessment (inc. gathering and preparing resources). Includes joint
planning sessions with other members of staff 1.6 7.3 9.3
Assessing / marking pupil work (including exam / test) or assessing pupils more generally, including discussions with
other staff members 0.8 3.9 5.3
Writing reports on pupil progress 0.2 0.7 0.5
Other non-contact activities relating to lesson planning,
preparation or assessment 0.5 1.2 1.4
School / Staff management 30.4 11.5 3.6
Table A20 Average hours spent on individual activities by full-time headteachers, deputy headteachers and classroom teachers in primary schools
Weighted
Headteacher
Deputy head
Classroom teacher
Hrs Hrs Hrs
school (but not about specific pupils or planning)
Arranging teaching duties, timetables, pupil allocation or
supply 1.0 0.9 0.1
Contact / interaction with support staff (not including lesson
planning / pupil assessment) 1.3 0.3 0.2
School policy development (including planning,
implementation) 3.1 0.7 0.2
Financial management and planning 2.7 0.2 0.0
Publicity / marketing activities 0.2 0.0 0.0
Contact with governors (e.g. telephone calls) 1.9 0.3 0.1
Contact with educational body (e.g. DCSF, NafW, LA, EWO,
OFSTED/Estyn, TDA) 2.7 0.5 0.1
Contact with community (e.g. social services, police,
employers, newspapers) 1.0 0.3 0.1
Contact with other local education providers (e.g. other
nurseries, schools or colleges) 1.4 0.3 0.1
Other management related activities 7.4 2.6 0.4
General administrative support 3.9 4.9 4.8
Keeping records on pupil performance (e.g. for National
Curriculum, school records, examination boards etc.) 0.5 1.2 0.6
Keeping records or department records (excluding those on
pupil performance) 0.3 0.3 0.1
Organising resources and premises (e.g. buildings,
equipment, books, computers) 0.7 0.7 0.7
Displaying / mounting pupils’ work or information for pupils 0.1 0.3 0.5
Setting up / tidying classroom, lab or other teaching area
(excluding activities for M35) 0.2 1.4 2.1
Simple clerical activity (e.g. photocopying) 0.2 0.3 0.4
Other kinds of administrative activities 2.0 0.8 0.4
Individual / Professional activity 4.3 3.4 2.8
Training or development activity, including INSET, peer
observation or being mentored 2.0 1.7 1.2
Studying / background reading (excluding preparing for
particular classes code M35) 0.9 0.4 0.3
Keeping this diary 0.7 0.8 0.9
Table A21 Average hours spent on individual activities by full-time headteachers, deputy headteachers, heads of department and classroom teachers in secondary schools
Weighted Headteac her Deputy head Head of departme nt Classroo m teacher
Hrs Hrs Hrs Hrs
Teaching 2.3 10.5 17.2 18.8
Regular timetabled teaching within own timetabled day 16.0 17.5 Non-regular teaching during cover for absent colleague within
school's timetabled day (not cover supervision - this is code P22) (a) (a) 0.3 0.2 Teaching / tutorial outside the timetabled day (e.g.homework classes) 0.8 0.8
Assisting pupils in another teacher’s lesson 0.1 0.1 Teaching pupils on an educational visit 0.1 0.1
Non-teaching pupil / parent contact 9.2 7.4 6.3 6.6 Supervising pupils before / during / after pupil day (e.g. at break,
taking / supervising assembly, going to / from sporting / cultural
activities) 1.4 1.4
Registration / general classroom management / pastoral / counselling
session 1.3 1.3
Covering for absent colleague, when cover takes the form of
supervising pre-set work 0.1 0.4
Conducting external examinations (e.g. practical and oral
examinations in your own subject) 0.1 0.0
Invigilating external examinations (e.g. National Curriculum tests,
GCSE examinations) (a) (a) 0.0 0.0
Conducting other tests / exams 0.1 0.0
Invigilating other tests / exams 0.0 0.0
Coaching sport, rehearsing drama / music or organising pupil clubs /
societies (not as part of timetabled teaching) 1.0 1.0 Disciplining / praising pupils (inc. detention) 0.4 0.4
Pastoral care with individual pupils 0.4 0.4
Any contact with parents / families (inc. contact with individual
parents, PTA, parents’ evening) 0.4 0.6
Supervising pupils on educational visits, or while external provider is
teaching pupils 0.3 0.5
Other non-teaching activities relating to particular pupils or parents 0.7 0.5
Planning, preparation and assessment 3.5 10.1 14.1 16.0 Planning / preparing lesson, practical test or assessment (inc.
gathering and preparing resources). Includes joint planning sessions
with other members of staff 6.4 8.1
Assessing / marking pupil work (including exam/test) or assessing
pupils more generally, including discussions with other staff members (a) (a) 5.2 5.7
Writing reports on pupil progress 1.6 1.2
Other non-contact activities relating to lesson planning, preparation or
assessment 0.9 0.9
School/Staff management 33.7 16.9 5.1 3.3
General staff / management meeting (including preparation, writing
agenda / minutes etc.) 1.5 1.3
Appraising and monitoring other teaching staff 0.3 0.1 Coaching , mentoring and training other teaching staff 0.4 0.3 Other contact / interaction with teaching staff in your own school (but
not about specific pupils or planning) 0.7 0.5
Arranging teaching duties, timetables, pupil allocation or supply 0.3 0.3 Contact / interaction with support staff (not including lesson planning /
pupil assessment) (a) (a) 0.2 0.1
Table A21 Average hours spent on individual activities by full-time headteachers, deputy headteachers, heads of department and classroom teachers in secondary schools
Weighted Headteac her Deputy head Head of departme nt Classroo m teacher
Hrs Hrs Hrs Hrs
OFSTED/Estyn, TDA)
Contact with community (e.g. social services, police, employers,
newspapers) 0.1 0.1
Contact with other local education providers (e.g. other nurseries,
schools or colleges) 0.2 0.1
Other management related activities 1.0 0.4
General administrative support 2.9 3.4 3.6 2.4 Keeping records on pupil performance (e.g. for National Curriculum,
school records, examination boards etc.) 0.5 0.4 Keeping records or department records (excluding those on pupil
performance) 0.2 0.1
Organising resources and premises (e.g. buildings, equipment,
books, computers) (a) (a) 0.6 0.4
Displaying / mounting pupils’ work or information for pupils 0.1 0.1 Setting up / tidying classroom, lab or other teaching area (excluding
activities for M35) 0.8 0.7
Simple clerical activity (e.g. photocopying) 0.3 0.3 Other kinds of administrative activities 1.0 0.4
Individual / Professional activity 5.4 5.9 2.3 2.4 Training or development activity, including INSET, peer observation
or being mentored 1.0 0.6
Studying / background reading (excluding preparing for particular
classes code M35) (a) (a) 0.4 0.5
Keeping this diary 0.7 0.7
Other individual / professional activity (please describe in notes
column) 0.3 0.6
All known working activity 57.0 54.1 48.6 49.4
Other working activities 1.6 0.8 0.9 1.0 Authorised absence during school hours (a) (a) 0.0 0.2
Other activities (Multiple, unknown) 0.9 0.7
All working activities 58.6 54.9 49.5 50.4
Own time - non working break in school hours 2.9 3.4
(a) Omitted because of low sample numbers
Table A22 Average hours spent on individual activities by full-time classroom teachers in special schools
Weighted
Classroom teacher
Hrs
Teaching 15.4
Regular timetabled teaching within own timetabled day 14.4 Non-regular teaching during cover for absent colleague within school's
timetabled day (not cover supervision - this is code P22) 0.1 Teaching/tutorial outside the timetabled day (e.g.homework classes) 0.1 Assisting pupils in another teacher’s lesson 0.1 Teaching pupils on an educational visit 0.7
Non-teaching pupil / parent contact 5.8 Supervising pupils before / during / after pupil day (e.g. at break, taking /
supervising assembly, going to / from sporting / cultural activities) 2.5 Registration / general classroom management /pastoral / counselling
session 1.0
Covering for absent colleague, when cover takes the form of supervising
pre-set work 0.0
Conducting external examinations (e.g. practical and oral examinations
in your own subject) -
Invigilating external examinations (e.g. National Curriculum tests, GCSE
examinations) -
Conducting other tests / exams 0.0
Invigilating other tests / exams -
Coaching sport, rehearsing drama/music or organising pupil clubs /
societies (not as part of timetabled teaching) 0.1 Disciplining / praising pupils (inc. detention) 0.1
Pastoral care with individual pupils 0.2
Any contact with parents/families (inc. contact with individual parents,
PTA, parents’ evening) 0.8
Supervising pupils on educational visits, or while external provider is
teaching pupils 0.2
Other non-teaching activities relating to particular pupils or parents 0.8
Planning, preparation and assessment 11.1 Planning / preparing lesson, practical test or assessment (inc. gathering
and preparing resources). Includes joint planning sessions with other
members of staff 7.1
Assessing / marking pupil work (including exam / test) or assessing
pupils more generally, including discussions with other staff members 0.8
Writing reports on pupil progress 1.8
Other non-contact activities relating to lesson planning, preparation or
assessment 1.4
School / Staff management 3.8
General staff / management meeting (including preparation, writing
agenda / minutes etc.) 1.4
Appraising and monitoring other teaching staff 0.2 Coaching , mentoring and training other teaching staff 0.2 Other contact / interaction with teaching staff in your own school (but not
about specific pupils or planning) 0.3
Arranging teaching duties, timetables, pupil allocation or supply 0.1
Contact / interaction with support staff (not including lesson planning /
pupil assessment) 0.3
School policy development (including planning, implementation) 0.6
Financial management and planning 0.0
Table A22 Average hours spent on individual activities by full-time classroom teachers in special schools
Weighted
Classroom teacher
Hrs
newspapers)
Contact with other local education providers (e.g. other nurseries,
schools or colleges) 0.1
Other management related activities 0.4
General Administrative support 2.8 Keeping records on pupil performance (e.g. for National Curriculum,
school records, examination boards etc.) 0.4 Keeping records or department records (excluding those on pupil
performance) 0.1
Organising resources and premises (e.g. buildings, equipment, books,
computers) 0.5
Displaying / mounting pupils’ work or information for pupils 0.2 Setting up / tidying classroom, lab or other teaching area (excluding
activities for M35) 1.1
Simple clerical activity (e.g. photocopying) 0.2 Other kinds of administrative activities 0.4
Individual / Professional activity 2.7 Training or development activity, including INSET, peer observation or
being mentored 1.1
Studying / background reading (excluding preparing for particular
classes code M35) 0.4
Keeping this diary 0.8
Other individual / professional activity (please describe in notes column) 0.4
All known working activity 41.6
Other working activities 1.2
Authorised absence during school hours 0.1
Other activities (Multiple, unknown) 1.1
All working activities 42.8
Own time - non working break in school hours 2.9
Other activities comprise multi-tasking working codes, imputed working codes, and authorised absence in school hours
Table A23 Percentage of total hours worked by full-time teachers at weekends, before school or after 6pm on weekdays
Weighted
Percentage of total hours worked
At weekends
Before school/after 6pm
% %
Primary schools
Headteachers 7.5% 14.5%
Male 8.1% 13.4%
Female 7.2% 15.0%
Deputy head teachers 8.0% 16.0%
Male 4.8% 14.5%
Female 8.9% 16.4%
Classroom teachers 8.8% 14.1%
Male 7.8% 13.6%
Female 8.9% 14.2%
Classroom teachers with TLR 8.2% 15.1%
Male 6.3% 13.9%
Female 8.5% 15.3%
Classroom teachers without TLR 8.9% 13.5%
Male 8.6% 12.4%
Female 9.0% 13.6%
Secondary schools
Headteachers 9.7% 14.8%
Male 9.7% 14.9%
Female 9.9% 14.6%
Deputy head teachers 9.9% 14.9%
Male 8.4% 17.5%
Female 11.1% 12.8%
Heads of department 8.9% 15.8%
Male 8.7% 16.5%
Female 9.0% 15.2%
Classroom teachers 9.2% 15.6%
Male 8.4% 16.1%
Female 9.6% 15.3%
Classroom teachers with TLR 9.4% 16.2%
Male 7.6% 18.0%
Female 10.6% 15.1%
Classroom teachers without TLR 8.8% 15.3%
Male 8.8% 15.4%
Table A24 Composition of hours worked at weekends, before school and after 6pm for full-time classroom teachers
Weighted
Primary Secondary
% %
Teaching 0.4% 1.0%
All planning, preparation and assessment etc 68.9% 71.4%
Planning 39.0% 35.0%
Assessing 22.0% 26.6%
Other planning, preparation and assessment
etc (a) 7.9% 9.7%
Non-teaching pupil / parent contact 2.4% 5.5%
School / staff management 5.0% 5.5%
General administrative support 12.7% 6.4%
Individual / professional activity (b) 9.5% 9.5%
Other working activities (c) 1.1% 0.7%
Total hours 11.7 12.47
Unweighted sample size 524 237
(a) i.e. "lesson preparation, marking etc" excluding planning and marking
(b) Total hours worked and individual / professional activity include, as in previous years, completing the diary, which takes around an hour on average