Demographic report
1997
Employment
&
social affairs
Social protection and social action
European Commission
Directorate-General for Employment, Industrial Relations and Social Affairs
UnitY /E.l
Document drawn up on the basis of COM{97) 361 final.
Note to the reader
All the statistics presented in this report were supplied by the Statistical Office of the European Communities.
A great deal of additional information on the European Union is available on the Internet. It can be accessed through the Europa server (http://europa.eu.int).
Cataloguing data can be found at the end of this publication.
Luxembourg: Office for Official Publications of the European Communities, 1998 ISBN 92-828-0872-6
©European Communities, 1998
Contents
Introduction ..
5
Part 1 -
Impact of demographic change on the labour market .
7
Part 2 -
The significance of the regional dimension
19
Part
3 -
Demographic trends in the applicant States ..
29
Annexes.
33
Introduction
--1
Demography assumes increasing significance as slower population growth and ageing keep transforming the age pyramid at an accelerating rate. The conclusion of the last report
(IJ
was that, given present trends, the next 30 years could see the population aged over 60 grow by 50 %, while at the same time the number of young people (0-19 years) and adults (20-59 years) would fall by 1 1 and 6 % respectively.The effects of this marked transition towards a much older population are set to be felt through to the middle of the next century.
The first effects of an ageing population are already being felt in the field of social protection, particularly on retire-ment pensions, but also on health. This will place great strain on the future funding of social protection which is largely dependent upon the contributions of the working population. The developing trends indicate both a fall in the population of working age and an increase in the number of older people. As their number grows, the role of elderly people in society is also going to become increasingly relevant. Demography is thus already becom-ing a crucial factor which must be taken into account when modernising social protection.
Demographic change will also impact on the characteris-tics of the population of working age which makes up the labour force. What will be the demographic changes in this labour force? What effect will these changes have on the labour market? Will this demographic change require specific action? These are the questions which Part 1 of this report attempts to explore.
The situation at the EU level will also have consequences for regional balances in socioeconomic terms. This will be the focus of attention in Part 2 of this report. Will demo-graphic change help to reduce regional differences or, alternatively, will some regions be faced with growing imbalances? Locally, how will it be possible to bring the labour market into line with the pools of available labour? Will the framework for action vary from one region to another?
Part 3 of the report tries to identify the major demographic trends in the 12 applicant States
(21.
This analysis will aim at providing a better understanding of the significance ofdemography for this group of countries which are experi-encing deep-seated economic change.
Whether the subject is social protection, employment, or structural policy, the demographic variable is destined to be an essential factor in analysing problems and develop-ing appropriate policy. The development of a medium to long-term perspective in policy-making is of vital impor-tance to the Union.
The Commission therefore presents the 1997 demo-graphic report as the basis for reflection and reaction by policy-makers throughout the Union.
(') See 'The demographic situation in the European Union- 1995', European Commission, Directorate·General V. (') Malta hos been included although, for the time being, this country has frozen its membership application.
Impact of demographic change
on the labour market
Demographic change and the labour market are linked in many respects, three of which deserve particular attention:
1. Demographic change modifies the internal character-istics of the labour market. By changing the structure and the size of the pools of available labour, demog-raphy affects the basic conditions under which the labour market operates.
2: Demographic change also influences the labour mar-ket by putting pressure on systems of social protection. Imbalances between the number of active and non-active people not only affect the funding and organi-sation of social protection, but also the functioning of the labour market itself.
3. It is not just the population's age and gender structure which affects the active population, but also the demography of families and households. The propen-sity to form or dissolve couples, have children, child-care conditions and the living arrangements for the young and the elderly are all factors which can have an effect on whether or not people take up employ-ment. On the other hand, the opportunities offered by the labour market influence the life-cycle decisions of individuals and households.
The Commission highlighted these three types of relation-ship in its last report on the demographic situation, giving an initial quantitative estimate of the effects of an ageing population on social protection. However, the possible impact of demographic change on the labour market is equally important. This part will seek to outline what are likely to be the principal effects of demographic change in this area.
It must also be remembered that these effects are no more than a backdrop against which other factors inevitably come into play, such as economic growth and productiv-ity. Nevertheless, within the limits of our approach, the analyses pursued here aim at providing an understanding of the impact and extent of demographic change and of the margins for manoeuvre within the various population groups.
The reason for choosing the 20-64 age
group when defining the population of
working age
In the 1995 report, the group of people aged between 20
and 59 years was taken as constituting the 'population of
working
age'.Since then, an assessment has been made
as to how the balance between active and non-active
people might shift if the present trend towards longer
periods of study and earlier retirement were maintained.
That made it possible to assess the cost of the status quo.
However, it should be noted that activity patterns tend to
move progressively away from the stereotype 'young
edu-cation, adult employment, older retirement'. This
emerg-ing trend renders the choice of the age groups very
diffi-cult.
For the purposes of the present analysis of future
scenar-ios, people aged between 20 and 64 years
wereselected
as being the most illustrative. First of all, the present trend
of entering the labour market after a longer period of
study is likely to continue -
especially considering that
changes in the nature of economic activity will mean that
the future labour market will require an increasingly
skilled and qualified workforce. The second point is that
the active population is already feeling the weight of
retirement pensions which they are required to fund.
These trends call for policies aiming at expanding current
activity levels.
The choice of this age group offers an additional
advan-tage in terms of demographic projections. As the study is
concerned with the years 1995 to 2015, people reaching
the age of 20 in 2015 have already been born. The
pro-jections are therefore unaffected by hypotheses regarding
future fertility among the 20-64 age group, an element of
uncertainty which would have reduced the reliability of
the forecasts.
Overall chang·e in the active age
population
Figure 1 compares the rate of change for the Union's total population with the rate of change within the 20-64 age group, with reference to three scenarios of demographic change
(1).
Three consecutive periods can be identified:
•
over the past 20 years, the population of working age has increased at a faster rate than the total popula-tion;• over the next 15 years, the population of working age will stabilise at a relatively constant level, while the total population will still continue to grow;
• after approximately 15 years, the population of work
-ing age will start to fall significantly, while the total population will slow down at a diminishing pace.
In brief
Following a previous period of growth, the popula-tion of working age stabilised around 7 995; in around 7 5
years'
time it will start to fall.Related issues
[image:6.588.307.548.142.441.2]The reduced rate of increase and subsequent fall in the population of working age could reduce the pres -sure exerted by labour supply on labour demand if participation in the labour market remains at the present rate. On the other hand, the demographic trends within the total population will tend to increase the burden of social protection on the work-ing population.
Figure 1
Changes in the total population and in the
population of working age (20-64 years)
Base index of 1 00 in 1995 for three demographic scenarios
110 --~c-:---c--- Minimum ageing
105 -100
-95 -90 - ~
ss=---t+.:_,+~t• I I I I I-I -1 I >---+-+----,__-+-+-<-++-++->---+-+----++--+-+---+4~ 1975 1980 1985 1990 1995 2000 2005 2010 2015 2020
110
Continuation of present trends 105
100 95
90
85 I t-I+ I 1---+-+-+---+-t
2025 2030
1975 1980 1985 1990 1995 2000 2005 2010 2015 2020 2{)25 2030
110
Maximum ageing 105
-90
85~t -1 +-t t~l t t I I I
1975 1980 1985 1990 1995 2000 2005 2010 2015 2020 2025 2030
_ _ Total population
- - -- - Population of working age
Source: Eurostat, observations until1995, projections after that date.
(') Annex A presents live scenarios in total. The three scenarios in question (young, baseline and old) plus two more scenarios (high and low).
Dependency relationships
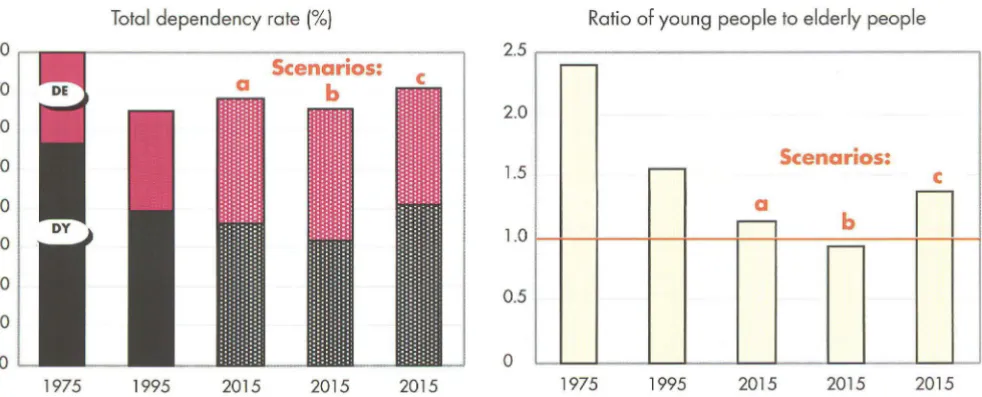
Within the limits of the demographic approach, the meas-urement of dependency illustrated in Figure 2 can give a good idea of the tension in the sphere of social protection arising from demographic trends, and its impact on the labour market:
• Total dependency has fallen over the past
20
years for two reasons: first, baby-boom generations joined the active population; second, fertility rates have fallen since1975.
• Total dependency will start to increase again, initially because of smaller inflows of working age population and later, after
2010,
because of the retirement of the baby-boom generations. The growth in elderly people will be the principal sourceof
social protection expen-diture increase.• Even if there is a reversal of fertility trends, as envis-aged by the low ageing scenario (scenario 'c'), this will not be sufficient to prevent in the long term the rel-ative increase in the dependency ratio due to the increase in the proportion of older people.
Definitions
Total dependency (TD)
=
{0-19 years + 65 years and+]+ {20-64 years}
Dependency of elderly people (DE)
=
{65 years and+]+ {20-64 years}
Dependency of young people (DY)
=
{0-19 years}
+
{20-64 years}TD =DE+ DY
In brief
The evolution of dependency ratios suggests an increase in social expenditure in favour of older people.
Related issues
The variation in levels of dependency and the dete
-rioration of the ratio of young to older people are factors which will affect the costs and organisation of
the social protection system. The size of the impact will also largely depend on other factors such as
[image:7.590.52.543.511.709.2]growth, productivity and iob creation
n
Figure 2
Measure of demographic dependency -
EUR 1 5
Total dependency rate
(%)
Ratio of young people to elderly people80 2.5
r
-70
2.0 60
50
40
30
Scenarios:
n
c
a
n
l l
b
r
-1.5
1.0
20
0.5 10
0 0
1975 1995 2015 2015 2015 1975 1995 2015 2015 2015
Scenarios: a= continuation of present trend; b =maximum ageing; c =minimum ageing.
Source: Eurostot, Demographic projections, 1996.
(') See 'Some economic implications of demographic trends up to 2020', European Economy, No 56 (1994).
Demography and changes in the
active population
A closer analysis allows us to estimate the impact of changes to the age pyramid on the active population. How have changes in the size of each age group influ -enced the growth of the active population in the past and how will they influence it in the future? The results are set out in Figure 3.
On the basis of certain hypotheses, this analysis seeks to determine the factors leading to a change in the size of the working population for each of the three decades (see model in Annex Band explanation on data sources).
This change can be broken down into two factors:
• the 'demographic' factor, namely the variation in the population's age/sex structure and size alone (thus keeping the activity rates constant);
[image:8.589.37.518.280.731.2]• the 'behavioural' factor, namely the fact that levels of activity per age and sex change in time (thus the difference between the 'real' active population and the one obtained while keeping the activity rates constant).
Figure 3
Respective roles of the demographic factor and behavioural factor in producing changes in the size of the active population - EUR 12 and EUR 15
-
c
.2
-·-
E
-
"'
c
0
"'
~
G)
Q.
G)
>
·..;::::
"'
00
10
8
6
4
2
Increased particip.
+3100000
Demog. increase
+ 3 800 000
(+2.2%)
g
0
-r--~~~~
-:-e
"'0
Reduced particip.
-200 000
~-2+---~
:
"A~iiv~ p~p.:
-
~215o
ooo
~~----~-~---1
-4~---~
1985-95
1 99 5-2005
2005-15
•
Demographic effect
D
Behavioural effect
Sources: Eurostat, Demographic projections, 1996. Baseline scenario; Eurostat, Labour Ioree survey (EUR 12 1985·95, EUR 15 alter 1995); Eurostat, projections of activity
levels.
An analysis of past data allows for the following conclu
-sions:
• In the Europe of Twelve (1
), 9.4 million people joined
the active population between 1985 and 1995, a 7% growth rate. During this same period, demo-graphic change would have generated an increase of 9.6 million if it had been the sole factor, thus 200 000
more than actually recorded. This latter figure
indi-cates the extent of the participation decrease in the
labour market.
• Also between 1985 and 1995, the number of jobs
rose by just 8.5 million. As the number of active adults
increased more than the number of jobs, the
differ-ence represents the absolute increase in
unemploy-ment, that is 900 000 more unemployed in 1995
than in 1985
n
The same approach has been adopted for the develop
-ment of future scenarios.
Apart from the impact on employment and unemploy-ment, the following trends in active population are likely:
• We can expect to see the active population increase
by about 6.9 million by the year 2005, representing a lower rate of growth than during the preceding
pe-riod. Demographic change will contribute less to this
increase, 50% of which will be due to increased par-ticipation in the labour market.
• Over the following 1 0 years- 2005 to 2015 -the
active population could fall by as much as 2.15 mil
-lion. An expected demographic fall of 3.4 million
people will be partly offset by an extra 1 .25 million
people participating in the labour market.
Migratory flows could play a significant role in shaping
the future trends of the working age population
(3).
In thepast decade they have contributed to some extent to increasing the size and reducing the pace of ageing of the working age population.
(') Data an the active population of EUR 15 are only available from 1995.
In
brief
• Demographic change has placed additional
pres-sure on the labour market over the past 10 years because of a sharp increase in the labour supply.
Together with the growth in female participation
the result was an increase in the active popula
-tion.
• Even if participation in the labour market in
-creases, we will soon see a reduction in tensions
in the labour market due to the demographic fall.
• Changes in the levels of participation will play a
greater role in the future growth of the labour
force.
• Economic performance, productivity growth and
future migratory trends will also ploy o potentially
important role.
Related issues
Future trends of active population become a critical parameter for policy-making. The double objective to reduce unemployment and provide financially bal
-anced social protection systems would require a framework which stimulates and expands the partici
-pation of potential labour supply {mainly women and the working age population over 55) coupled with an effort to stimulate employment-rich growth.
(') Between 1985 and 1995, peak years for unemployment, the total number of unemployed people grew from around 15 million to 16.8 million, whereby about
900 000 are to be attributed to the new Lander which in this simulation are not taken into account.
(3) See Eurostat scenarios in Annex A.
Structure of the 20-64
age
group
In the above, trends in the population
of
working age andthe active population were seen to be closely linked. But what is the situation within this population?
Figure 4 shows that it is going to experience some major changes in age structure:
• A distinctive feature of the past 20 years has been the
entry of all the baby-boom generations to the
popula-tion of working age. This produced a major increase
in all age groups, especially the intermediate
30-49
age group.
• In contrast to this, the next 20 years will see
consider-able imbalances in the contribution of the various age
groups. The
20-29
age group, a group whichreplen-ishes the population of working age, will fall by 11
million, the intermediate group will remain at its
present size, and the oldest group
(50-64
years)will increase by 16.5 million, which is over 25 %.
In brief
Within the population of working age, the distinctive feature of the next 20 years will be a very unequal
growth between the different age groups, breaking
the balance of the past 20 years.
Related issues
The increased numbers of older workers will call for a new approach to all matters relating to the links
between age, labour market and work organisation. Working conditions, productivity and lifelong learn-ing will all be crucial issues.
Figure 4
Increase in certain age groups between 1975-95 and 1995-2015 -
EUR 15
30%.---~
25%
+
-20%
+
-15%
1
-10%
5%
-+---<---0%
+----5%
+
--10%
+
--15%
+ - - -
111111
Past:
1975-95
• Future:
1995-2015
- 20%
-'---
-====-
---l
[image:10.588.46.526.201.656.2]Ageing of the population
of working age
A further analysis is needed as the ageing indicators high-light two rupture points.
1995,
first rupture point
The size of the expected fall in the number of people aged between 20 and 29 coupled with the increase in those aged between 50 and 64 will result in a marked ageing of the available pool of labour.
The change in the average age of the population aged between 20 and 64, as illustrated in Figure 5, is an initial
indication of this changing trend.
• this average age scarcely changed during the years
1975-95, when it remained just over 40 years;
• since 1995 it has been a marked tendency for the average age to increase, as a comparison of the
curves' gradient for the two periods clearly illustrates;
• after having remained stable for the past 20 years,
the average age will increase by 2.5 years on
aver-age by the year 2015, a considerable increase.
In
brief
[image:11.589.130.455.347.595.2]Starting in 1995, and continuing beyond 2015, the
average age of the working age population will
show a considerable and constant increase.
Figure 5
Change in the average age of the population
of working age (20-64 years) -
EUR 15
43
.
"'
"'
~
42
,
,
;
,
,
G.)
,
1:»41
,
<(
,
,
"'
-
..
..
"'
..
"'
~ ~ ~-40
..
r--._
0.. 0..
39 I H-+-+-t-1-1 I 1---t-+-H--t H I 1-1-t-+--H I
ll) r--._ 0.. ('") ll) r--._ 0.. ('") ll) r--._ 0..
0 ('") ll) r--._ 0.. ('") ll)
r--._ r--._ t--._. <X) <X) <X) <X) <X) 0.. 0.. 0.. 0.. 0.. 0 0 0 0
0 0 0
0.. 0.. 0.. 0.. 0.. 0.. 0.. 0.. 0.. 0.. 0.. 0.. 0.. 0 0 0 0 0
~ ~ ~ ~ ~ ~ ~ ~ N N N N N N N N
2010, second rupture point
The second point relates to the relative share of those
expected to join the active population for the first time, i.e.
the 20-29 age group, compared with those who are close
to leaving it, i.e. the 55-64 age group. Figure 6 shows
that:
• the share of the 20-29 age group has been constantly
falling since the early 1990s, while around the year
2000 the share of the oldest group will start to rise;
• in 2010 the two groups will be level pegging, each
representing one fifth of the population of working
age;
• after this date, the oldest group in the active
popula-tion will account for a progressively larger share of
the active population than the 20-29 age group. At
the same time, the population of working age as a
whole will start to fall.
Figure 6
In brief
• From the year 20 7
0
onwards, older workers willaccount for a greater share of the population of
working age than younger workers whose share will progressively decrease.
• The intermediate group (30-54 years) will first
increase, then stabilise and later begin to fall due
to the knock-on effect of these changes.
Related issues
• Companies will be progressively faced with a new age pyramid in the labour force. This will mean that active employment policies will face new challenges in their effort to maximise the
value of human resources.
[image:12.588.82.466.439.693.2]• The relative share of the youngest and oldest groups of workers as part of the total population of working age will change, as will the relative share within the 30-54 age group which will con-sequently face similar problems.
Respective shares of the 20-29 and 55-64 age groups in the working age population
(20-64 years) -
EUR 15
28
%
-,---
--
---,
27
%
-26%
.
S are o 20-29 age group
h
f
25
%
-24
%
-23
%
22
%
21
%
-20
%
-19
%
-18
%
--
..
-
-
..
..
..
...
..
..
..
..
..
.
17
%
-
Share of 55-64 age group
16
%
-1.() co -..::t
"'
0 (") '()"' "'
co co co ()-.. 0.. ()-..0.. 0.. 0.. ()-.. ()-.. ()-.. 0.. ()-..
Source: Eurasia!, observations until1995, projections after that date. Baseline scenario.
/4
-
...
()-.. N 1.() co -..::t
()-.. 0 0 0
()-.. 0 0 0 0 0
Demographic impact on the renewal
of the population of working age
In the past, the renewal of the population of working age, i.e. the ability to replace generations leaving the labour market by those coming in to join it, has served to:
• supply the highest growth sectors;
• contribute to the system's productivity by virtue of the fact that young people have a lower cost/productivity ratio;
• make a contribution of new skills and flexibility in all sectors.
It is interesting to illustrate this renewal by means of two additional indicators. The first estimates the balance between incoming and outgoing flows (Figure 7a). This gives us a good idea of the change in the size of the pop-ulation of working age. The second, more qualitative, indicator examines the ratio between numbers joining and leaving the labour market (Figure 7b); this is essen-tially a replacement indicator.
• In terms of balances, the decrease which began in
1990
will result in more departures than entries byaround
2009.
.
• In terms
of
ratios, the replacement rate will fall by35
% over20
years: in1995
there were140
entries for1 00
departures; by2015
there will be90
entries for 100
departures, and thus a net deficit.In brief
• Progressively, there will be
less scope
to adiust the labour market by means of the flows of entries and departures.• Demographic change will produce negative
renewal balances for the population of working age. The possibilities of skill renewal due solely to the entry of young people will be limited.
Related issues
Measures to activate the available reserves in the
labour supply will have to be accompanied by
meas-ures to ensure better overall training of the labour
force motivation and
safety,
while simultaneouslyintroducing greater flexibility.
Figmc 7
7a- Differences between incoming
and outgoing flows for the population
of working age -
EUR 1 5
2000000~~~~~~~~~~~~~
1 500 000
1 000 000
500 000
0
(X) '<I"
(X) (X)o- o-
o-~ ~ ~
-500 000
"
0 C"?(X) o-
o-o- ~ ~
Balance= Entries- Departures
-<) o- N .,-,
o- o- 0 0 o- o- 0 0 N N
Source: Eurostat, observations until 1995, projections after that date. Baseline scenario.
7b -
Numbers joining the population
of working age for every 1 00 leaving -
EUR 15
Ill
160
Q)..
::::» r-..
..
140
0
-a.
Q)120
.,
-0 0100
-
..
Q)-a.
80
- 1-Ill Q)
'i:
..
60
- 1-c
Q)-
040
- 1-..
Q)20
..0 - 1
-E
::::»0
z
1975
1995
2015
Demographic effect and difference in
activity between men and women
Is it possible to determine in more detail how demo-graphic change is going to affect the active population? Some interesting findings are obtained by distinguishing by sex and age group, between the effects of demograph-ic change and behavioural change on the size of the active population.
The differences between generations, and especially between the sexes, are clearly marked:
• The increase in the total size of the active population
recorded between 1985 and 1995 is unequally dis
-tributed between the sexes, while the demographic contribution, which is similar between the sexes, is not
the same for all age groups.
• Between 1985 and 1995 entry to the labour market
fell by 200 000. This fall is principally attributed to the decline for men, and young men in particular. Employment among all young people aged between
20 and 29, regardless of sex, fell during this period.
This could in part result from the pronounced demo-graphic contribution of the preceding generations, which may have blocked their access to the labour
market, as well as from the long-term trend for
increased participation in education and training of the younger generations.
• There has been a sharp increase in employment
among women over 30 during this period. In the
inter-mediate group (30-49 years), more than 50 % of the
increase in active women recorded between 1985
and 1995 is due to the increased participation of
women in the labour market.
• Among older women workers, participation
behav-iour was responsible for virtually the entire increase in
activity.
• The demographic contribution among the youngest
workers has started to fall and, after 2005, it will only
be the oldest workers who will bring any increase due
to demographic change.
• In terms of behaviour, and still on the basis of the
hypotheses for changes to the active population, female participation will continue to increase, even among younger generations. By contrast, between
2005 and 201 0, there will be reduced male
partici-pation in all age groups.
f(,
In brief
• The separation between the behavioural effect and demographic effect reveals the change in the size of reserves in the labour supply produced by demographic effects.
• Among young people, in particular, it will cease to be possible to offset the demographic fall by increased participation.
• Apart from the potential offered by occupational and geographical mobility, women constitute the main resource for employment growth, especially young women, who, when they grow older, will bring a higher participation and employment rate.
Related issues
• Maintaining older women's employability and their re-entry into work after some years of home work must take into account the specific character-istics of these groups and will require appropriate adjustment measures, not only in terms of work
organisation, but also to the social environment.
• The growing importance of work for women
means that, more than ever before, the question of
equal opportunities is
a
fundamental dimension ofeconomic and social change.
• All types of mobility, especially occupational mobility, will play a greater role in the years to
Figure 8
Respective roles of the demographic factor and the behavioural factor in producing changes in the
size of the active population, per age group and gender, for three periods - EUR 1 2 and EUR 15
I Males 20-29 years
2.---.
-2
-3 950 000
- 3600 000 1---l
-350 000
-10
1985-95 1995-2005 2005-15
• Demographic effect D Behavioural effect [Males 30-49 years
I
10.---~
8
4
-3400000 -3 300000 -100000
2
0
-2+---1985-95 1995-2005 2005-15
l
Males 50-64 years!10.---~
8
6
4
2
1985-95 1995-2005 2005-15
I Females 20-29 years
2.---~
-10
-12
Act. pop.:
Dem. eff.
Beh. eff.
-1400 000 -650000 -750000
1985-95 1995-2005 2005-15
I Females 30-49 years
I
10.---,
8 -~-r---,-~Act.~~~+~3~a~oo~omoo~----~
+2 200000 + 1 600 000
6
4 -1 700 000
-3100000
2
0
-2
-4
1985-95 1995-2005 2005-15
I Females 50-64 years
I
108
6
4
2
0
-2
-4
1985-95 1995-2005 2005-15
An additional dimension: family and work
The links between activity rates and the demography of the family and households have been shown by a number of
studies
t).
For a number of women, the birth of a child means that they stop working
or,in certain cases, seek
alterna-tive part-time employment. Depending on the country, this change prompted by the birth of a child can sometimes be
permanent, and for any number of reasons, ranging from the availability of childcare services to cultural factors.
With increased life expectancy, it is not unusual to find three or four generations living at the same time, and the
~increased rate of demographic ageing is set to make this even
morecommon. Within the family structure it is usually the
woman who cares for elderly people when they become dependent. In future, this burden of responsibility is likely to
increase as smaller families mean that the task is spread among fewer individuals.
The household itself has a determining influence on the life-cycle career of the individuals who constitute it. Taxation,
family benefits, employment management policies and other factors will all have a major impact on the behaviour of
family members.
Under these conditions, trends in the demography of families and households are going to influence the ability to
acti-vate the labour force, and the female labour force in particular, while on the other hand employment policies have an
impact on family trends and women.
Conclusion
The analysis of changes in the population of working age reveals the extent to which future economic growth will be dependent on quantitative and qualitative changes in the labour force.
The stabilisation and then fall in the size of the population of working age could prove a favourable factor in reduc-ing imbalances between labour supply and labour demand. However, it will also be necessary to deal with a considerable increase in the pressure of ageing on social protection, especially for pay-as-you-go pension systems. Keeping older workers in employment for longer could be, in certain sectors, a key eleme'nt for at least partially countering this problem.
However, keeping older workers in employment for more years will add to a second concern linked to the demog-raphy of the labour force: its internal ageing. Thus, adapt-ability to labour demand changes will have to be obtained more from resources already in the labour force
rather than from new cohorts joining the labour market. Active measures, such as re-qualification, lifelong learn-ing, and measures to ensure employability, will be required in order to adapt skills and ensure economic competitiveness.
Stronger economic growth is becoming a fundamental factor in supporting social protection, provided this growth translates into an increase in jobs and increased recourse to existing pools
of
labour. For women, in particu-lar, this recourse is subject to certain constraints. An inno-vative approach will be necessary, including measures to promote access to the traditional employment market (rec-onciliation of work and family life), the absorption of hith-erto exclusively voluntary activities by the market econ-omy (community actions, responsibility for family care through tax incentives, etc.), and more flexible work organisation. All types of mobility will play a greater role during the years to come.I') See, among others, 'The new role of women- Family formation in modern societies' edited by Hans-~eter Blossfeld, Social inequality series, Westview Press, 1994 or
The significance of the regional dimension
The previous part showed that there are important links between demographic change and the labour market. However, the aggregate approach often fails to provide the most effective means of examining these links. Among other things, it is not suitable for understanding the widely differing trends at regional level.
The strongly diverging situations found among regions suggest that the impact of demographic change could be open to different interpretations than that provided by the aggregate approach.
This is confirmed by the regional analysis presented in this part.
Geographical areas
For
reasons
which relate primarily to the availability of statistical data, the geographical breakdown used in this partis
NUTS 2.These breakdowns imply certain limitations in the present
analysis.
They do not make it possible to take into account the true mechanisms at work in certain regions delimited by such factorsas
local labour pools or particular areas of activity. This is why we have opted for a generic rather than specific interpretation of the results of ouranalyses.
Demographic growth in the regions
The Union's regional diversity can be illustrated with refer-ence to many criteria. Among the most visible aspects is the uneven population distribution, with a large share of the population concentrated in a comparatively small part of the territory. Possible population change, as illustrated in Map 1, is also of particular interest. Among other things, it helps to highlight differences in future demo-graphic patterns between regions.
This is particularly interesting because, as shown in Part 1, a stage characterised by a constant and balanced demographic increase in the population of working age is now giving way to one of 'demographic neutrality', soon to be followed by one of negative growth.
Map 1 shows the growth index for each region compared with its population in 1995. On the basis of their stage of
demographic growth, regions can be grouped under three headings:
• regions which have already reached the negative growth stage, such as the former East Germany, Saar-land and part of Westphalia, northern Italy, Asturias and Aragon in Spain, and Lorraine in France;
• the vast majority of the regions are likely to go towards a period of demographic increase between 1995 and 2015;
• finally, sustained growth is found in about one fifth
of
the regions, located in greater urban districts and in the south of Spain, France, Germany, Belgium and Greece.In brief
• Most of the Union countries show an uneven
regional pattern of future demographic growth.
• The same country can present a variety of situa-tions in terms of demographic dynamism.
• Regions with similar characteristics tend to form a
cluster with neighbouring regions.
Related issues
The effect of polarisation in terms of the population
growth of regions
is
a new dimension which couldinfluence national and even Community economic, social and environmental trends.
Map 1
Population growth between 1995 and 2015
EUR 15
NUTS
2
Base 100 = 1995
< 97.5
• 97.5 to 102.5 • 102.5 to 110
• > 110
Source: Eurostat, Demographic projections, 1997-Baseline scenario.
Population ageing
Although there is a marked difference between the regions in terms of the stage of population growth they have reached, ageing is a phenomenon common to all of them. Since 1995, the proportion of people aged over 65 has been increasing in all areas. The results of this growth of the older population are presented in Maps 2a and 2b which illustrate the proportion of people aged over 65 as part of the total population.
By 2015, the following developments are likely:
• As expected, the rate of ageing and, above all, the current population structures vary from one region to another.
• The proportion of elderly people will be particularly high in northern and central Italy where they will account for a quarter of the population.
• To a lesser degree, there will also be a preponder-ance of elderly people in northern Spain and, in a more dispersed way, in northern and eastern Ger-many, Greece and central and southern regions of France.
• The regions which will still have a relatively younger population will be more limited in number and more localised. The areas in question are southern Spain and northern Portugal, Ireland, northern France and Flevoland.
In brief
• Although apparent everywhere, population
age-ing will occur at varyage-ing rates and degrees, affect-ing populations with very different initial age structures. The result in 20 years time will be a greater diversity of age structure in the regions.
• Ageing does not necessarily result in a population
decrease. In 20 15 significant population in-creases will be coupled with a quite old pop-ulation structure.
• The combination of a considerable fall in
popula-tion and a much older populapopula-tion, as found in northern Italy and Spain, and in the former East Germany, suggests significant demographic decline.
• As mentioned in Part 1, the future prospects are
also potentially influenced by economic perfor-mance and migratory flows at regional/eve/.
Related issues
• An ageing population is often associated with a
Fall in the proportion of young people.
Conse-quently, trends in dependency rates are likely to
result in even wider differences between regions. This divergence determines a new regional reality concerning the labour market, housing, health and care needs.
• The polarisation of dependence may result in
increased costs and greater difficulties for the
development of certain regions. This may be felt
not only in economic terms but also in ecological terms, especially if there is further growth of urbanisation and rural depopulation. This may have implications for structural policies at Euro-pean level, as well as for efforts to promote an
improvement in the territorial balances across the Union as a whole.
Map2a
Proportion of people aged 65 years and over as part of total population in 1995
EUR 15
NUTS 2
1995
< 16%
• 16 to 18 %
• 18 to 20 %
• > 20%
.
f
Source: Eurostat, Demographic projections, 1997-Baseline scenario.
}lap
2b
Proportion of people aged 65 years and over as part of total population in 2015
EUR 15
NU
T
S 2
2015
< 16%
• 16 to 18%
• 18 to 20%
• >20%
Source: Eurostat, Demographic projections, 1997- Baseline scenario.
The regional development
of the active population
It has been seen that the older population will grow sub-stantially in most European regions over the next decades. This is becoming a major concern since the population which must bear this extra cost is simultaneously shrink-ing. Map 3 gives, at regional level, the year when the active population is expected to start to fall for demo-graphic reasons. In other words, it shows the dates when the net demographic contribution to the active population will cease. The methodological basis used is the same as for the global analysis in Part 1 (see Annex B).
• Several geographical areas, including the whole of southern Germany, France and the United Kingdom, will find that over the next two decades natural demo-graphic change will increase the numbers in the labour force.
• Three major geographically compact areas will find themselves in exactly the opposite situation with a sub-stantial reduction of the potential labour supply by the end of the century. The regions in question are the whole of Italy lying north of Molise, all areas of north-ern Spain lying between Catalonia and Galicia, and North-Rhine Westphalia, Saarland, Lorraine and Flanders.
• The analysis of the year in which a decrease of the active population, for demographic reasons, will start shows two separate peaks. On the one hand, many regions will experience a reversal of trends before or shortly after the turn of the century. On the other hand, many regions will experience this after 2010. Very few regions will see trends reverse during the period 2000-10.
24
In brief
• There is a 1 0-year difference between the regions in terms of the reduction of the potential labour supply.
• Several groups of regions have already
experi-enced a decrease in ·the demographic contribu-tion to the active populacontribu-tion. This increases the risk of a labour shortage in certain areas.
Related issues
• The prospect of a reversal of demographic trends
which divide Europe's regions naturally raises the
question of mobility.
• The demographic situation reinforces the need to
continue national and EU structural policies to pro-mote the most effective use of the resources avail-able through raising labour force qualification and promoting productive investment and mobility of all factors.
• The mobilisation of potential in the labour supply
will imply the provision of a whole range of skills and qualifications. It will therefore be necessary to consider the training policy suited to the regional
Map;~
Year in which the active population will start to fall due to demographic reasons
EUR 15
NUTS
2
(UK: NUTS 1)
Year of occurrence
between 1995 and 1999
• between 2000 and 2004
• between 2005 and 2009
• between 201 0 and 2014
• not before 20 15
Source: Eurostat, Demographic projections, 1997-Baseline scenario.
Ageing of the working· age population
Another aspect of ageing has implications for the labour market, namely the ageing of potential labour forces. In this section, estimates are based on the population aged between 15 and 64 years, as these are the only age groups for which the statistics used are available.
Map 4 shows the rate of ageing, with a growth index for the 50-64 age group ranging from 1 05 to 160% between 1995 and 2015:
• The French, Dutch, Belgian and Irish regions show a very high rate of ageing within the population of working age.
• Regions with an initially elderly population (Germany, northern Italy) show a more moderate ageing of the active population.
• Irrespective of the rate of ageing, the analysis of the age structure of active persons (share of over-45s with-in the 15-64 age group) shows that it is with-in the German regions that the population of working age is likely to be the oldest in the Union in 20 years' time. In those regions more than 40% of the population aged 15-64 are over 44.
• In nearly all the other regions, the 45-64 age group will represent more than a third of the population of working age.
• A lower proportion of 25 %will only be found in five isolated areas in 2015: southern Spain, Ireland, Brit-tany, Nord-Pas-de-Calais and half of the Benelux regions.
26
In brief
• Combined with the fall in the demographic
contri-bution, the general ageing of the population of working age amplifies the regional significance of this phenomenon for the labour market.
• Germany and Italy generally show
a
more pro-nounced ageing of the population of working age.• With the exception of certain isolated areas, this
phenomenon also affects, with a different timing, all Europe's regions.
Related issues
• In the economic sphere, since the phenomenon of
the ageing of the working age population is felt more acutely at regional level, specific actions
may be needed, on the basis of regional
sector-based specialisation and labour market condi-tions.
• In more general social terms, depending on
demographic characteristics, specific policies
may be needed to take care of regional demands
Map4
Growth in the population aged between
SO
and 64 years between 1995 and 201 5EUR 15
NUTS 2
Base100=1995
< 107.5
• 107.5 to 125
• 125 to 142.5
• > 142.5
.
f
Source: Eurostat, Demographic projections, 1997- Baseline scenario.
Conclusion
Three underlying trends relating to demographic effects have been identified:
• the major difference between the regional picture and national situation;
• the polarisation of certain demographic and eco-nomic trends with implications for the convergence process;
• the potential demographic imbalances which could undermine the functioning of the labour market due to a labour shortage.
28
Part
:l
I
Demographic trends in the applicant States
Union enlargement is one of the maior milestones on the road to European integration. Over the next years at least some of the 12 present applicant States could find their
place within the European Union (see footnote 2, p. 5,
concerning Malta).
It is therefore only fitting to complete our outline of the principal demographic challenges facing the Union with a
brief review of the demographic future which awaits these
countries.
The aim here is not to undertake a detailed analysis but
rather to identify points on which these countries converge
or diverge, both with respect to one another and to
the present EU countries, in terms of the challenges
which their respective demographic development could
generate.
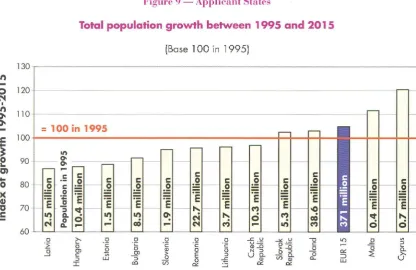
Total population trends
What is the demographic picture of these countries in economic transition? An initial indicator, given in Figure 9, measures the population growth index between 1995 and 2015. An almost general lack of growth is observed:
• whereas between 1995 and 2015 the Union is going
to see a population increase despite the demographic slowdown, this will hold true for iust four of the
candi-date States: Poland and the Slovak Republic, Cyprus
and Malta;
• if Cyprus and Malta, whose small population renders
the increase incomparable with the others, are
ex-cluded, all the applicant countries will have demo
[image:27.590.90.507.410.680.2]-graphic growth inferior to that of the Union.
Figure 9 - Applicant States
130
"'
...
0 120
("14 I
r.n
110 0. 0....
.c
100j
0 90
""
C)
-
0 80><
Q) ""0 70
1:
60
Total population growth between 1995 and 2015
(Base 100 in 1995)
=
100 in 19950 >-. 0 0 0
.E 0 ·c: '§ ·c:
~ Q)
0 OJ OJ >
--' c :; 0
:::J UJ
:r: cO V5
0 0 ....c v -"' v -o
·c: ·c: u.:..= Q)_Q o= c
>_Q 0
0 0 N :::J 0 :::J 0
E :::J
v
0.. - 0..0
-=
Q) V) Q) c..0!. :.:::; 0!. 0!.
Sources: United Notions, World population prospect 1996 (applicant States); Eurostat, Demographic projections, 1996. Baseline scenario (EUR 15).
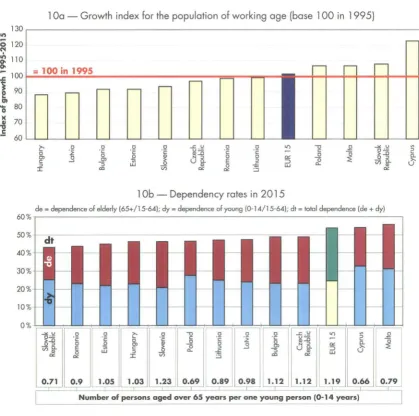
The population of working age
What will be the implications of demographic change for the labour market in the applicant States? As in the case of the previous analyses, the principal conclusions can be drawn from two indicators: dependency rates and the growth of the population of working age. The results, pre-sented in Figure 1 0, allow for the following conclusions:
• Some of those countries set to experience a fall in total population over the next 20 years will also experience a significant fall in the population of working age over this same period.
• Poland and the Slovak Republic will see the popula
-tion of working age grow at a faster rate than the total population.
• Dependency ratios provide a more detailed view of the differences between countries in terms of demo-graphic ageing. The dependence of older people in all the applicant States is lower than in the Union. Five of them nevertheless have a higher proportion of older people than young people, with relatively high depen-dency rates (Estonia, Hungary, Slovenia, Bulgaria and the Czech Republic).
[image:28.592.81.501.349.765.2]• Poland and the Slovak Republic are worthy of particu-lar note among the countries with a younger popula-tion structure.
Figure
10-
Applicant States
Development indicators for the population of working age ( 15-64 years) between 1995 and 2015
1 Oa- Growth index for the population of working age (base 1 00 in 1995)
130,---~
11'1
-0 120
N
110
J, o-0.
-
100
~=~1~0~0~i~n~1~9~9~5~---~~--~~--l
901:11
0
80~ 70
"U
~ 60
~
~L-
-L
~--~
-L
--~
~
--L-
~~
~--
-L
~--~-L-->.. 0 m c: ::> I 0 ·;::
.a
lJ.J-"' u
u~
Q>...O
N ::> ua. ~ 0 ·;:: 0 E ci1 0 ·;:: 0 ::> -£ :.:::;
1 Ob- Dependency rates in 2015
de= dependence of elderly (65+/15-64); dy =dependence of young (0-14/15-64); dt =total dependence (de+ dy)
60%.---~--~
30% 20% 10% 0 ·;:: 0 E ci1 0 ·;::
.a
lJ.J >.. 0 m c: ::> Ia "'0 a
·;:: c: ·;::
~ 0
.,.,
a a ::> -£Vi :.:::;
Sources: United Nations, World population prospect 1996 (applicant States); Eurostat, Demographic projections, 1996. Baseline scenario (EUR 15).
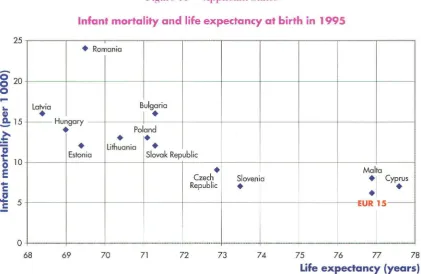
Demographic characteristics
The observed slower demographic growth for most of the east European States is explained by the low fertility rates, the high mortality rates and the important migratory out
-flows, observed over the last few years. Total fertility rates have declined substantially over the last decade bringing some of these States to levels below the EU average.
However, demographic ageing is not so advanced in these States because of their relatively higher mortality patterns.
These patterns refer to children under one year of age (high infant mortality rates) and the most elderly members of the population.
Figure
l l
plots each country with reference to two vari-ables which, generally speaking, serve as a development indicator.• Leaving aside atypical cases such as Malta and Cyprus, with a very different history of social and economic development than the
l
0 other applicant States, major efforts are needed in order to reduce this mortality.• Slovenia and the Czech Republic seem to have made progress in this respect, with infant mortality rates of below
l
0 perl
000. [image:29.591.85.507.350.624.2]• Romania has very high infant mortality rates and a quite low life expectancy. Together with the Baltic States and Hungary, it has the poorest performance in terms of life expectancy.
FigTm' 11 -Applicant States
-
..
Cl) 25..!;
15.
~
~
0 10E
...
c
.2
5c
0
Infant mortality and life expectancy at birth in 1995
+
RomaniaLatvia Bulgaria
•
i
•
-Hungary
•
Poland• •
•
Lithuania•
Estonia Slovak Republic•
MaltaCzech Slovenia
:
r
CyprusRepublic
•
•
EUR 15
-68 69 70 71 72 73 74 75 76 77 78
Life expectancy {years)
Sources: United Nations, World populolion prosped 1996 (applicant States(; Eurasia!, Demographic statistics, 1997 (EUR 15).
Conclusion
Although it will come later and to a lesser degree, popula-tion ageing will also affect east European countries. In half of these States demographic trends have already opened the door to increased pressure on the social pro-tection system which even now is experiencing difficulties.
These States are also going to experience a sometimes significant fall in the population of working age, herald-ing problems of a similar nature to those with which the European Union will be faced after 2010. A future of
S2
sustained growth would require the activation of the exist-ing labour force reserves. Developments in Poland and the Slovak Republic might be somewhat different. Sus-tained economic growth and job creation will be required. The gulf between the cities and the countryside may pose a special challenge in these States.
Annexes
A- Scenarios for the future development of the EU population (1995-2015)
Average number of children per woman
1995 2000 2005 2010 2015
High 1.50 1.75 1.87 1.91 1.92
Low 1.42 1.40 1.40 1.40 1.41
Baseline 1.45 1.55 1.60 1.63 1.64
Old 1.42 1.40 1.40 1.40 1.41
Young 1.50 1.75 1.87 1.91 1.92
Life expectancy at birth (men}
1995 2000 2005 2010 2015
High 74.3 75.5 76.9 78.1 79.2
Low 73.5 73.9 74.3 74.7 75.0
Baseline 73.9 74.7 75.6 76.4 77.2
Old 74.3 75.5 76.9 78.1 79.2
Young 73.5 73.9 74.3 74.7 75.0
Life expectancy at birth (women}
1995 2000 2005 2010 2015
High 80.7 81.7 82.7 83.7 84.4
Low 80.1 80.5 80.9 81.3 81.5
Baseline 80.4 81.1 81.9 82.5 83.1
Old 80.7 81.7 82.7 83.7 84.4
Young 80.1 80.5 80.9 81.3 81.5
Annual migration balance [ 1 000}
1995·99 2000·4 2005·9 2010·14
High 934 977 840 788
Low 527 391 388 396
Baseline 719 654 605 592
Old 527 391 388 396
B - Method of calculating the demographic and behavioural effect (activity
rate effect) in changes in the active population
On the basis of the population aged between 15 and 64 per year of age and per gender in 1995, and demographic projections for the population aged between 15 and 64 per year of age and gender up to 20 l5,for each gender we have:
for
and for ari,t
AP-I, 1
the following relations:
AP-I, 1
population aged between 15 and 64 in year t
population of age i in year t (i ranging from 15 to 64 years)
percentage of age i complement in 15-64 age group complement in year t, the vector
(015 , a64lt defining the structure per age in year t, so that Pi,t /
P
1=
ai,t withI:
ai=
1 for yeartactivity rate for year of age i in year t
active population of age i in year t
total active population (15 to 64 years) in year t
and the variation in the active population between two different dates as follows:
MP
demographic effect activity rate effect residue
that is the sum of the two effects:
• an activity rate effect, expressed by the variation in the active population with a constant 15-64 age group comple-ment and constant age structure; this expresses the degree of participation in employcomple-ment of a given complecomple-ment;
• a demographic effect, expressed by the variation in the active population with a constant activity rate per year of age; this demographic effect combines an effect linked to the complement and an effect linked to its age compo-sition.
As the method was applied to each of the Union countries, the residual factor e linked to the discrete nature of the time series has never exceeded 2.5 %of the total variation. It was ignored in the analysis of results .
European Commission
Demographic report- 1997
Luxembourg: Office for Official Publications of the European Communities 1998-34 pp.-21 x 29.7 em
ISBN 92-828-0872-6