Int. J. Electrochem. Sci., 6 (2011) 2551 - 2565
International Journal of
ELECTROCHEMICAL
SCIENCE
www.electrochemsci.org
Effect of Dispersion Solvent in Catalyst Ink on Proton Exchange
Membrane Fuel Cell Performance
De-Chin Huang1, Pei-Jung Yu1, Feng-Jiin Liu1, Shu-Ling Huang1, Kan-Lin Hsueh1,2,3,*, Yen-Cho Chen2, Chun-Hsing Wu3, Wen-Chen Chang3, Fang-Hei Tsau3
1
National United University (NUU), Department of Chemical Engineering, Miaoli,Taiwan 2
National United University (NUU), Department of Energy and Resources, Miaoli, Taiwan 3
Industrial Technology Research Institute (ITRI), Energy and Environmental Research Laboratories, Chutung, Taiwan
*
E-mail: [email protected]
Received: 11 April 2011 / Accepted: 10 June 2011 / Published: 1 July 2011
The effects of dispersion solvents in catalyst ink on performance of the membrane electrode assembly (MEA) for proton exchange membrane fuel cell are studied. Dispersion solvents under examination are water, ethylene glycol, glycerin, propylene glycols, and methanol. These solvents cover a wide range property of dielectric constant, boiling points, and viscosity. We examine the rheology behaviors of catalyst ink prepared with these solvents. Both anode and cathode of the MEA are made by using doctor-blade method to spread catalyst ink onto the gas diffusion layers. The single cell with prepared MEA is measured by linear scanning voltammetry to evaluate the discharge characteristics, by cyclic voltammetry to evaluate catalyst utilization, and electrochemical impedance spectroscopy to evaluate internal resistance. A semi-empirical equation is use to analyze the voltage losses due to activation over-potential and internal resistance. We find that ethylene glycol was the best dispersion agent among organic solvents tested. The power density of the single cell is able to reach the maximum power density of 1,428 mA (mg Pt)-1 at hot-pressed temperature of 135 oC, and 1200psi for 90 seconds.
Keywords: Proton exchange membrane fuel cell, membrane electrode assemble, electrochemical impedance spectroscopy, linear scanning voltammetry
1. INTRODUCTION
performance of MEA. The structure, as well as the manufacturing process of MEA, plays a significant role on its characteristics.
Mehta and Cooper made a comprehensive literature collection on MEA manufacturing methods [1]. Litster and McLean briefly review the effects of MEA fabrication conditions on its polarization curve [2]. In the early stage of MEA development, Polytetrafluoroethylene (PTFE, Teflon) was used as the binder in the catalyst layer and catalyst loading was in the order of 10 mg cm-2. Ticianelli et al. [3] impregnated ionomer (Nafion) into the catalyst layer, which significantly reduced platinum loading below 1 mg cm-2 without sacrificing the cell output power density. In the other words, ionomer improved the catalyst utilization. At present, catalyst loading is in the range of 0.2 – 0.6 mg cm-2. Three most popular coating processes are used for coating of the catalyst layer of MEA. They are the decal method [4], catalyst coating membrane (CCM) process [5], and gas diffusion electrode (GDE) process [6]. In the decal method, the catalyst ink is coated on a Teflon sheet. The catalyst is transferred to the membrane by hot-pressing the catalyst contained Teflon sheet against the membrane. Then, the Teflon sheet is pear away. As for the CCM process, the catalyst ink is sprayed directly onto the membrane. During the spraying, the solvent is evaporated. Last is the GDE process. In this case, the catalyst ink is spread on a carbon substrate. Proper dispersion of Nafion ionomer and catalyst particle is one of the critical factors for the MEA power density and catalyst utilization.
particles. The particle in the ink with high viscosity is more stable than in the ink with low viscosity. Depending on the coating method, viscous ink is preferred for doctor blade spreading and thinner ink is preferred for nuzzle spraying. Solvents with a high boiling point have a low evaporation rate and make the ink more stable during coating, although, it is difficult to remove afterward.
This work studied the effects of dispersed solvents on MEA performance. Processing conditions, such as hot press temperature and pressure, were also studied. Solvents being observed included water, methanol, ethylene glycol, glycerin, 1,2-propylene glycol, and 1,3-propylene glycol. These are straight carbon chain (carbon number from 1-3) with various number of hydroxyl group (OH number form 1-3). We were able to measure the rheology of catalyst inks prepared from these solvents. The polarization curves of MEA prepared from these solvents were compared among each other. A commercial MEA was used as the reference. These polarization curves were curve fitting with a semi-empirical equation. Voltage losses due to activation polarization, internal resistance, and concentration polarization were separated by this semi-empirical equation analysis. Cyclic voltammetry was also carried out to calculate the catalyst active area of each MEA. Electrochemical impedance spectroscopy was used to analyze the voltage losses of each MEA. The impedance result was compared with the analysis results obtained from semi-empirical equation.
2. EXPERIMENTAL
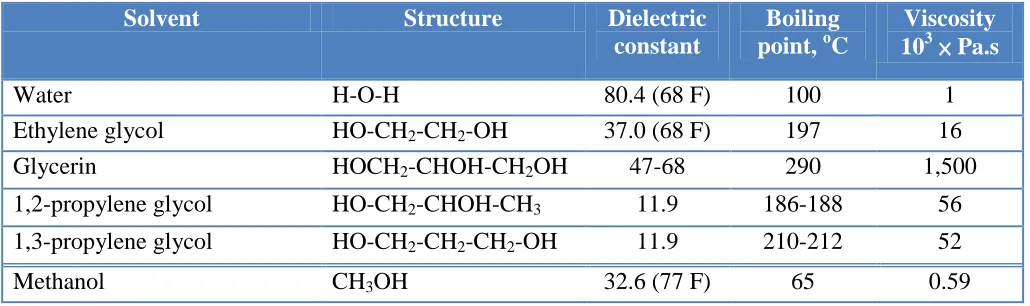
All the catalyst inks were prepared by the following procedure. Nafion solution (Du Pont, DE-2021, 5 wt%) was mixed with solvent first. Water, methanol, ethylene glycol, glycerin, 1,2-propylene glycol, and 1,3-propylene glycol were the solvents used. Table 1 listed their molecular structure, dielectric constant, and boiling points. The weight ratio of mixture was 1.25 to 2 for all the solvents. This solution was placed in an ice bath for 30 minutes before adding the catalyst. The platinum loaded carbon powder obtained from E-Tek (20 wt.% Pt loading on Vulcan XR-72R, Pt/C) was placed in a container and was immersed in ice bath for 30 minutes.
[image:3.596.42.557.585.738.2]
Table 1. List of structure, dielectric constant, and boiling point of dispersion solvent used in this study.
Solvent Structure Dielectric
constant
Boiling
point, oC
Viscosity 103 × Pa.s
Water H-O-H 80.4 (68 F) 100 1
Ethylene glycol HO-CH2-CH2-OH 37.0 (68 F) 197 16
Glycerin HOCH2-CHOH-CH2OH 47-68 290 1,500
1,2-propylene glycol HO-CH2-CHOH-CH3 11.9 186-188 56
1,3-propylene glycol HO-CH2-CH2-CH2-OH 11.9 210-212 52
Methanol CH3OH 32.6 (77 F) 65 0.59
The purpose of the ice bath was to reduce the temperature of both the solution and catalyst so that heating or ignition during the mixing was eliminated. The Pt/C catalyst was then mixed with the solution inside a satellite mixer for 1.5 minutes. The catalyst ink was ready for rheology measurement and for coating on the electrode.
A programmable Rheometer (Brookfield, DV III+) with cone-and-plate probe was used to measure the ink viscosity as a function of shear rate. The rotating speed of cone-and-plate probe was incrementally increased from 20 rpm to 200 rpm and then was incrementally decreased from 200 rpm to 20 rpm. The rotating speed was held for 30 seconds for each probe speed. Every 30 seconds, the probe speed increased 20 rpm or decreased 20 rpm to the next measurement.
Doctor blade method was used to coat the catalyst ink onto a 3 3 cm2
carbon paper from SGL (24BC). Micro-cracks were observed on the micro-porous layer side of carbon paper. A pre-treatment procedure was used to smooth out the micro-porous layer. The paper was coated with a layer of carbon (Vulcan XR-72R) and then was spread with ethanol. This pre-treated carbon paper was dried under ambient temperature for 30 minutes. Catalyst ink was spread on the carbon paper substrate by doctor blade method (All Real Technology, BCD100). The coating gap (thickness of wet film) was controlled at 170 m for cathode and at 140 m for anode. This coated electrode was then placed in a vacuum oven (Deng Yng, DOU30) at a temperature of 100 oC for 12 hours. Once finished, the electrodes were ready for hot pressing. To ensure that all the solvents inside the electrode were evaporated, a TGA (thermal gradient analysis, Las Navas Instrument, TGA-2000) was used. The temperature of TGA was programmed from 25 oC to 1,000 oC at temperature scanning rate of 10 oC min-1. The surface morphology of electrode was monitored by an optical microscope (Olympus, 9K01138) and by SEM (scanning electron microscopy, JSM-6700F). Hydrophobicity of the coated electrode was measured by the contact angle of water drop on the electrode surface (APPR, BV-7105EN).
The anode, Nafion membrane, and cathode were aligned for hot pressing with a hot presser (GoTech, GT-7014-10C). Hot pressing temperature was 115 oC, 125 oC, 135 oC, 145 oC, and 165 oC. Hot pressing pressure was 1,000, 1,100, 1,200, 1,400, and 1,500 psi. All the MEAs were timed for 90 seconds.
The performance of the MEA was measured with a single cell. A fuel cell test station (designed and assembled by ITRI, Industrial Technology Research Institute) was used to control all the testing conditions and to measure the MEA performance. Three electrochemical measurements were carried out: linear scanning voltammetry, cyclic voltammetry, and electrochemical impedance spectroscopy.
During linear scanning voltammetry measurement, the cell temperature was kept at 65 oC. Both anode and cathode gas humidification temperatures were set at 80 oC. Anode hydrogen flow rate was 104 ml min-1 and cathode oxygen flow rate was 70 ml min-1. Before testing, a constant current load was used to activate the cell for 6 hours. After the cell voltage was stabilized, the cell voltage was linearly scanned from open circuit voltage to 0.3 V at a scanning rate of 1.67 mV s-1.
electrode during the measurement. Electrode potential was scanned between 0.1 V and 1.2 V at a scanning rate of 20 mV s-1.
For the electrochemical impedance measurement, the gas inlet conditions (humidification temperature, flow rate etc.) as well as the cell activation and operating conditions were the same as the linear scanning measurement. To avoid possible error from the electric loading instrument, impedance measurement was carried out at the open circuit voltage with test station cables disconnected. The frequency of AC signal was swept from 100 kHz to 10 Hz and with 10 mV amplitude.
3. RESULTS AND DISCUSSION
3.1. Rheology behavior of catalyst ink
Many polymers, ceramic materials, and particles containing liquid mixtures were non-Newtonian fluid. Their fluid dynamic behavior could be described by equation (1) where the shear stress () was proportional to the shear rate () with the nth
power. The rheometer measured the shear stress as a function of shear rate with a cone-and-plate probe.
n n1 ( 1 )
The apparent viscosity (a) was equal to (/) and then calculated. According to this equation (1), the viscosity was a function of the shear rate with (n-1)th power as given by the following equation:
1
n
a
( 2 )
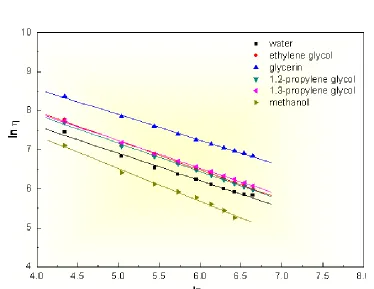
For Newtonian flow, n = 1 and the apparent viscosity was independent of . For pseudo-plastic fluid or shear thickening fluid, n > 1, the viscosity was increased as the shear rate increased. For shear thinning fluid, n < 1, the viscosity was decreased as the shear rate increased. The fluid dynamic behaviors of prepared catalyst ink were measured and results were depicted on Fig.1. Equation (2) could be re-written as given by equation (3).
According to the above equation, the plot of logarithmic kinematic viscosity against the logarithmic shear rate would yield a straight line. As shown on Fig. 1, at a given shear rate, the viscosity of catalyst ink was in the order of glycerin > propylene glycols and ethylene glycol > water > methanol.
Table 2. Calculated value of “n” from the rheology data of catalyst ink with different dispersion solvent.
Solvent n R2
Water 0.49 0.96
Ethylene glycol 0.47 0.96
Glycerin 0.55 0.98
1.3-propylene glycol 0.41 0.97
1.2-propylene glycol 0.39 0.97
[image:6.596.79.511.95.608.2]Methanol 0.21 0.99
Figure 1. Plot of logarithm viscosity versus logarithm
ln
( 1) ln
ln a n ( 3 )
3.2. Effects of dispersion solvent on the electrode characteristics
[image:6.596.115.489.296.585.2]
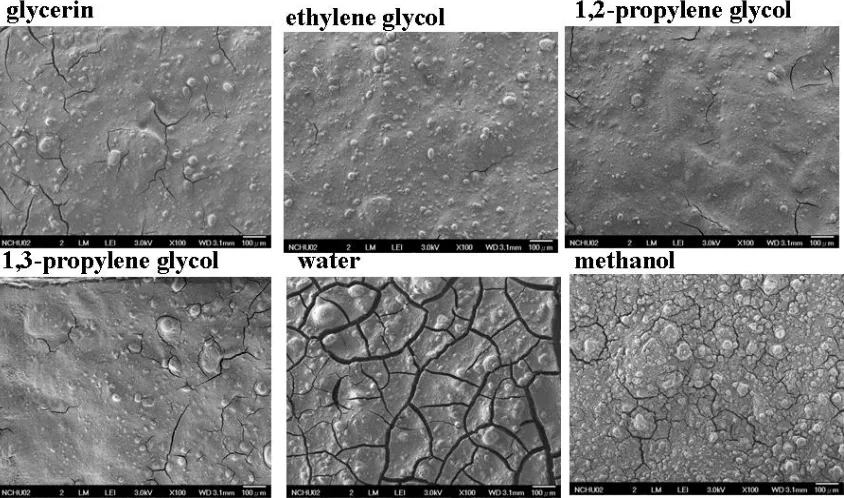
Figure 2. Surface morphology of catalyst layer coated with ink containing (a) glycerin, (b) ethylene glycol, (c) 1,2-propylene glycol, (d) 1,3-propylene glycol, (e) water, and (f) methanol.
Figure 2 was the morphology picture of catalyst layer. These layers were coated from catalyst ink containing different dispersion solvents. Ink containing a high boiling point solvents (186 ~ 212 o
C), such as glycerin, ethylene glycol, and propylene glycols, had less cracks than inks containing a low boiling point solvent (65 ~ 100 oC), such as water and methanol. The low boiling point solvent evaporated much faster than the high boiling point solvent during the coating of catalyst ink. High drying speed caused surface cracks.
From the rheology measurement and optical microscopy observation, solvents with methanol and water were the worst catalyst ink. The catalyst was not well dispersed in the solvent and large cracks were noticed right after the catalyst layer dried.
3.3. Effects of dispersion solvent on the single cell performance
Two identical electrodes were used for the MEA, one for anode and the other for cathode. The anode, Nafion membrane, and cathode were aligned and then hot pressed to form MEA. The MEA was then assembled into a single cell. This single cell was used for linear scanning voltammetry, cyclic voltammetry, and electrochemical impedance measurements. Results were discussed in the following.
[image:7.596.89.511.76.325.2]
for glycerin, 917 for E-Tek, 850 for 1,2-propylene glycol, 800 for 1,3-propylene glycol, and 354 for methanol.
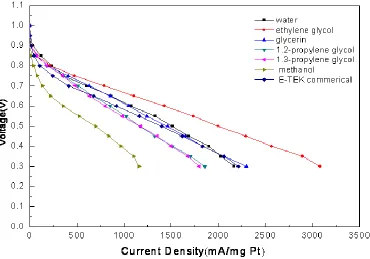
Figure 3. Polarization curve of single cell for different MEA. Each curve was the MEA made from dispersion solvent in the catalyst ink. MEA processing condition was at hot press temperature 135 oC, pressure 1200 psi for 90 seconds. Single cell testing condition was at cell temperature 65 oC, anode gas flow rate 100 ml min-1, humidification temperature 80 oC, cathode gas flow rate 77 ml min-1, and humidification temperature 80 oC.
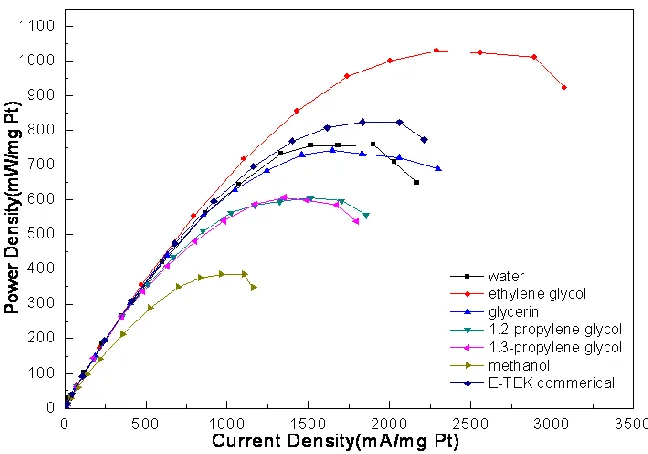
The power density in terms of mW mg-1 of Pt was plotted as a function of current density (mA mg-1 of Pt) on Fig. 4. The maximum power density (mW mg-1 Pt) of individual MEA were 1,030 for ethylene glycol, 824 for E-Tek, 760 for water, 742 for glycerin, 606 for 1,3-propylene glycol, 604 for 1,2-propylene glycol, and 385 for methanol. From Fig. 3 and 4, the MEA made from the catalyst ink with ethylene glycol or water had better power output than MEA with other solvents. A semi-empirical equation (Eq. 4 and 5) was used to analyze the voltage loss due to either electrode activation loss or internal resistance. The cell voltage (E) was a function of the current density (i). Parameter “b” was the Tafel slope and Rint was the internal resistance. The parameter “a” contained the open circuit cell voltage (Eo) and exchanging current density (io). The R, T, and F were the universal gas constant, cell temperature, and Faraday constant, respectively.
i R i b a
E ln int (4)
F n
T R b and i
F n
T R E
[image:8.596.114.484.136.395.2]
Parameter values of a, b, and Rint were calculated from the measured data by least square curve fitting, as listed on Table 3. The values of “a” were around 0.84 ± 0.03, except for methanol. Low value of “a” for the MEA with methanol as the dispersion solvent, represented a significant voltage drop in the low current density region as shown on Fig. 3. The internal resistance (Rint) was the slope of the linear portion of measured data (also shown on Fig. 3). It played a major role on the cell output power density.
Figure 4. Plot of power density as function of current density for different MEA. Each curve was the MEA made from dispersion solvent in the catalyst ink. Measurement was carried out at the same MEA processing condition and single cell testing condition as given on Fig. 3.
Table 3. List of electrode active area. They were calculated from the integration area of hydrogen absorption peaks from the cyclic voltammetry data of single cell with different MEAs. MEA processing condition was at hot press temperature 135 oC, pressure 1200 psi for 90 seconds.
Solvent a b Rint
Water 0.87 0.052 0.034
Ethylene glycol 0.85 0.046 0.024
Glycerin 0.86 0.034 0.035
1.2-propylene glycol 0.86 0.040 0.042
1.3-propylene glycol 0.85 0.043 0.043
Methanol 0.74 0.011 0.042
E-TEK commercial 0.81 0.066 0.029
Parameter values of MEA prepared from catalyst ink with different dispersion solvents were compared. MEA processing
conditions were the same as the one given on Table 3. Single cell testing condition was at cell temperature 65 oC, anode
gas flow rate 100 ml min-1, humidification temperature 80 oC, cathode gas flow rate 77 ml min-1, and humidification
[image:9.596.136.460.198.425.2] [image:9.596.91.498.581.709.2]
The Rint value was in the order of ethylene glycol, E-Tek < water, glycerin < 1,2-propylene glycol, 1,3-propylene glycol, and methanol. This was consistent with the result shown on Fig. 3 and 4 that MEA with ethylene glycol, glycerin, or water had higher power density than MEA with other solvents.
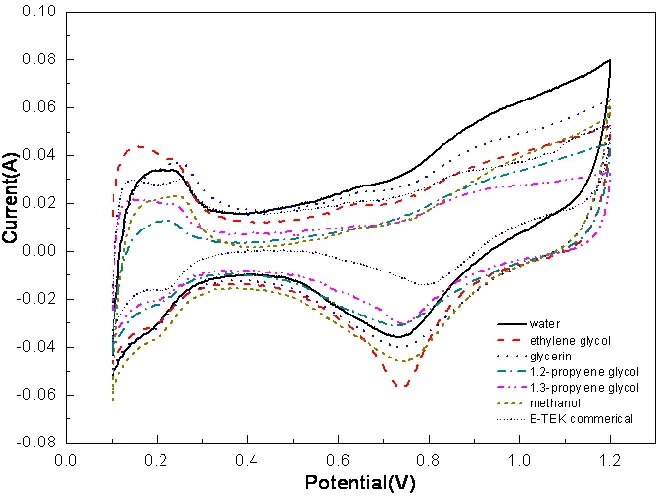
The cyclic voltammetry results of different MEA were given on Fig. 5.
Figure 5. Cyclic voltammetry of single cell with different MEA. The scanning rate was 20 mV s-1.
Table 4. Calculated parameter value of “a”, “b”, and “R” of the semi-empirical equation (4) from single cell measurement data. Parameter values of MEA prepared from catalyst ink with different dispersion solvents were compared. MEA processing conditions were the same as the one given on Table 3. Single cell testing condition was at cell temperature 65 oC, anode gas flow rate 100 ml min-1, humidification temperature 80 oC, cathode gas flow rate 77 ml min-1, and humidification temperature 80 oC.
Solvent Integral area Active area
(cm2)
Water 0.0057 27
Ethylene glycol 0.0076 36
Glycerin 0.0075 35
1.2-propylene glycol 0.0017 8
1.3-propylene glycol 0.0036 17
Methanol 0.0034 16
E-TEK commercial 0.0059 28
They were calculated from the integration area of hydrogen absorption peaks from the cyclic voltammetry data of single
cell with different MEAs. MEA processing condition was at hot press temperature 135 oC, pressure 1200 psi for 90
[image:10.596.124.454.187.436.2] [image:10.596.83.511.593.720.2]
Peak areas of the potential region between 0.1 – 0.3 V were integrated and values were listed on Table 4.
The catalyst active area was calculated based on the integrated value. The active area was in the order of ethylene glycol, glycerin > E-Tek, water > 1,3-propylene glycol, methanol > 1,2-propylene glycol. Ethylene glycol and glycerin had the highest electrode active area among others. This suggested that electrode using ethylene glycol or glycerin as the solvent had a better utilization of catalyst.
0.00 0.05 0.10 0.15 0.20 0.25
0.00 0.05 0.10 0.15 0.20
0.005 0.006 0.007 0.008 0.009 0.010 0.000 0.002 0.004 0.006 0.008 0.010 water ethyleneglycol glycerin 1.2-propylene glycol 1.3-propylene glycol methanol sample
Zi
m
(oh
m
s)
Zre(ohms)
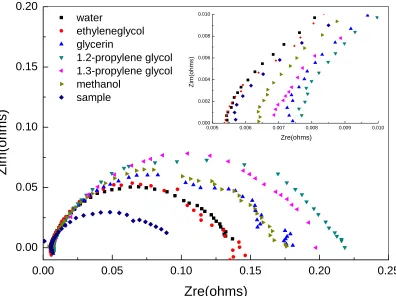
Z im (o h m s ) Zre(ohms)Figure 6. Electrochemical impedance spectra of a single cell with different MEAs. Measurement was carried out at the same MEA processing condition and single cell testing condition as given on Fig. 3.
[image:11.596.116.512.225.523.2][image:12.596.89.501.239.378.2]
almost the same. This suggested that the solvent was completely removed from the MEA. It was then re-confirmed by a set of separated thermogravimetric analysis. The charge transfer resistance, Rct, was in the order of E-Tek < ethylene glycol, water < glycerin, methanol < 1,2-propylene glycol, 1,3-propylene glycol. MEA with ethylene glycol and water had a lower charge transfer resistance than MEA with other solvents.
Table 5. Charge transfer resistance and internal resistance calculated from electrochemical impedance data of single cell with different MEAs. MEA processing condition was the same as the one given on Table 3.
Solvent Rct (Ω) Rs (mΩ)
Water 0.132 5.4
Ethylene glycol 0.131 5.3
Glycerin 0.155 7.4
1.2-propylene glycol 0.212 7.6
1.3-propylene glycol 0.197 8.1
Methanol 0.163 6.3
E-TEK commercial 0.089 5.7
MEA processing condition was the same as the one given on Table 3.
The MEA using ethylene glycol as the dispersion solvent had the best power density, whereas MEA using methanol as the solvent had the worst power density among all solvents tested. We attributed this result due to following factors: The catalyst ink containing ethylene glycol had better dispersion and uniform fluid dynamic property as given by the rheology measurement. This was further supported with the evidence that a higher active surface was obtained from the cyclic voltammetry measurement for ethylene glycol and glycerin. The electrode surface coated with ethylene glycol ink had less cracks compared to the one coated with methanol ink. The ethylene glycol had a higher boiling point than methanol (set table 1). This resulted in a stable ethylene glycol ink where the solvent was not likely to evaporate during coating. The ethylene glycol was completely removed during the vacuum drying process. This was verified by thermogravimetric analysis.
However, there was a discrepancy between the impedance data and conclusion we made from linear scanning and cyclic voltammetry data. The internal resistances (Rint in the range of 24 – 43 mΩ) obtained from linear scanning fitting data (listed on Table 3) were one order of magnitude higher than the series resistance (Rs in the range of 5-8 mΩ) acquired from impedance fitting data (listed on table 5). In our experience, the linear scanning fitted Rint was the overall internal resistance of single cell, which included the following two categories:
(1) Bulk resistance of membrane, graphite plate, carbon paper and (2) Interfacial resistance
(b) Between electrode and graphite plate.
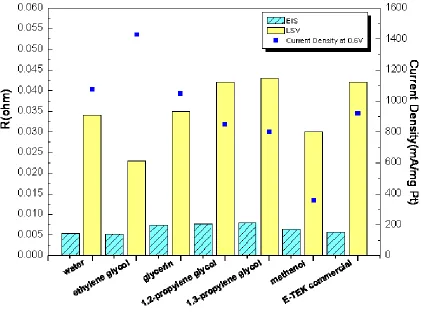
The Rs calculated from impedance data was mainly the bulk resistance. Therefore, the value of Rint from linear scanning data was always larger than the Rs from impedance data (Refer to Fig. 7 for comparison). The current density at cell voltage of 0.6 V was also plotted on the same figure. The difference between Rint and Rs could be treated as the interfacial resistance. MEA with ethylene glycol had the lowest Rint and the lowest value of Rint-Rs among different solvents. This also corresponded to the highest current density among all the MEA tested.
Figure 7. Plot of cell resistance calculated from the polarization curve data as well as from the electrochemical impedance spectroscopy data. Single cell resistance of MEA made from different catalyst dispersion solvents were compared on this diagram. Resistance Measurement was carried out at the same MEA processing condition and single cell testing condition as given on Fig. 3.
4. CONCLUSION
[image:13.596.89.510.238.550.2]
covered a wide range property of dielectric constant, boiling point, and viscosity. These properties had a major impact on the MEA power output. We have evaluated the uniformity of catalyst dispersion by examining the rheology behaviors of catalyst ink prepared with these solvents. Both anode and cathode of the MEA were made by using doctor-blade method to spread catalyst ink onto the gas diffusion layers. The single cell performance was measured by linear scanning voltammetry. Using a semi-empirical equation, we were able to compare cell voltage losses due to activation over-potential and internal resistance of MEA made with different dispersion solvents. Electrode effective Pt areas were evaluated from cyclic voltammetry data. Electrochemical impedance spectroscopy was also used to characterize the electrochemical properties of the single cell. We found that ethylene glycol is the best dispersion agent among organic solvents tested. The Pt catalyst and Nafion ionomer had better dispersion in ethylene glycol due to its high dielectric constant and viscosity. The ink containing ethylene glycol was more stable during doctor-blade coating because of the high boiling point of the ethylene glycol. Electrode ink mixed with ethylene glycol as the dispersion agent has higher Pt active area. The power density of the single cell was able to reach the maximum power density of 1,428 mA (mg Pt)-1 at hot-pressed temperature of 135 oC, and 1200psi for 90 seconds.
ACKNOWLEDGEMENT
This work was completed at National United University under the research contract from Industrial Research Technology Institute/Energy and Environmental Research Laboratories. The authors would like to thank the Bureau of Energy, Ministry of Economic Affairs, Taiwan, for the financial support on hydrogen and fuel cell program.
NOMENCLATURE
Symbol Meanings
a Parameter of semi-empirical equation (4)
b Parameter of semi-empirical equation (4)
E Cell voltage, V
Eo Open circuit voltage, V
F Faraday constant, 96500 C/equivalent
i Current density, mA mg-1 Pt
Io Exchange current density, mA mg
-1 Pt
n Equivalent, 4
R Universal gas constant, 8.314
Rint Internal resistance calculated from semi-empirical equation, Ω
Rs Series resistance measure from impedance data, Ω
T Temperature, K
Greek
α Charge transfer coefficient
γ Shear stress
η Viscosity
References
1. V.Mehta and J.S. Cooper, J Power Sources, 114 (2003) 32 2. S. Litster and G. McLean, J. Power Sources, 130 (2004) 61
3. E.A. Ticianelli, C.R. Derouin, A. Redondo, S. Srinivasan, J. Electrochem. Soc., 135, (1988) 2209 4. M.S. Wilson, S. Gottesfeld, J. Appl. Electrochem., 22 (1992) 1
5. M.S. Wilson, J.A. Valerio, S. Gottesfeld, Electrochimica Acta, 40 (1995) 355-363.
6. M. Uchida, Y. Fukuoka, Y. Sugawara, H. Ohara, A. Ohta, J. Electrochem. Soc., 145 (1998) 3708-3713.
7. Y-G. Chun, C-S. Kim, D-H. Peck, D-R. Shin, J. power Sources, 71 (1998) 174-178.
8. S-J. Shin, J-K. Lee, H-Y. Ha, S-A. Hong, H-S. Chun, I-H. Oh, I-H., J. Power Sources, 106 (2002) 146-152.
9. T-H. Yang, Y-G. Yoon, G-G. Park, W-Y. Lee, C-S. Kim, J. Power Sources, 127 (2004) 230-233. 10.R. Fernandez, P. Ferreira-Aparicio, L. Daza, J. Power Sources, 151 (2005) 18-24.
11.R.H. Perry, D.W. Green, “Chemical Engineers’ Handbook”, 8th Edition, McGraw-Hill, (2007)