EN
1
EN
COMMISSION OF THE EUROPEAN COMMUNITIES
Brussels, 10.7.2008
SEC (2008) 2293
COMMISSIO STAFF WORKIG DOCUMET
PROGRESS TOWARDS THE LISBO OBJECTIVES I EDUCATIO AD TRAIIG
Indicators and benchmarks
Content
ITRODUCTIO
A. Performance and progress of European education
and training systems since 2000
B. Monitoring performance and progress
1. Making lifelong learning a reality
2. Developing school education
3. Developing vocational education and training
4. Developing higher education
5. Key competences for lifelong learning
6. Improving equity in education and training
7. Employability
8. Investment in education and training
C. The coherent framework of indicators and benchmarks
Development of new indicators.
References Acronyms
List of publications
Preface
Preface
“Progress towards the Lisbon objectives in education and training” is the 5th annual report examining performance and progress under the Education and Training 2010 Work Programme.
The purpose of this report is to provide strategic guidance for the Education and Training 2010 Work Programme on the basis of indicators, benchmarks and research results. The report sets out progress towards the objectives agreed by the Council. The Progress Reports for 2004, 2005, 2006 and 2007 were able to give more and more detailed analysis of performance and progress as data and research material became available.
On 25th May 2007 the Education Council adopted conclusions on a coherent framework of 16 core indicators for monitoring progress towards the Lisbon objectives in education and training (European Council, 2007a). The 2007 and 2008 Reports have used these core indicators, reinforced by contextual data and research results.
Reflecting these indicators and the political priorities of the Education and Training 2010 programme, the main part of the 2008 report (Part B.) is structured in eight chapters as follows:
1. Making lifelong learning a reality 2. Developing school education
3. Developing vocational education and training
4. Developing higher education
5. Key competences for lifelong learning 6. Improving equity in education and
training 7. Employability
8. Investment in education and training;
The Report indicates the direction in which European education systems are moving and how their contribution towards meeting Europe's Lisbon objectives is developing.
World beating performance is found within some areas of EU education and training. At the same time, many Member States are challenged in particular fields. The Report shows that the best policy practice already existing within the EU could add value if it could inspire more general improvement. The Report helps point to the scope for exchanging information and policy experience. It also points to the scope for further improving the framework of indicators and benchmarks which underpins it.
PART A: Performance and progress of European education and training systems since 2000
PART A Performance and progress of European education and training systems
since 2000
1. The policy framework – The Lisbon strategy
2. Progress towards five benchmarks for 2010
3. Best performing countries: Learning from good practice
PART A: Performance and progress of European education and training systems since 2000
MAI MESSAGES 2008
• Performance of the European Union in education and training levels with the best in the World such as Australia, New Zealand, Canada, US and Korea. However the overall performance of the EU masks wide divergence between Member States.
• 60% of 5-29 years old participate in schools and higher education. This is comparable to the US and 18% higher than in Japan.
• There are about 3 million more students in higher education and 1 million more graduates per year than in 2000.
• There are 13 million more higher education graduates in the working age population than in 2000.
• Almost 108 million people still have low educational attainment - about 1/3 of the labour force.
• There are still important inequities in European educational systems.
− 6 million young people, 1 in 7 of 18-24 years old, achieve only compulsory education or less.
− 25-64 year-olds are 3 times more likely to participate in lifelong learning if they have completed at least upper secondary education.
− 1 in 7 of the 4 year-olds are not enrolled in education. Many of these are in high need categories, such as children with migrant background or from families with low socio-economic status.
− Gender inequalities remain. Boys do less well at reading and have more special education needs. Girls do less well at mathematics and are underrepresented among mathematics, science and technology students and graduates.
• The EU set itself the overall ambition of achieving 5 benchmarks by 2010, on literacy, reduction of early school-leaving, upper secondary attainment, maths, science and technology graduates and participation in adult learning. Only the benchmark on mathematics, science and technology graduates is likely to be exceeded. Indeed, low performance in reading literacy, which was benchmarked to decline by 20% by 2010, has actually increased by more than 10% between 2000 and 2006 and has reached 24.1 %.
• Education and training in the EU is improving slowly but steadily. Yet there are significant divergences between Member States and fields.
− All countries have relative strength and weakness in the five benchmark areas.
− Finland, Denmark, Sweden, the United Kingdom, Ireland, Poland, Slovenia, Norway and Iceland exceed the composite objective of the five benchmarks set for 2010 and are progressing in yearly averages; while France, the Netherlands, Belgium, have average performance below the composite objective and have not made progress.
PART A: Performance and progress of European education and training systems since 2000
1. The policy framework - the Lisbon strategy
Education and training have an important place in the integrated guidelines for delivering the revised Lisbon strategy for jobs and growth.
As part of this overall strategy, the Council set out broad common objectives for the education and training systems of the EU. The Education and Training 2010 Work Programme supports the actions of the Member States to achieve these objectives. It is implemented through the open method of coordination, using indicators and benchmarks to support evidence-based policy making and to monitor progress.
The Council in May 2007 identified a framework of 16 core indicators for monitoring progress towards the Lisbon objectives.
Sixteen core indicators for monitoring progress towards the Lisbon objectives
Participation in pre-school
education
Special needs education
Early school leavers
Literacy in reading, mathematics
and science
Language skills
ICT skills
Civic skills
Learning to learn skills
Upper secondary completion rates
of young people
Professional development of
teachers and trainers
Higher education graduates
Cross-national mobility of students
in higher education
Participation of adults in lifelong
learning
Adult skills
Educational attainment of the
population
Investment in education and
training
These indicators enable the Commission and the Member States to:
• underpin key policy messages;
• analyse progress both at the EU and national levels;
• identify good performance for peer review and exchange; and
• compare performance with third countries.
In order to guide progress on the Education and Training 2010 Work Programme, the Council adopted 5 benchmarks to be achieved by 2010.
Five EU benchmarks for 2010
o more than 10% early school
leavers;
Decrease of at least 20% in the
percentage of low-achieving pupils in reading literacy;
At least 85% of young people should
have completed upper secondary education;
Increase of at least 15% in the
number of tertiary graduates in Mathematics, Science and Technology (MST), with a
simultaneous decrease in the gender imbalance;
12.5% of the adult population
should participate in lifelong learning.
The core indicators cover the whole learning continuum from pre-school to adult education, teachers' professional development and investment in education and training.
Not all the data for these indicators are fully available yet. In most of these areas, new surveys are being prepared.
Indicators never tell the full story. But they help to identify differences, similarities and trends and to provide a starting point for further analysis in order to understand better performance and progress.
2. Progress towards five benchmarks for 2010
PART A: Performance and progress of European education and training systems since 2000
there is broad progress, attaining the benchmarks on early school leaving, completion of upper secondary education and lifelong learning will need more effective
national initiatives. Indeed, the situation is getting worse for reading literacy of young people, the benchmark in the field of key competences. (Chart A.1.)1
Chart A.1 Progress towards meeting the five benchmarks for 2010 (EU average)
Progress towards meeting the 5 benchmarks (EU average)
-80 -70 -60 -50 -40 -30 -20 -10 0 10 20 30 40 50 60 70 80 90 100 110 120 130 140
2000 2001 2002 2003 2004 2005 2006 2007 2008 2009 2010
Year
2
0
1
0
b
e
n
c
h
m
a
rk
s
=
1
0
0
MST graduates
Lifelong learning participation
Early school leavers
Upper secondary completion
Low achievers in reading
progress required
181
(below 0 = performance getting worse)
Source: DG Education and Culture
In this chart the starting point (in 2000) is set at zero and the 2010 benchmark at 100. The results achieved each year are measured against the 2010 benchmark (= 100). The diagonal line shows the progress required, i.e. an additional 1/10 (10%) of progress towards the benchmark has to be achieved each year to reach the benchmark. If a line stays below this diagonal line, progress is not sufficient; if it is above the diagonal line progress is stronger than what is needed to achieve the benchmark. If the line declines, the problem is getting worse.
In the case of lifelong learning, it should be kept in mind that there have been many breaks in the time series, which tend to overstate the progress made, especially in 2003. Therefore the 2002-2003 line on LLL participation is dotted. For low achievers in reading (data from the PISA survey) there are results for 18 EU countries for only two data points, 2000 and 2006. it is therefore not yet possible to assess to what extend the observed differences are indicative of longer-term trends
Chart A.2 gives an overview of the average performance levels and progress of countries across the 5 benchmark areas (giving them equal weights). Most countries are progressing: their overall performance in the benchmark areas is improving. Finland, Sweden, Denmark, the United Kingdom, Ireland, Poland Slovenia, Norway and Iceland are
pulling further ahead. However 4 countries, France, the Netherlands, Belgium and Spain, have an average performance across the five benchmarks areas below the 2010 targets and are falling behind.
PART A: Performance and progress of European education and training systems since 2000
Chart A.2 : Average levels of country performance (2006) and progress (2000-2006) across the five benchmark areas
Source : CRELL/Joint Research Centers 2008 Benchmark for 2010= 100 (Performance) a
Average Performance (2006) b
Average annual growth (2000-06) %. (Average yearly growth across the five benchmarks)
In the case of the indicators on low achievers and Early school leavers the average growth rate is multiplied by (-1) to take into account that a negative growth rate is a plus for the country.
Average country performance and progress (2000-2006) (Chart A 2)
The quadrant: "Moving further ahead" includes countries that have performance levels in 2006 above the composite 2010 target, and have been progressing (yearly average) during the period. The quadrant: "Falling further behind" includes countries that in 2006 have performance below the 2010 composite target and have negative average levels of progress during the period.
Performance and progress of countries in each of the benchmark areas are shown in the graphics A.3-7. The following indicators have been applied (Chart A.2-7)
Low achievers: Percentage of pupils with reading literacy proficiency level 1 and lower on the PISA reading literacy scale Early school leavers: Share of 18-24 year-olds with only lower secondary education or less and not in education or training Upper secondary completion: Percentage of 20-24 year-olds with at least upper secondary education
MST graduates: Total number of MST graduates / per 1000 of the population, 20 – 29 year-olds.
Life long learning participation: Percentage of population aged 25-64 year-olds participating in education and training in the four weeks prior to the survey.
Sources: Eurostat (UOE, LFS); OECD/PISA
Average of the 5 benchmarks
DK
BE BG
CZ DE
EE
IE EL
ES
FR IT
CY
LV
LT
LU
HU MT
NL AT
PL
PT
RO
SI
SK
FI SE
UK HR
TR
IS
NO EU27
-2 0 2 4 6 8
20 60 100 140 180
Performance a
P
ro
g
re
s
s
b
Catching up Moving further ahead
Falling further behind Losing momentum
PART A: Performance and progress of European education and training systems since 2000
Charts A.3-7Country performance (2006) and progress (2000-2006) in all five benchmark areas
Low achievers DK ES PL NO BE BG CZ DE IE EL FR IT LV LU HU NL AT PT RO SK FI SE TR EU19 -15 -5 5 15
0 50 100 150 200 250 300 350 Performance
(benchmark = 100)
P ro g re s s (a v e ra g e 0 0 -0 6 o f a n n u a l g ro w th , % )
Catching up Moving further ahead
Falling further behind Loosing momentum
0
large countries medium countries small countries
Early School Leavers
ES PL NO BE BG CZ DK DEEE IE EL FR IT CY LV LT LU HU MT NL AT PT RO SI SK FI SE UK HR TR IS EU27 -15 -5 5 15
0 50 100 150 200 250
Performance (benchmark = 100)
P ro g re s s (a v e ra g e 0 0 -0 6 o f a n n u a l g ro w th , % )
Catching up Moving further ahead
Falling further behind Loosing momentum
0
large countries medium countries sm all countries
Upper secondary completion
DK ES PL NO BE BG CZ DE EE IE EL FR IT CY LV LT LU HU MT NL AT PT RO SI SK FI SE UK HR TR IS EU27 -4
40 50 60 70 80 90 100 110 120
Performance (benchmark = 100)
P ro g re s s (a v e ra g e 0 0 -0 6 o f a n n u a l g ro w th , % )
Catching up Moving further ahead
Falling further behind Loosing momentum
0 large countries medium countries small countries MST graduates DK ES PL BE BG CZ DE EE IE EL FR IT CY LV LT HU MT NL AT PT RO SI SK FI SE UK HR TR IS NO EU27 FYRM -10 0 10 20
0 50 100 150
Performance (benchmark = 100)
P ro g re s s (a v e ra g e 0 0 -0 6 o f a n n u a l g ro w th , % )
Catching up Moving further ahead
PART A: Performance and progress of European education and training systems since 2000
Lifelong learning participation
DK ES PL NO BE BG CZ DE EE IE EL FR IT CY LV LT LU HU MT NL AT PT RO SI SK FI SE UK HR TR IS EU27 -6 4 14
0 50 100 150 200 250
Performance (benchmark = 100)
P ro g re s s (a v e ra g e 0 0 -0 6 o f a n n u a l g ro w th , % )
Catching up Moving further ahead
Falling further behind Loosing momentum
0
large countries medium countries small countries
EU progress and performance on the benchmark on Low Achievers in reading literacy (the rate to be reduced by at least 20%). The EU performance levels are worsening. (Chart A.6) Only Denmark, Poland and especially Finland are moving ahead with performance levels above the EU benchmark. Other countries (Ireland, the Netherlands and Sweden) have high performance above the benchmark but have not progressed further during the period (Chart A.3).
EU progress and performance on the benchmark for Early school leavers (rates to be reduced to 10% by 2010) are stronger in some new Member States: Croatia, Slovenia, Poland, the Czech Republic and to a lesser degree Austria. Finland and Slovakia are also above the EU benchmark in performance but not progressing further and even have a decreasing performance in the field. (Chart A.4)
Progress and performance on the benchmark of upper secondary completion rates – the benchmark needs to reach 85% by 2010, (Chart A.5) – is the strongest in Poland,
Croatia and Lithuania. The performances in Slovakia and Norway are also significantly above the EU benchmark in the field but not progressing further and their performance has in fact decreased somewhat in recent years Completion rates in Germany and Spain are falling further behind compared to the performance and progress of other countries in the EU in the field.
In the case of the benchmark on Mathematics, Science and Technology graduates – to increase the number of graduates by 15% - the EU is performing above the level expected for 2010 – increasing.(Chart A.6). All countries are increasing the number of graduates in Mathematics, Science and Technology as compared with 2000 and the majority of them are close or above the 2010 target. Four big countries (United Kingdom, France, Poland and Italy) are driving the EU average with both high levels of performance and progress. However, gender imbalance among MST graduates is still pronounced, especially in engineering and computing.
When it comes to lifelong learning participation of adults (to reach 12.5% by 2010) one observes vast difference between countries as concerns both performance levels and progress. (Chart A.7) The highest performers are the Nordic countries (Sweden, Denmark, Finland and Norway), as well as the UK, Slovenia and Austria, all of which have performance levels above the EU benchmark for 2010 and still progressing. The performance of the Netherlands and Iceland has of similar high levels but progress has stopped.
PART A: Performance and progress of European education and training systems since 2000
further ahead in four of the five areas and that Austria, Denmark, Finland, Slovenia and
Sweden show that level of performance and progress in three areas.
Chart A.8 Country performance progress in each Benchmark area
Early school leavers
Lifelong learning Upper secondary education
MST Graduates
Low performers in reading
literacy
EU
Belgium
Bulgaria
Czech Republic
Denmark
Germany
Estonia
Ireland
Greece
Spain
France
Italy
Cyprus
Latvia
Lithuania
Luxembourg
Hungary
Malta
Netherlands
Austria
Poland
Portugal
Romania
Slovenia
Slovakia
Finland
Sweden
United Kingdom
Croatia
Turkey
Iceland
Norway
Legend :
ABOVE EU
BECHMARK
BELOW EU
BECHMARK
ICREASIG PERFORMACE
MOVIG FURTHER
AHEAD
CATCHIG UP
DECREASIG PERFORMACE
LOOSIG MOMETUM
PART A: Performance and progress of European education and training systems since 2000
3. Best performing countries: Learning from good practice
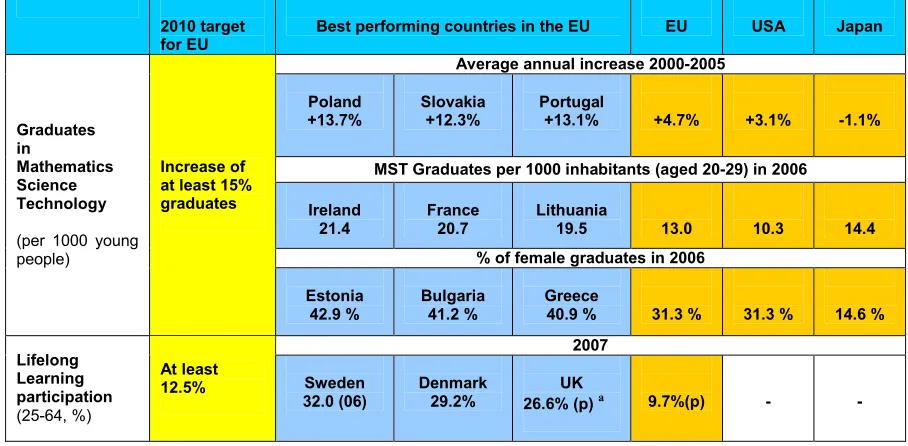
All Member States can learn from the best performers in the Union. Therefore it is important to complete the above analysis by looking at the details in the benchmark areas and in other core indicator areas (See Tables A.9 to 11).
[image:12.595.70.526.221.475.2]This is why the Council asked for the three best performing countries (leaders) in specific policy areas to be identified.Half the Member States are leaders in at least one benchmark area. There is quite a spread of good practice and expertise in the EU. Three more countries are among the leaders on investment in human resources and pre-school participation, core indicators for which the Council set targets.
Table A.9: Best performing countries on benchmark relating to school education (2007)
Target for 2010
Best performing countries in the EU EU USA Japan
Change in the percentage of low achievers in % (2000-2006)
Finlanda -31.4%
Poland -30.2%
Latvia
-29.6% +13.1% - +82.2%
Share of low achievers a Low-achievers in reading (15-year-olds, %) At least 20% decrease Finland 4.8% Ireland 12.1% Estonia
13.6% 24.1% - 18.4%
Early school leavers (18-24) %) No more than 10% Poland 5.0% Czech Rep. 5.5% a
Slovakia
7.2% 14.8% - -
Upper secondary attainment (20-24, %).
At least
85% Czech Rep. 91.8% Poland 91.6% Slovenia 91.5% 78.1% - -
a : 2006;
Source: DG education and culture
Data sources: Eurostat UOE and LFS; OECD/Pisa
Table A.10: Best performing countries on benchmarks relating to higher education and lifelong learning
2010 target for EU
Best performing countries in the EU EU USA Japan
Average annual increase 2000-2005
Poland +13.7%
Slovakia +12.3%
Portugal
+13.1% +4.7% +3.1% -1.1%
MST Graduates per 1000 inhabitants (aged 20-29) in 2006
Ireland 21.4
France 20.7
Lithuania
19.5 13.0 10.3 14.4
% of female graduates in 2006 Graduates
in
Mathematics Science Technology
(per 1000 young people)
Increase of at least 15% graduates Estonia 42.9 % Bulgaria 41.2 % Greece
40.9 % 31.3 % 31.3 % 14.6 %
2007 Lifelong Learning participation (25-64, %) At least
12.5% Sweden
32.0 (06)
Denmark 29.2%
UK
26.6% (p) a 9.7%(p) - -
a
: 2006, p: provisional
[image:12.595.68.522.517.740.2]PART A: Performance and progress of European education and training systems since 2000
Table A.11: Best performing countries on other selected core indicator areas
Best performing countries in the EU EU USA Japan
Participation of 4-year-olds in pre-primary education, 2006 Participation in
pre-school education
France 100%
Italy 100%
Belgium
100% 86.8% 58.2% 94.8%
Public spending on education as a % of GDP, 2005
Denmark 8.28
Sweden 6.97
Cyprus
6.92 5.03 4.85 3.52
Increase in public spending on education, in percentage points of GDP (2000-2005) Investment in
education and training
Cyprus +1.48
Hungary +0.95
UK
+0.81 +0.35 -0.09 -0.30
Share of the working age population with high education attainment, 15-64 years-old (ISCED 5 and 6), (2007)
Educational attainment of the
population Cyprus 29.7%
Finland 29.5%
UK
28.2% 20.6% -
-Source: DG Education and culture Data sources: Eurostat UOE
4. European Educational systems in a Worldwide perspective
The European Council set the objective of “making European education and training systems in Europe a world quality reference by 2010”. (Council, 2002c, paragraph 43).
This report therefore puts European performance into a world-wide perspective by comparing it with the USA, Canada, Japan, South Korea, Australia, New Zealand, China, Russia, India and Mexico, countries which are trading partners or high educational performers.
An overall evaluation of the performance of the EU compared to the rest of the World can be made by applying the UN education index, a component of the UN human development index. The education index measures a country's relative achievement in both adult
literacy and combined primary, secondary, and tertiary gross enrolment. It is a weighted average of the Adult Literacy Rate and the Gross Enrolment Rate where adult literacy is given two-thirds weight while gross enrolment is given one-third weight See Table Ann A.1 in the Statistical annex).
The education index clearly puts EU among the world's best performers. Australia, New Zealand, Republic of Korea and the US perform slightly better, Russia is level while Japan, China and India perform at lower levels. (Chart A.10)
PART A: Performance and progress of European education and training systems since 2000
Chart A.9: EU Education average performance level in a neighbouring countries perspective (EU-27 average : 100%)
Source: CRELL research Centre/ DG Joint Research Centres (2008) Data Source: UN Education Index, 2007 (reference year 2005)
Chart A.10: EU Education performance in a Worldwide perspective (UN education index)
Australia 0.993
New Zealand 0.993
Canada 0.991
Korea (Republic of) 0.980 United States 0.971 European Union 0.956 Russian Federation 0.956
Argentina 0.947
Japan 0.946
Chile 0.914
Brazil 0.883
Mexico 0.863
China 0.837
India 0.620
Data source: UN Education Index (reference year 2005)
Equivalent to EU27 Average Above 94% Between 89 and 93% Between 76 and 84%
PART B: Monitoring performance and progress
PART B Chapter 1: Making lifelong learning a reality
1. MAKIG LIFELOG LEARIG A REALITY
1.1 Making lifelong learning a reality in Europe
1.1.1 Participation in education and training at various life-time stages
PART B Chapter 1: Making lifelong learning a reality
MAI MESSAGES
Making Lifelong Learning a Reality
• 5 countries have very high performance in lifelong learning participation: Sweden, the
United Kingdom, Denmark, orway and Iceland. Lifelong learning is becoming a reality for
their citizens. Slovenia, France, Finland, Austria, Spain and the Netherlands are following closely behind. 16 European countries have developed national lifelong learning strategies, with a comprehensive vision covering all types and levels of education and training throughout life.
• Less than 10% of adults in the EU participate in lifelong learning. This reflects continuous progress but it is too slow to reach the benchmark of 12.5% by 2010. Catching up with adult participation in lifelong learning remains the main challenge in many European countries
• All 4 year olds in Belgium, Italy and France participate in pre-school education. Spain, Malta and Luxembourg are close behind and 12 countries in all exceed the Barcelona target of 90% participation.Many countries have achieved significant increases since 2000 (more than 10 percentage points for Germany ;Cyprus, Latvia, Romania, Slovenia Sweden and Norway).
• There are 2 million more 5-29 years old in education and training in the EU than in 2000.
Today 60% of 5-29 years olds Europeans participate in education. This is comparable to the US, but 18% higher than in Japan. Increasing participation in pre-primary and higher education has been enough to outweigh the demographic changes of the new smaller cohorts.
PART B Chapter 1: Making lifelong learning a reality
In 2002, the Member States committed themselves to develop national lifelong learning strategies (Council Resolution, 2002a) covering all contexts (formal, non-formal and informal) and levels of education and training (pre-primary, primary, secondary, tertiary and adult) and all learning activity undertaken throughout life, with the aim of improving knowledge, skills and competences within a personal, civic, social or employment-related perspective. The Lisbon integrated Guidelines underline the need to have such strategies to be in place by end of 2006. 2
The concept of lifelong learning shifts responsibility for education and learning to the individual, focusing on the development of individual capabilities and the capacity to learn; it implies a shift from traditional education institutions to diverse learning opportunities that are more process and outcome oriented.
Most European countries have made progress in defining unified and overarching strategies. 16 Member States have developed lifelong learning strategies that set out national policy priorities and how different sectors relate to each other. A lifelong learning strategy should provide a strategic overview and a coherent set of priorities while identifying the resources needed for different measures. An important aspect is to provide flexible learning pathways and effective transition points between systems and levels of education and training that avoid dead ends. It must also include a transparent system for recognition of prior learning (Council, 2008b).
This chapter analyses participation patterns in lifelong learning and makes comparisons with third countries.3
Monitoring progress at the European level
Progress is monitored through indicators of participation in learning for various age groups of the population. The benchmark is 12.5% of the population aged 25-64 should participate in lifelong learning by 2010. However, lifelong learning strategies should be address to the full range of learning, not just adult learning and should stress the quality of learning. These latter aspects are especially treated in each of other chapters of this report).
1.1 Making lifelong learning a reality in
Europe
1.1.1 Participation in education and training at various life-time stages
The number of years that pupils and students in the EU can expect to spend in education (ISCED levels 0-6), has increased by one and a half year since 2000 mainly due to increases in pre-primary education and higher education. For some Member States, the increase is even more than 2 years (Latvia, Greece, and Lithuania)4. Table 1.1 shows this development in detail. In 2006, the expected years in education for European students were comparable with the number of years in the US and were 2 years longer than in Japan. Some third countries however have significantly longer education than the EU: In Russia it is 3 years longer, while Israel is 4 years longer.2
Table 1.1: Expected years in education and training for students in European countries (d)
Expected school years of pupils and students at ISCED levels 0 to 6
EU27 BE BG CZ DK DE EE IE EL ES FR IT CY LV LT LU HU
2000 16.7 18.6 14.2 15.6 17.8 17.2 i 16.8 16.3 15 17 16.6 16.1 13 i 15.5 15.8 14.3 i 16.1 2003 17.2 19.4 15.1 16.6 18.2 17.2 i 18 16.8 16.5 16.9 16.7 16.7 14.2 i 17.4 17.3 14.7 i 17.1 2006p 17.2 19.6 15.6 17.1 18.9 17.5 i 18.2 17.2 17.9 17.2 16.7 17 14.7 i 17.8 18 : 17.8 MT NL AT PL PT RO SI SK FI SE UK HR MK TR IS LI NO
2000 14.4 i 17.2 15.5 16.4 16.9 14 i 16.7 i : 18.6 19.9 18.9 : 12.9 i : 17.9 13.5 i 17.8 2003 14.7 i 17.3 16 17.2 17 14.9 17.4 i 15.3 19.4 19.9 20 : 16.4 i 12.4 19.2 15.5 i 18.1 2006p 15 i 17.6 16.5 17.8 16.7 15.6 17.9 i 16.1 20.3 19.9 : 14.9 13.3 i 12.5 19.9 16.1 18.3
Data source: Eurostat (UOE data collection)
(:) Missing or not available, (d) See definitions, (i) See information notes, (p) Provisional data
(d) Number of years a person of a given age (4 years in this case) can expect to spend within the specified levels, including years spent on repetition. (i) BE: Data exclude independent private institutions. Data from the German speaking community is missing;
DE, RO, SI: Data exclude students in ISCED level 6
CY, MT: Tertiary students studying abroad are not included, as a result data is underestimated
LU: Secondary and tertiary students study abroad and are not included, as a result data is underestimated MK: Data exclude ISCED 5A second degrees and ISCED 6
PART B Chapter 1: Making lifelong learning a reality
Demographic change is affecting key education indicators. In many Member States the numbers in compulsory schooling will fall over the next decade and in some, the decline will reach the later stages of education and labour market entry beyond compulsory education. In a number of European countries, the 15-19 population will fall by 30% between 2005 and 2015 (the decline goes as high as 40%). This will affect the demand for upper secondary education. Reduced cohorts
demanding less school places may offer a window of opportunity to deal with access and quality issues more easily. At the same time, while youth cohorts may be smaller, they can expect to stay longer in formal education.
Participation in early childhood education.
Participation in pre-primary or primary education of 4 years old made good progress in the EU. The average enrolment rates for 4 years old increased
Chart 1.1 : Enrolment in pre-primary or primary education of 4 years old
(Enrolment rates at ISCED levels 0 and 1)
2000 2006 p Country
82.8 86.8 EU-27 100.0 100.0 France 100.0 100.0 Italy 99.2 (i) 100 (i) Belgium
99.0 97.1 Spain 100.0 95.5 Malta
94.9 94.0 Luxembourg 90.6 93.4 Denmark 81.4 93.1 Germany 89.5 92.8 Hungary 100.0 91.3 United Kingdom
81.0 86.5 Czech Republic 72.8 86.5 Sweden 78.2 86.1 Estonia 79.5 83.2 Austria 72.3 80.6 Portugal 67.7 79.3 Slovenia 60.3 75.8 Romania 99.5 74.2 Netherlands 60.6 73.5 Latvia
: 73.1 Slovakia 55.7 70.4 Cyprus 67.0 68.4 Bulgaria 51.0 59.7 Lithuania 53.9 56.1 Greece 41.9 48.5 Finland 51.1 i 46.9 i Ireland 33.0 41.2 Poland : 48.2 Croatia 12.4 15.9 FYR Macedonia
: 7.0 Turkey 90.9 94.8 Iceland
: 52.7 Liechtenstein 78.1 91.8 Norway
2000 2006 Data source: Eurostat (UOE data collection)
(:) Missing or not available, (p) Provisional data
(i) Some countries have participation rates of 100% or close for children aged 4 (as BE, FR, ES and IT where children typically start the school at the age of 3 (see also the Eurydice publications on education);
BE: Data exclude independent private institutions. Data from the German speaking community is missing; IE: There is no official provision of education at ISCED level 0;
PART B Chapter 1: Making lifelong learning a reality
from 82.8% to 86.8% and the improvement was widely spread. Participation rose by around 10% points or more in Germany, Cyprus, Latvia, Slovenia, Romania, and Sweden. Nevertheless, there are still large differences in participation across the Member States. More than 2/3rds of the countries had enrolment at 80% or below, in 3 Member States (Poland, Ireland and Finland), enrolment was less than 50%; and in Turkey and FYROM it was even lower. Japanese participation is above the EU, whereas the US is about 30% points lower. (See Table 1.2).
Table 1.2: Enrolment in educational institutions of 4 years old
Enrolment rates at ISCED levels 0 and 1 for 4-year olds
EU27 USA Japan
2000 82.8 61.7 94.9 2006p 86.8 58.2 94.8
Data source: Eurostat (UOE data collection), (p) Provisional data
Participation in school and higher education (5-29 years old).
EU enrolment in formal education institutions for age 5-29 increased to 60% in 2005 (from 57% in 2000), an increase of nearly 2 million learners since 2000. The EU rate is comparable to the US and 18% higher than Japan. 13 Member States have higher rates than the US. (See Table Ann B.1.3 in the Statistical Annex)
Participation in primary education stayed over 90% in most countries. Malta was lowest at 86%. Demand for secondary education (ISCED levels 2 and 3) continues to grow in the EU. In only 3 Member States, enrolment rates did fail to increase since 2000. In Greece, the increase was over 10%
Secondary enrolment rates were above 85% in all Member States and well above 90% in 16 countries. These levels are well above the world averages. Only 6 Member States had lower enrolment rates than the US. Enrolment for secondary education is particular high in Japan, Ukraine and Israel. Overall increases in enrolment in tertiary education have been spectacular since 2000 (see also Chapter B.4). Indeed, some Member States (like Hungary, Lithuania and Slovenia) saw their rates increase by over 25%. If tertiary enrolment was over 50% in nearly all Member States in 2005, there were still important differences across Europe. Whereas tertiary rates were above 60% in almost half the Member States, they were at or below 30% in FYROM and Turkey - as in Morocco and Algeria. Still, only Greece and Finland had tertiary enrolment rates higher than the 82% of the US. Japan was 5%
below the EU. The expansion of higher education is a major explanation for the increase in the duration of education.
Participation in lifelong learning of adults.
Adult participation in education and training, measured by the EU benchmark,5 has made slow but continuous progress.
Provisional results for 2007, shows that 9.7% of 25-64 year olds participated in lifelong learning. This is still far from the benchmark of 12.5% for 2010 and only 5 Member States exceeded the benchmark. To these 5 countries can be added the UK and Sweden that both have very high levels of lifelong learning participation -but no data for 2007 are presently available.
Chart 1.2 : Lifelong learning – benchmark for 2010
Percentage of population aged 25-64 participating in education and training, 2000-2007.
European Union (EU-27)
Japan
USA
2000 2006 2007
Data source: Eurostat (EU-Labour Force Survey)
There are large differences in participation between Member States; the Scandinavian countries and the UK, the being the best performers, reaching rates of 20-30%.6 Data put Belgium, Germany, Ireland, France, Cyprus and Luxembourg in the next group, with participation rates around 7-8% whereas the Czech Republic, Lithuania, Malta and Poland are at 5-6% participation rate. Bulgaria, Greece and Romania have recorded little or no progress since 2000 in improving their extremely low levels of participation.
PART B Chapter 1: Making lifelong learning a reality
Chart 1.3 : Participation of adults in lifelong learning (d) 2000, 2007
Percentage of the adult population aged 25 to 64 participating in education and training
2000 2007* Country
7.1 (e) 9.7 (p) EU-27 21.6 32.0 Sweden 19.4 (b) 29.2 Denmark 20.5 (b) 26.6 United Kingdom 17.5 (b) 23.4 Finland
15.5 16.6 Netherlands : 14.8 Slovenia 8.3 12.8 Austria 4.1 (b) 10.4 Spain
3.1 8.4 Cyprus 5.2 7.8 Germany
: 7.6 Ireland 2.8 7.4 France 6.2 (i) 7.2 Belgium
: 7.1 Latvia 6.5 (b) 7.0 Estonia
4.8 7.0 Luxembourg 4.8 (b) 6.2 Italy
4.5 6.0 Malta : 5.7 Czech Republic 2.8 5.3 Lithuania
: 5.1 Poland 3.4 4.4 (p) Portugal
: 3.9 Slovakia 2.9 3.6 Hungary 1.0 2.1 Greece
: 1.3 Bulgaria 0.9 1.3 Romania
: 2.9 Croatia : : FYR Macedonia 1.0 1.5 Turkey 23.5 27.9 Iceland
: : Liechtenstein 13.3 18.0 Norway
2000 2007* Data source: Eurostat (EU-Labour Force Survey))
* 2006 data for SE, UK, HR, IS
(:) Missing or not available, (e) Estimated data, (b) Break in series, (p) Provisional data
(d) Lifelong learning refers to persons aged 25 to 64 who stated that they received education or training in the four weeks preceding the survey (numerator). The denominator consists of the total population of the same age group, excluding those who did not answer to the question 'participation to education and training'. Both the numerator and the denominator come from the EU Labour Force Survey. The information collected relates to all education or training whether or not relevant to the respondent's current or possible future job;
Due to the changes in the Labour Force Survey, aiming at improving relevance and comparability of data at the EU level, breaks of series were noted in nearly all countries (in particular in 2003 and 2004).
1.2 The highest performing countries in making lifelong learning a reality.
A precise measurement of "making lifelong learning a reality for all” is not possible using simple statistics. To better capture the participation patterns a composite indicator covering all the dimensions of lifelong learning is
PART B Chapter 1: Making lifelong learning a reality
There are signs that participation in lifelong learning is close to become a reality for a majority of people in Sweden, the United Kingdom,
Denmark, Norway and Iceland, countries which have developed comprehensive and coherent lifelong learning strategies. The index shows that
Chart 1.4 Composite index on "making lifelong learning a reality" (2000-2005)
Source: CRELL, 2008
The Composite Index of Lifelong Learning in Europe is a proxy measure of participation in education and lifelong learning for the population aged 4 to 64. One indicator is used for each stages of lifelong learning: the Early Childhood Education (ECE) measures the participation of 4 years old in education at ISCED levels 0 and 1, EDU shows the participation in primary, secondary and tertiary education of population aged 5 to 29 and LLL is the EU benchmark on participation in lifelong learning (i.e. the persons aged 25 to 64 who stated that they received education or training in the four weeks preceding the Labour Force Survey as percentage of population aged 25-64). Each those index components are assigned equal weight in the overall index in accordance with the principle of considering each stage of lifelong learning participation as being of equal importance. The index is calculated as the simple arithmetic average of three indicators: ECE, EDU and LLL
Missing values (16 values missing out of a total of 99) are estimated by using multivariate analysis. The three indicators are subsequently scaled using the distance to the best performer approach, in which all countries (32 countries + EU27) and both years (2000, 2005) are considered. Given that there are no outliers in the dataset, this normalization approach is appropriate. The index score is calculated as the arithmetic average of the three normalized indicators. There are no correlation issues to be taken into account during the weighting, since path analysis results confirm that by assigning 1/3 weight to each indicator, the total impact of a single indicator to the overall index score is roughly 31%.
See Table Ann B.1.1 in Annex for details on the indicators.
these countries have exceptionally high overall participation. For Slovenia, Finland, France, Austria, Spain, Belgium and the Netherlands, participation is above the European average and lifelong learning is near to become a reality for the majority of their citizens. On current trends, some of these countries will catch up on the best performing countries in the near future. The index shows Slovenia as one of the fastest advancing Member States where participation in pre-primary and school/higher education has increased during the period by 9.2% and 6% respectively
Participation in lifelong learning was already high in Sweden, United Kingdom and Denmark in
2000. This was also the case for Norway and Iceland. These countries have progressed even further since then, some notably faster than the EU average. Overall, during the period 2000-2005, the average level of EU performance increased by 1.5 points. In that period, the UK increased by 5.6, Denmark by 11.3, and Sweden by 18.7. It can hardly be a coincidence that the best performing countries (Sweden, the United Kingdom, Denmark, Island and Norway) were also those that developed a coherent lifelong learning strategy at the national level.
The index shows that lifelong learning is progressing in the EU as a whole, mainly due to
Sweden
United Kingdom
Turkey
France
EU27
Italy
Cyprus Latvia Lithuania
Luxembourg
Hungary Malta
Netherlands Austria
Poland
Portugal
Romania Slovenia
Slovakia Finland
Croatia
FYROM
Iceland Norway
Bulgaria
Belgium
Czech Republic
Denmark
Germany
Estonia Ireland
Greece
Spain
0
25
50
75
100
0
25
50
75
100
PART B Chapter 1: Making lifelong learning a reality
progress in pre-school and school/higher education participation. But it is too slow to reach the benchmark by 2010 in participation in adult learning, unless major progress is achieved and equity needs fully addressed (see Chapter B.6). In
PART B Chapter 2: Developing School Education
2.
DEVELOPIG SCHOOL EDUCATIO
2.1 Completion of upper secondary education – EU Benchmark
2.2 Organization of school education
2.2.1 Decentralisation and school autonomy 2.2.2 Accountability
2.2.3 School leadership
2.2.4 Public and private schools
2.3 Teachers and professional development
2.4 ICT in schools
PART B Chapter 2: Developing School Education
MAI MESSAGES
Developing School Education
• Progress since 2000 on increasing upper secondary attainment levels of young
people (20-24) has been limited. 11 countries currently exceed the benchmark for 2010 of 85% completion. 6 of these (Czech Republic, Poland, Slovenia and Slovakia, Norway and Croatia) are beyond 90%; 5 (Lithuania, Sweden, Cyprus, Ireland and Finland) are above 85%. Malta Portugal and Lithuania made significant progress (an increase of 10 percentage points or more). Attainment in Spain and Luxembourg declined considerably since 2000.
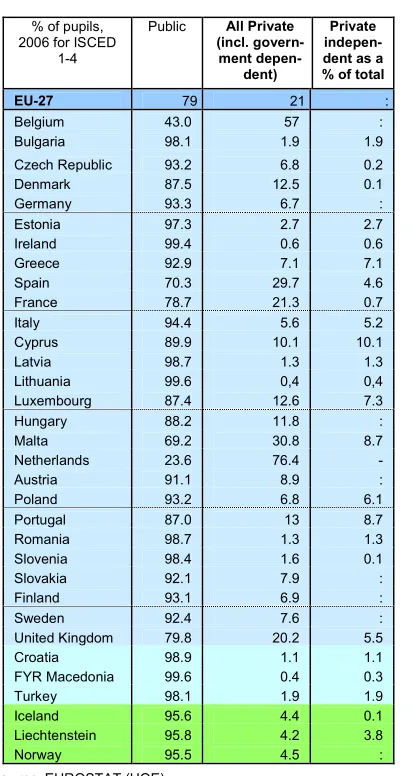
• 21% of pupils attend private schools (incl. government dependent). Belgium and the
Netherlands have the highest shares, above 50%. The lowest shares are in the Baltic States and South-East Europe.
• There are 6 million teachers in the EU - 3% of the active population.
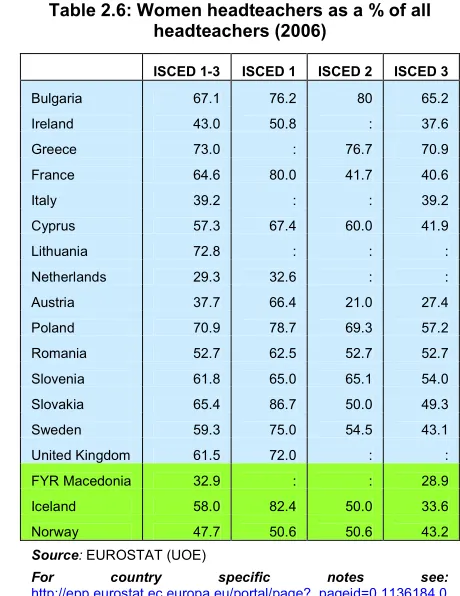
[image:25.595.71.525.70.537.2]• 70% of teachers in primary and secondary schools are female. In primary schools the
figure rises to more than 90% in Bulgaria, Croatia, Hungary, Italy, Latvia, Lithuania and Slovenia. It is less than 60% in Luxembourg, Greece and Turkey.
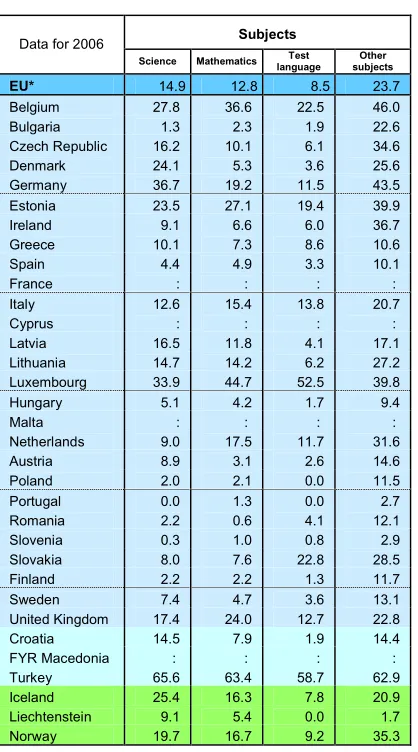
• 15% of pupils attend schools where mathematics or science teaching is hindered by a lack of qualified teachers. The figure rises to up to 30% in Estonia and 40% in Germany.
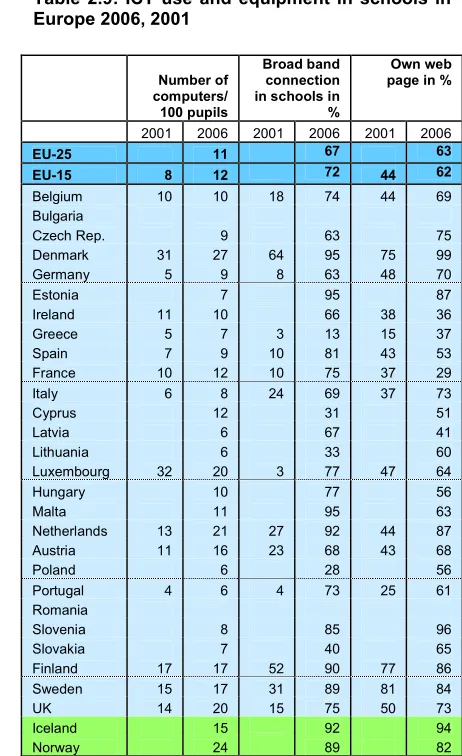
• More than 90% of schools are connected to the internet. One in three schools has broadband internet connection. Two in three schools have created their own website.
• There are, on average, less than 10 pupils per computer in schools in the EU.
• Investment per pupil is about one third higher in secondary education than in primary education. This is mainly due to lower pupil/teacher ratios.
PART B Chapter 2: Developing School Education
Globalisation, an ageing population, migration, changing demand for qualifications on the labour market and rapid technological innovation have increased the importance of education and training in the emerging knowledge society. As a result, schools are a more than ever important to the Lisbon strategy and its goals. Furthermore, changing social values and citizens’ expectations require a constant development. As a result, schools are under growing pressure to perform. This is reflected by the growing number of performance tests and by the spread of information on inter-school disparities.
The 2008 Spring European Council called for substantial reduction in the number of low achievers in reading and of early school leavers. Furthermore, it called for the achievement levels of learners with a migrant background, or from other disadvantaged groups, to be improved.(European Council 2008a, paragraph 15)
Developing school education implies a wide policy agenda, which touches a number of policy instruments:
curricula should enable pupils to acquire the necessary skills and values to succeed in the knowledge based society and on the labour market;
key competences (European Council, 2006a)7; and employability.8;
teaching practice that is more learner-centred ;
systems such as early tracking are debated (European Council, 2006b).9
transition between school levels, especially from upper secondary to higher education, should reflect a holistic view of the education system.
This chapter reviews performance on the upper secondary attainment benchmark. It then analyses some of the areas where reforms to modernise school systems are initiated. School management, the professional development of teachers and trainers, the technical equipment such as ICT and investment in education and training are key areas for change.
2. 1
Completion of upper secondary
education – EU Benchmark
Upper secondary attainment is a core indicator and related to the EU benchmark of achieving a 85% rate of upper secondary attainment of young people (aged 20-24) by 2010.
European benchmark
By 2010 at least 85% of 22-year- olds in the European Union should have
completed upper secondary education.10
Data currently available show, however, that the share of young people (aged 20-24) who have completed upper-secondary education has only slightly improved (by 1.5 percentage points) since 2000. There was thus little progress in achieving the benchmark.
Chart 2.1: Percentage of young people aged 20-24 with upper secondary attainment, 2000-2007
European Union (EU-27)
Japan
USA
2000 2006 2007
Data source: Eurostat (EU-Labour Force Survey)
PART B Chapter 2: Developing School Education
Chart 2.1 - Percentage of the population aged 20-24 having completed at least upper-secondary education, 2000-2007
2000 2007 Country
76.6 78.1 EU-27 91.2 91.8 Czech Republic 88.8 91.6 Poland 88.0 91.5 Slovenia 94.8 91.3 Slovakia 78.9 89.0 Lithuania 85.2 87.2 Sweden 82.6 86.7 Ireland 87.7 86.5 Finland 79.0 85.8 Cyprus 85.1 84.1 Austria 83.5 84.0 Hungary 75.2 83.3 Bulgaria 81.7 82.6 Belgium 81.6 82.4 France 79.2 82.1 Greece 79.0 80.9 Estonia 76.5 80.2 Latvia 76.6 78.1 United Kingdom 76.1 77.4 Romania 69.4 76.3 Italy 71.9 76.2 Netherlands 74.7 72.5 Germany 77.5 70.9 Luxembourg 72.0 70.8 (b) Denmark 66.0 61.1 Spain 40.9 54.7 Malta 43.2 53.4 Portugal 90.6 94.6 Croatia
: : FYR Macedonia 38.6 46.4 Turkey 46.1 49.3 Iceland
: : Liechtenstein 95.0 93.3 (p) Norway
2000 2007
Source: Eurostat (LFS), Croatia, Iceland, Norway: 2006 instead of 2007, HR: 2002 instead of 2000, (p) provisional value (b) = break in series
Additional notes:
CY: Pupils usually living in the country but studying abroad are not yet covered by the survey. Hence results for CY are understated.
Since the 5 December 2005 release, Eurostat has been applying a refined definition of the “upper secondary” educational attainment level in order to improve the comparability of results in the EU. For the 1998 data onwards ISCED level 3C programmes shorter than two years no longer fall under the “upper secondary” level but come under “lower secondary”. This change implies revision of the results in DK (from 2001), ES, CY and IS. However, the definition cannot yet be implemented in EL, IE and AT, where all ISCED 3C levels are still included
In addition to the benchmark, several Member States have set national targets in this area.
Many of the new Member States are already above the benchmark. 4 Member States (Czech Republic, Poland, Slovenia and Slovakia), Norway and Croatia, have already reached over 90% upper secondary attainment. (Chart 2.2).
PART B Chapter 2: Developing School Education
Most other Member States, however, have made little progress since 2000. Upper secondary attainment in Luxembourg and Spain has even fallen. This can partly be explained by strong net migration, with many
young adults having been educated outside the national education system.
In recent years the attainment level of males improved more than the one of the females and the large gender gap closed slightly.
Chart 2.2: Percentage of the population (20-24)
having completed at least upper secondary education by group of countries, 2006
Data source: Eurostat (LFS)
2.2 Organization of school education
The Council Conclusions on efficiency and equity in education and training (2006/C 298/03) recognise the importance of school leadership in achieving high quality learning outcomes. However, there are different concepts of school leadership and different understandings of what this entails. It depends on the context of each individual school system. Nevertheless, research on school leadership and school management is gaining momentum as the importance of leadership teams with translating policies into everyday practice is recognised.
2.2.1 Decentralisation and school
autonomy11
PART B Chapter 2: Developing School Education
Chart 2.3: Location of decision-making authority to determine the overall amount of public expenditure earmarked for schools providing compulsory education, public sector or equivalent, 2002/03
Teaching staff Non teaching staff
Operational resources and movables
Non-movables
Source: Eurydice 2005
The maps indicate the level of decision-making authority in a number of core areas.
A recent EURYDICE study (2007) examined the management of financial and human resources. It noted that the Baltic countries, Belgium (French and German grant-aided schools), Slovenia, Sweden and the UK (England, Wales and Northern Ireland) grant a large degree if autonomy in these two areas. Hungary and Poland also give autonomy; but decisions have to be confirmed by a higher authority.
The picture in the Netherlands and Finland is mixed. The competent authority can choose
whether to delegate decision-making power to schools. In Luxembourg, Malta, Austria, Portugal and Liechtenstein very little autonomy is granted and in Cyprus, none.
Financial autonomy is more widespread in the use of public funds for operating expenses, the raising of private funds and its use for movable goods, and the letting of premises than in capital expenditure. Autonomy in staff management is variable. The school head is usually reporting to and is chosen by a higher authority. More decisions on staffing can be taken at school level.
Chart 2.4: Publication of findings from the external evaluation of individual schools, compulsory general education, 2006/07
PART B Chapter 2: Developing School Education
School autonomy does not necessarily lead to better results. However, research indicates that in areas characterised by local knowledge,13
school autonomy can have a positive effect on results, provided that adequate control systems are in place (Wößmann, 2003; Bishop, 1995).
2.2.2 Accountability
The European Parliament and Council Recommendation (2001) invites Member States to establish transparent quality evaluation systems. It encourages them to create a framework that balances schools’ self-evaluations with external self-evaluations, to involve all relevant players in the evaluation process, and to disseminate good practice and lessons learned. Moreover, the Communication on efficiency and equity in European education and training systems called for a culture of evaluation to provide the solid evidence on which effective long-term policies should be based (European Commission, 2006a).
EURYDICE established three scenarios of school accountability in the EU (EURYDICE, 2007a).
In the majority of countries a central inspectorate is responsible for evaluating schools, which have a large degree of autonomy.
In the Scandinavian countries, Belgium and Hungary, accountability is shared with local authorities. Countries in both scenarios have developed national standards for the evaluation of schools by the end of the 1990s.
In countries such as Italy, self-evaluation is strongly encouraged although the school is not accountable to a specific body. However, this is changing. From 2009/10 the National Institute for the Evaluation of Education, Training and Teaching (INVALSI) will be responsible for evaluating schools.
There is a general trend to develop accountability to a range of bodies, from education ministries and local councils, to parents and external partners. This is the case in England, where the schools are accountable to the central OFSTED inspection, to their local authorities and to a governing body that
includes parents and local community representatives.
Only 6 Member States routinely publish findings for individual schools (See Chart 2.4). The OECD, using PISA 2006 data, has noted that students preformed better in science in schools posting their results publicly (OECD, PISA, Vol1, 2008, p. 243), even after taking into account socio- economic characteristics. They also notice, however, that factors of accountability are difficult to dissociate from other aspects associated with them that might have an influence in the results.
2.2.3 School leadership
“School leadership” may have very different meanings, depending on the characteristics of the educational system. A school leader is not necessarily a head teacher or a person in a management position in the school. Research has tended to focus only on school heads and sought to identify individual characteristics of school leadership and to model leadership behaviour in different contexts. Various taxonomies have been produced to cover the different possibilities.14
These emphasise that the focus of head teachers is not directly on the pupils, but more on organisation. The TIMSS 2003 survey investigated how head teachers spend their time. It identified a number of areas of activity, ranging from administration to leadership, direct teaching, contact with families and the community and supervision.
PART B Chapter 2: Developing School Education
The CRELL project on “School leadership and student achievement in Europe”, using data from TIMSS 2003, has shown that head teacher specialisation, either in management (organisational and administrative activities) or leadership (knowledge and support of the educational process), reduces the impact of family socioeconomic status (SES) on student achievement.15 This has important implications for equity.
A recent OECD report suggests that school leadership could be redefined to focus on those tasks that improve most student learning. It also suggests that distributing leadership tasks can improve school results, that those involved in leadership require adequate preparation and
continuing training throughout their careers; and that school leadership should be made an attractive career choice(OCDE, 2008a).
[image:31.595.83.513.330.598.2]2.2.4 Public and private schools
Table 2.2 below presents the percentage of 15 year-olds attending public or private schools.
A private school is defined in PISA 2006 as: “a school managed directly or indirectly by a non-government organisation; e.g. a church, trade union, business, or other private institution”. The table 2.2 shows the data extracted from EUROSTAT for 2006.16
Chart 2.5: Score differences in Science scale in PISA 2006 by country and attendance of public or private institutions
-120 -100 -80 -60 -40 -20 0 20 40 60 80 100
Luxembourg Hong Kong-China Japan Indonesia Italy Switzerland Finland Denmark Czech Republic Thailand Sweden Hungary Austria Portugal United States Netherlands Slovak Republic Korea Ireland Spain Canada Macao-China Mexico New Zealand Germany Uruguay Brazil OECD average United Kingdom6
Score point difference Difference after accounting for socio-economic
background of students and schools Observed performance difference
Private schools
perform better Public schools
perform better
Source: Schleicher, A. (2008), PISA 2006, Note: NL: private schools are mainly government dependent)
All educational systems in Europe present a high proportion of students attending public schools, except Belgium and the Netherlands.
PISA 2006 shows that public and private schools differ in their student performance (chart 2.5). In general, private schools perform better than public schools. But private schools tend to have a high share of students with high
socio-economic status, while public schools tend to have higher shares of disadvantages students. When this is taken into account, the differences are considerably reduced.
PART B Chapter 2: Developing School Education
[image:32.595.76.282.296.684.2]initial education, early career support (induction) and further professional development is coordinated, coherent, adequately resourced and quality assured. Furthermore, they stated that teachers should be autonomous learners, able to reflect upon their own work, and engage in research as part of their career-long professional development. They noted that greater incentives were needed to encourage and support teachers throughout their careers to review their learning needs and to acquire new knowledge, skills and competence through formal, informal and non-formal learning (European Council, 2007b and European Commission, 2007a).
Table 2.2: Share of pupils in public and private schools (2006)
% of pupils, 2006 for ISCED
1-4
Public All Private (incl.
govern-ment depen-dent)
Private indepen-dent as a % of total
EU-27 79 21 :
Belgium 43.0 57 :
Bulgaria 98.1 1.9 1.9
Czech Republic 93.2 6.8 0.2
Denmark 87.5 12.5 0.1
Germany 93.3 6.7 :
Estonia 97.3 2.7 2.7
Ireland 99.4 0.6 0.6
Greece 92.9 7.1 7.1
Spain 70.3 29.7 4.6
France 78.7 21.3 0.7
Italy 94.4 5.6 5.2
Cyprus 89.9 10.1 10.1
Latvia 98.7 1.3 1.3
Lithuania 99.6 0,4 0,4
Luxembourg 87.4 12.6 7.3
Hungary 88.2 11.8 :
Malta 69.2 30.8 8.7
Netherlands 23.6 76.4 -
Austria 91.1 8.9 :
Poland 93.2 6.8 6.1
Portugal 87.0 13 8.7
Romania 98.7 1.3 1.3
Slovenia 98.4 1.6 0.1
Slovakia 92.1 7.9 :
Finland 93.1 6.9 :
Sweden 92.4 7.6 :
United Kingdom 79.8 20.2 5.5
Croatia 98.9 1.1 1.1
FYR Macedonia 99.6 0.4 0.3
Turkey 98.1 1.9 1.9
Iceland 95.6 4.4 0.1
Liechtenstein 95.8 4.2 3.8
Norway 95.5 4.5 :
Source: EUROSTAT (UOE)
Notes: BE: Data exclude independent private institutions and
enrolments in the German speaking community NL: data refer to the year 2004
EL: Programmes supervised by Ministries other than the Ministry of Education are reported for the first time for ex. adult literacy programmes for ISCED 3C( +14%), ISCED 4C(+7%). ES: Data include for the first time students in ISCED 3C short ( + 5,9%) FI: Improved coverage for the programmes ISCED 3 and 4 vocational ( 14% increase for ISCED 3 and 11% increase for ISCED 4).
2.3 Teachers and professional
development
Teachers form one of the most important interfaces between society and individuals. The quality of their work is a key determinant in the educational success of students. The quality of teaching staff thus has implications for Europe’s economic and social development.
Economic and social changes in Europe are making increasingly complex demands on the teaching profession. The current emphasis on lifelong learning and on “learning at the centre” (Council of the European Union, 2008) requires that teachers become more “research practitioners” (European Commission, 2008a).
PART B Chapter 2: Developing School Education
Table 2.3: Teachers as a % of active population and share of part -time teachers (2006)
% of part-time teachers Data for 2006 Teachers as % of
active pop ISCED
1
ISCED 2
ISCED 3
Belgium 4.0 29.7 39.7 45.4
Bulgaria 2.2 1.0 3.5 4.8
Czech Rep. 2.3 : : :
Denmark : : : :
Germany 2.0 56.8 42.8 42.1
Estonia 2.3 61.7 72.9 64.9
Ireland 2.7 22.7 : 29.4
Greece 3.0 3.0 3.0 3.1
Spain 2.2 8.5 15.9 14.7
France 2.6 9.6 15.5 11.8
Italy 2.8 1.6 1.9 3.4
Cyprus 2.5 3.4 5.1 6.3
Latvia 2.7 27.0 26.8 27.6
Lithuania 3.4 17.5 31.6 :
Luxembourg 3.3 18.1 : 7.1
Hungary 3.2 2.6 8.3 19.7
Malta 3.6 3.0 3.7 5.8
Netherlands 2.8 55.9 : 47.7
Austria 2.4 24.3 22.1 25.8
Poland 3.1 22.7 26.7 38.7
Portugal 2.9 : : :
Romania 2.1 3.7 23.2 12.5
Slovenia 2.2 1.7 11.2 19.5
Slovakia 2.4 10.0 6.5 13.9
Finland 2.5 : :
Sweden 3.0 28.9 28.9 28.7
UK 2.5 20.8 16.0 37.4
Croatia 2.7 5.8 24.5 50.9
FYR Maced. : 0.8 10.2 14.8
Turkey 2.4 : : :
Iceland 3.5 : 22.7 28.6
Liechtenstein : : : :
Norway 3.7 39.0 39.0 33.5
Source: EUROSTAT (UOE)
For country specific notes see:
http://epp.eurostat.ec.europa.eu/portal/page?_pageid=0,1136184,0 _45572595&_dad=portal&_schema=PORTAL
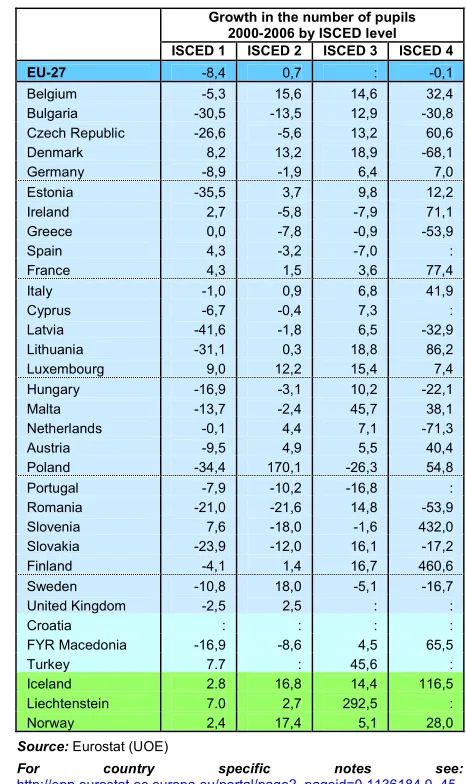
Table 2.3 shows the number of teachers as a percentage of the total active population. The range goes from around 2% in Germany, Spain and Slovenia to more than 4% in Belgium and Malta, with 3% for the EU as a whole. The workforce of 6 million teachers, and 1 million pre-primary educators; was up by 50 000, nearly 1%, since 2000. However, some Member States have experienced a strong reduction of their teaching workforce: France (-13%), Slovakia (-12%), Romania and Bulgaria (-11%). Others experienced an increase; Lithuania (+22%), Greece (+19%) and Ireland (+16%).
Table 2.4: Share of female teachers (2006)
Females as a % of all teachers Data for 2006
ISCED 1-3 ISCED 1 ISCED 2 ISCED 3 EU-27* 69.1 83.2 65.7 57.3
Belgium 66.0 79,3 60,2 58,4
Bulgaria 81,2 93,1 80,1 75,5
Czech Republic 72,2 94,7 73,6 57
Denmark : : 67,1 :
Germany 64,4 84 60,6 47,1
Estonia 85,5 89,4 82,4 81,4
Ireland 72,8 84,7 : 62,1
Greece 59,7 64,2 65,5 47,8
Spain 62,5 70,5 62,5 50,2
France 65,7 81,7 63,9 53,5
Italy 77,8 95,7 75,7 60,3
Cyprus 69,3 82,6 67,6 54,8
Latvia 87,6 96,8 85,3 85
Lithuania 84,3 97,7 81.8 :
Luxembourg 58,2 71,6 : 46,5
Hungary 78,7 96 78,1 64,4
Malta 70,2 88,6 63,8 39,2
Netherlands 66,3 82,6 : 45,6
Austria 69,7 89,2 68,8 51,1
Poland 75,9 84,3 73,4 65,7
Portugal 72 80,6 66,6 64,6
Romania 71,9 86,7 68,1 64,7
Slovenia 78,4 97,4 78,5 64,4
Slovakia 76,4 89,4 75,9 69,2
Finland : : : :
Sweden 68,5 81.0 66,1 50,9
United Kingdom 67,8 81,3 61,1 61,1
Croatia 72,3 90,4 71.0 64,4
FYR Macedonia 58.2 70,2 51,8 56.4
Turkey 45,2 46,8 : 41,6
Iceland 72,1 : 79,7 52,7
Liechtenstein 59,2 75.0 49.0 36,5
Norway 66,2 73.0 73.0 47,4
Source: EUROSTAT (UOE)
*EU27 calculated with the weighed average of countries with data
For country specific notes see:
http://epp.eurostat.ec.europa.eu/portal/page?_pageid=0,1136184,0 _45572595&_dad=portal&_schema=PORTAL