ISSN(Online): 2319-8753 ISSN (Print) : 2347-6710
International Journal of Innovative Research in Science,
Engineering and Technology
(An ISO 3297: 2007 Certified Organization)
Vol. 4, Issue 9, September 2015
Measuring the Usability of Learning Content
in a Web Based Learning Management System
Course– A Statistical Approach
Lakshmi G Panicker1
PhD Student, Dept. of Computer Science, Himalayan University, AP, India1
ABSTRACT: The rise in data consumption has risen drastically. It is an understatement to suggest that users may have difficulty in finding data and are often clueless about how to put these contents to optimal use. A content based system needs to be rated on the utility function of its contents. In this paper the author has made an attempt to determine the best way to calculate the utility function of a learning content using collaborative filtering. The research question was that, is there any significant difference between the average marks of the two groups, if one group was ratings the contents but not provided any recommendations and the other was receiving the recommendations provided by the first group. The second research question was to find if there is a relation between average ratings earned by each content and average number of view earned by it. In the experiment I verified using independent sample t-test that there is a significant difference between the average marks scored by the two groups. I also developed a regression model to predict the average views earned by a learning content based on the ratings earned by it.Using Spearman Rank Correlation Coefficient I verified that there is a relation between average ratings earned by each content and average views earned by it.
KEYWORDS:Recommendation, recommender, algorithms, utility function , explicit and implicit ranking, statistical approach
I. INTRODUCTION
ISSN(Online): 2319-8753 ISSN (Print) : 2347-6710
International Journal of Innovative Research in Science,
Engineering and Technology
(An ISO 3297: 2007 Certified Organization)
Vol. 4, Issue 9, September 2015
sharing of learning objects across many platforms to benefit respective learners [2]. As discussed in [3] most of the existing systems ignore gauging the students' engagements levels and mapping them to suitable delivery needs which match the students' knowledge and preferred learning styles. Though deluge of learning material is very difficult for learners to handle and that may be one of the reasons for a course module in a Learning Management System to fail in meeting learner’s expectations [6].
II. NEEDFORRECOMMENDERSINLEARNINGMANAGEMENTSYSTEMS
Recommender systems for educational purposes need to be integrated in course management systems as they help users to streamline their learning paths in the case of a student, whereas in the case of a teacher to prepare an course webpage that will have the most suitable content oriented to providing guidelines on usage of the course contents in the registered course.
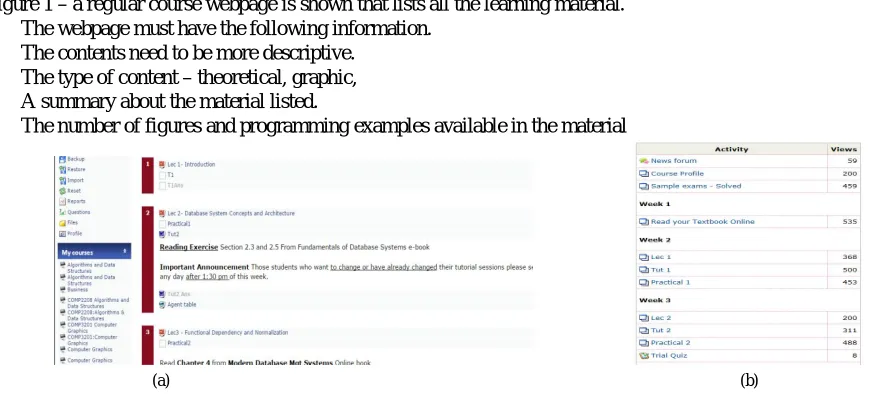
However the challenge lies in the ways to extract the suitable learning material and present it to learners. In Figure 1 – a regular course webpage is shown that lists all the learning material.
The webpage must have the following information. The contents need to be more descriptive.
The type of content – theoretical, graphic, A summary about the material listed.
The number of figures and programming examples available in the material
.
Figure 1 – Course webpages( a)a typical online course webpage in a Course Management System(b)Screenshot of the activity posted by the teacher and the number of views received from the group
III.DISCUSSION
Discerning the value of the utility function of the content object is the prime concern for recommendation systems and it is normally referred to as the recommender problem.The system is based on the following assumption that the recommendation for each content object in the recommendation system needs to be calculated on the basis of the following inherent factors:
Users interested in the same content- course name, course topics, course belongs to some specialization common to same learners
Items liked by users with similar interests - learning material similar in nature – topic name, keywords
Rating earned - The content is available with information about the ratings it earned during its life history within the content system.
Recommendation based on users locations
Educational institutions host dedicated learning management systems that contain a humongous quantity of educational and instructional content. The availability of a various types of content and plethora of platforms to make it available to learners has created a very large multitude of learning content easily available at the very few clicks.
ISSN(Online): 2319-8753 ISSN (Print) : 2347-6710
International Journal of Innovative Research in Science,
Engineering and Technology
(An ISO 3297: 2007 Certified Organization)
Vol. 4, Issue 9, September 2015
Time Constraint – course assessments to be completed within given time.
Material access – access the relevant learning material to complete the course assessments successfully Content magnitude – Large and expanding volume of learning material.
Lack of interactive features – The learning material may not be interactive enough to sustain the interest of the learner.
Lack of usability feedback – The items in the learning management system is not checked for usability. Peer feedback is not recorded formally. Students depend on their experiences to build their learning experiences. The problem is how to get the system to find and recommend the optimum learning content for each user visit. The aim is to design a system that will help the teacher to improve the course contents and their use by guiding the students to materials filtered after taking into consideration their interest in the learning material measured by the clicks and visits made by the learners while perusing the collection.
IV.EXPERIMENTAL RESULTS
The figures 2 and 3 shown above suggest that the content put up by the teacher needs evaluation about the relevance or utility as these contents are not supported by details such as type of learning material (audio, video or textual), it also does not have a summary about the contents of the material, its intended use or suitability for the learner group it is intended for, The best or optimum learning content is dependent on whether it is the most relevant (relevance)latest on the topic (freshness)interactive types of media (audio, video, textual, images)The best learning object also gets maximum views, maximum duration time, maximum ratings, and maximum number of users.We propose to use a statistical method, wherein the utility function of data from a dataset can be ascertained from the underlying data. For instance, based on a set of course web pages that were rated as “relevant” or “irrelevant” by the user, the naive Bayesian classifier can be used to classify unrated course web pages.However this requires creating content clusters that will direct users to the most suitable material for their study.Learning items or materials – course names, chapter readings for each course, examples on the topic, updated online material or references, links to online material.
Context of use – course name, topics in course profile, learning management systems,Selection metrics -Quality of the learning material based on number of recommendations measured using views and recommendations., ratings received from learnersPopular ranking methods are content undergoes a transformation from being available and searched for to being found and recommended to learners who need it. This discovery of content is based on a ranked list of learning contents ranked by the ratings provided.
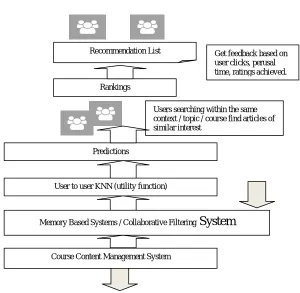
The methodology adopted in recommender systems involving large numbers of items, their rankings and their users is to adopt a hybrid approach based on collaborative and content-based recommender system. The KNN algorithm approach depending on implicit (we learn or infer from user clicks and ratings) and explicit (user says what he or she likes) feedback.
In the user to user version, kNN executes the following three tasks to generate recommendations for an active user: (1) determine k users neighbors (neighborhood) for the active user a; (2) implement an aggregation approach with the ratings for the neighborhood in items not rated by a; and (3) extract the predictions from in step 2 then select the top N recommendations.
We propose to identify the highly recommended learning object by studying the ratings received A metric or a Similarity Measure (SM) determines the similarity between pairs of users (user to user CF) or the similarity between pairs of items (item to item CF).
ISSN(Online): 2319-8753 ISSN (Print) : 2347-6710
International Journal of Innovative Research in Science,
Engineering and Technology
(An ISO 3297: 2007 Certified Organization)
Vol. 4, Issue 9, September 2015
Figure 3 – A typical online course webpage in a Course Management System.
The kNN algorithm is based essentially on the use of traditional similarity metrics of statistical origin. These metrics require, as the only source of information, the set of votes made by the users on the items (memory-based CF). Among the most commonly used traditional metrics we have: Pearson correlation (CORR), cosine (COS), adjusted cosine (ACOS), constrained correlation (CCORR), Mean Squared Differences (MSD) and Euclidean (EUC) [9]
Most recommendations are presented in a sorted list. Recommendation can be understood as a ranking problem [7,8] Popularity is the obvious baseline
Ratings prediction is a clear secondary data inputthat allows for personalization The following features can be added
Ranking items by ratings received (Rr) Ranking items by number of views (Rv) Ranking items by view time (Rt)
The experiment was conducted on two groups of learners. In one group the learners were provided with normal set of learning materials for 10 weeks of a course. The learners in the first group were asked to peruse the material and provide a rating for each week for each content provided in the course.
The ratings provided by these students were made available to the next set of enrolled students to use as recommendations.For the first group a link was provided at the end of each course material with the ratings (a Likert scale) from using which the average ratings earned were collated per content and these ratings were then exported to the recommender module for the second group. However they did not receive the average score or views or recommendations
Get feedback based on user clicks, perusal time, ratings achieved.
Users searching within the same context / topic / course find articles of similar interest
Recommendation List
User to user KNN (utility function)
Memory Based Systems / Collaborative Filtering
System
Predictions Rankings
ISSN(Online): 2319-8753 ISSN (Print) : 2347-6710
International Journal of Innovative Research in Science,
Engineering and Technology
(An ISO 3297: 2007 Certified Organization)
Vol. 4, Issue 9, September 2015
Fig 4 – Flow of recommended learning material
The contents were segregated into two three fragments on the basis of the book source on which they were based. The lecturer could select the books based on his course profile which lists the selected textbooks and references. Hence we selected 3 learning contents from three learning sources (here selected books as mentioned the course profile) for 10 weeks. The contents were fragmented into theoretical, tutorial and practical material. Hence total of 90 learning fragmentswere there in the online learning resource set for the course. The large learning resource set was difficult for most students to peruse without a proper guiding or recommending mechanism.
The views earned by each content from the second group was the only way to know the popularity
Using t-test we can check if there is a significant difference in the average marks earned by the students of the first group and the second.
Using Spearman Correlation coefficient we can ascertain the relation between average ratings earned by each content and average views earned by it.
Using Rank Correlation coefficient we can define that there is a relation between average ratings earned by each content. Using Regression Analysis we can predict the number of views which can be earned by content depending on the ratings given.
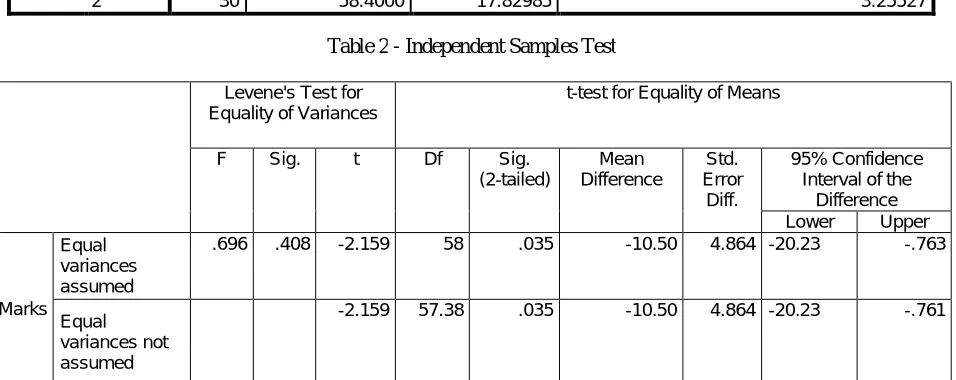
Table 1 and Table 2 describes the two groups, sample size 30, and the result derived which indicates that Levene's Test for Equality of Variances provides that the Sig.value is > 0.5.
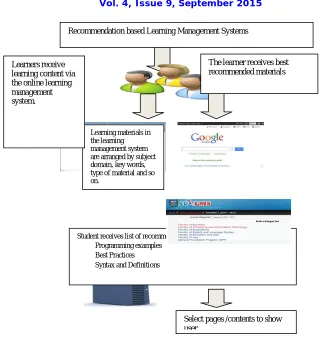
Student receives list of recommended materials for the course.
Programming examples
Best Practices
Syntax and Definitions
Select pages /contents to show user.
Recommendation based Learning Management Systems
The learner receives best recommended materials
Learning materials in the learning management system are arranged by subject domain, key words, type of material and so on.
ISSN(Online): 2319-8753 ISSN (Print) : 2347-6710
International Journal of Innovative Research in Science,
Engineering and Technology
(An ISO 3297: 2007 Certified Organization)
Vol. 4, Issue 9, September 2015
Grp
N Mean Std. Deviation Std. Error
Mean
Marks 1
30 47.9000 19.79612 3.61426
2 30 58.4000 17.82985 3.25527
So the variance in this population are roughly equal, t-test for independent Groups G1 and G2 and their total Marks , G1 – without recommended contents ,G2- with recommended contents.
Table 3– Correlation between Total Views and Average rating
The Correlation Table show in Fig 5 that there is a high correlation between the average ratings and number of views, and it is significant at 0.01.
Table 1 - Group Statistics
Table 2 - Independent Samples Test
Levene's Test for Equality of Variances
t-test for Equality of Means
F Sig. t Df Sig.
(2-tailed)
Mean Difference
Std. Error
Diff.
95% Confidence Interval of the
Difference
Lower Upper
Marks Equal variances assumed
.696 .408 -2.159 58 .035 -10.50 4.864 -20.23 -.763
Equal variances not assumed
-2.159 57.38 .035 -10.50 4.864 -20.23 -.761
Avg ratings Avg. no. of views
Avg ratings
Pearson Correlation 1 .807**
Sig. (2-tailed) .000
N 90 90
Avg. no. of views
Pearson Correlation .807** 1
Sig. (2-tailed) .000
N 90 90
ISSN(Online): 2319-8753 ISSN (Print) : 2347-6710
International Journal of Innovative Research in Science,
Engineering and Technology
(An ISO 3297: 2007 Certified Organization)
Vol. 4, Issue 9, September 2015
Figure 5- The Scatter Plot Graph average Ratings with average Views
There graph indicates that there is a positive relation between the average rating earned by the content from the first group and the views received from second group.
R is the Correlation Coefficient; R Square indicates that 65.2% of the variance is explained by the model. The ANOVA regression table shown below, indicates that the regression model is significant i.e. p <0.05
Table 5 - ANOVAa
Model Sum of Squares df Mean Square F Sig.
1
Regression 72.697 1 72.697 164.546 .000b Residual 38.879 88 .442
Total 111.576 89 a. Dependent Variable: Avg ratings
b. Predictors: (Constant), Avg. no. of views
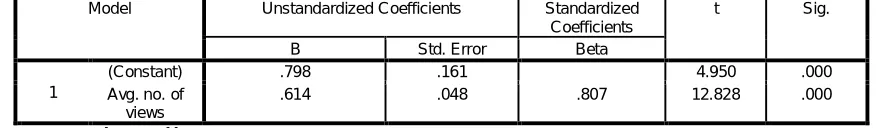
Table 6 - Coefficientsa
Model Unstandardized Coefficients Standardized Coefficients
t Sig.
B Std. Error Beta
1
(Constant) .798 .161 4.950 .000 Avg. no. of
views
.614 .048 .807 12.828 .000
a. Dependent Variable: Avg ratings
From Table 2, t(58) = -2.159, p <0.05. Therefore the test is considered significant at the 0.05 level. This substantiates our assumption that there is a significant difference between the average marks of the groups.
From Table 3 the value of correlation coefficient R between number of ratings attributed to group 1earner and views attributed to group 2 learner is 0.807 and is significant at 0.01.This is highly co-related .
From Table 6, Coefficients Table, we can get the predicted number of views = 0.798 + 0.614*Avg ratings
V. CONCLUSION
I have proved that there is significant difference between the average marks of the two groups, of one group was ratings the contents but not provided any recommendations and the other was receiving the recommendations provided by the first group. The second research question was to find if there is a relation between average ratings earned by each content and average view earned by it.
ISSN(Online): 2319-8753 ISSN (Print) : 2347-6710
International Journal of Innovative Research in Science,
Engineering and Technology
(An ISO 3297: 2007 Certified Organization)
Vol. 4, Issue 9, September 2015
I also developed a regression model to predict the average views earned by a learning content based on the ratings earned by it.
Using Spearman Rank Correlation Coefficient I verified that there is a relation between average ratings earned by each content and average views earned by it.
ACKNOWLEDGEMENTS
I wish to thank Mr.Sunil Prakash Pillai and Dr.Sivaramu for their valuable insights while working on this paper
.
REFERENCES
[1] MERLOT (2009). Multimedia Educational Resource for Learning and Online Teaching. Retrieved May 21, 2010, from
http://www.merlot.org/merlot/index.htm.
[2] Felferning, A., Friedrich, G., & Schmidt-Thieme, L. (2007). Recommender Systems, IEEE Intelligent Systems, 22(3), 18-21.
[3] P. Resnick and H.R. Varian, "Recommender systems." Communications of the ACM, 1997. 40(3) 56-58
[4] Bobadilla, J., Serradilla, F., Hernando, A., & MovieLens. (2009). Collaborative filtering adapted to recommender systems of e-learning. Knowledge-Based Systems. doi:10.1016/j.knosys.2009.01.008
[5] Castro, Leandro, Silvana Aciar, and Eliseo Berni Reategui. "Learning object recommendation for teachers creating lesson plans." XX Congreso
Argentino de Ciencias de la Computación (Buenos Aires, 2014). 2014.
[6] Prakash, Lakshmi Sunil, and Dinesh Kumar Saini. "E-assessment for e-learning." Engineering Education: Innovative Practices and Future Trends (AICERA), 2012 IEEE International Conference on. IEEE, 2012.
[7] Alanazi, Ayidh, Maysam Abbod, and Abrar Ullah. "Intelligent e-learning repository system for sharing learning resources." Web and Open Access to Learning (ICWOAL), 2014 International Conference on. IEEE, 2014.
[8] Sunil Prakash, Lakshmi, Narayana Swamy Kutti, and A. S. M. Sajeev. "Review of challenges in content extraction in web based personalized
learning content management systems." Proceedings of the 12th International Conference on Information Integration and Web-based Applications & Services. ACM, 2010.
[9] Manouselis, Nikos, et al. Recommender systems for learning. Springer Science & Business Media, 2012.
[10] Herlocker, Jonathan L., et al. "Evaluating collaborative filtering recommender systems." ACM Transactions on Information Systems