Application of Graph Analytics for Simulations of Electronic
Money Turnover: Solutions, Evaluations, Forecasts
Olga E. Pyrkina1,* and Sergey A. Zadadaev1
1
Financial university under the Government of Russian Federation, Department of Data Analysis, Decision Making and Finance Technologies, RU-125993, Moscow, Russia
Abstract. The graph model for electronic money turnover developed in this paper considers the system of electronic money turnover as a technological complex network. This network includes systems of electronic money payments, communications between bank and its clients, and interbank communications. The application of the graph models is based on its essential advantages such as an opportunity to expand this system to arbitrary size and visualization of the system links. While graph plotting provides us with the opportunity of carrying out qualitative (visual) system analysis, e computations of the graph metric allows performing a more quantitative analysis. The composite metric, created on the base of graph centrality measures and giving us possibilities of estimating and ranking potential risks, is considered as a foundation for methods of stability, quality and economic security control for systems of the electronic money turnover. A validity of this classification has been investigated and supported by the so-called crash tests, which simulate the random consecutive deleting of graph nodes represented in the real life by communication network nodes, for example, banks or other members of electronic money turnover system, and also by the analysis of the overall performance of the system.
1 Research objectives
Contemporary processes of digital economy development determine global communication outspread for systems of electronic money turnover. Lots and lots of different systems for electronic payments are used broadly in modern financial and business activity, more specifically, there is a great number of systems for communication between banks and their clients as well as a lot of bank-to-bank intercommunication networks, including international systems. That is why it becomes necessary to create new type of mathematical models for its’ description and analysis, based on Big Data.
The paper deals with an application of graph analytics for simulation of electronic money turnover systems. The graph models are actively developed recently for investigation of internet communities of different kinds, but application of such type models to electronic money turnover analysis is not quite obvious.
The digital networks of electronic money turnover can be analysed with the help of complex networks theory because such systems possess typical features of complex network – the nodes in these networks are non-equivalent, there is a small number of nodes with great amount of links. Moreover, patterns of connection between these nodes are neither purely regular nor purely random. The description and analysis of such network can’t be carried out by means of tools developed for classical random networks with fixed
numbers of nodes and links or by means of tools created for crystal lattice description.
All these means that the new approaches should be developed for such network study, and simulation by means of graph analytics turns out to be possible and effective tools for these purposes. The idea of graph analysis based on Big Data is discussed and elaborated in different spheres of finance.
1.1 Graph analytics in modern finance
applications
1.1.1 Graph analytics in scoring models
The necessity for development of modern scoring models, based on Big Data, makes progress in such model creating inside the banks by means of strength and capabilities of banks’ analytical and IT departments. The reasons for this process are quite natural – the top banks have great volumes of available data - a databases of banks’ clients and banks’ transactions. Investigation of such type are carried out now in all the top banks, and the models developed are based mostly on graph analytics.
the nodes of very large network of interconnected persons and firms. The entities including the main features of clients are also considered as nodes, and all types of communications between them are considered as links.
Moreover, some scoring models, based on graph analytics, are successfully applied for fraud detection (for example, ABN AMRO bank, Netherlands [3]), in such models the nodes are accounts and the links are determined by transactions.
In all these researches an application of graph analytics models and investigating of graph metrics increased essentially the accuracy of the models, opening a new level of model forecasting power.
1.1.2 Graph analytics in financial market investigations
Very interesting results are also obtained in various financial markets study by means of the graph analytics tools.
So, the UK CDSs (Credit Default Swaps) market analysis (Bank of England, [4]) was successively carried out by means of graph analytics. The investigators studied networks of gross and net credit protection (both bought and sold), as well as networks of exposures, which relate to the market values of traded positions between counterparties.
Graph analytics is also widely applied for market strength analysis [5], using both directed and undirected graphs for investigating how correlations between the various stocks and economy sectors of the market fluctuate. Such approach gives an opportunity to identify the “strongest” of stocks and sectors, providing an alternate investment strategy. This is carried out by means of graph, based on correlation within the stock market.
In general, complex network in finance sphere can give outstanding opportunities, which are more wide than anybody previously think [6].
1.2 Graph metrics chosen for electronic money turnover analysis
All the papers listed above and many others tested and analysed an effectiveness of different graph metrics in its applications to finance practice. The result is quite quite evident – the choice of metrics is problem - dependent. In this part the reasons will be given for choice of a set of metrics as the most suitable for the problem of electronic money turnover analysis. An application of these metrics for this purpose was tested during the first and the second stages of simulation.
The most effective metrics were found to be so-called centrality metrics, these are metrics (measures) which aggregated an information about mutual arrangement for graph nodes (vertexes) and links (edges) (sometimes the term graph geometric metrics is used). These metrics demonstrated the highest efficiency for the purposes of network safeness, stability and control.
The notion of centrality determines the degree of “importance” or “influence” of a particular node within the graph. The mathematical tools for such metrics computing and investigation were developed actively last years, for example, for Social Network Analysis (SNA). Numerical values of such metrics give a lot of information for community detection [7] and are widely used in practice, for example, in analysis of possible terrorism actions in Internet networks [8].
After simulation the following graph metrics were chosen to be included into the final integral estimation of stability and safeness of electronic money turnover:
1.Degree centrality metric, which can be found with the help of graph adjacency matrix. The node with high value of this measure has a high degree of activity and information influence within its neighbourhood. This metric is computed by means of adjacency matrix aij
for graph
G
as1
1
ij j G i i
a
k
D
N
N
∈
=
=
−
−
∑
, (1)
and is equal to amount of adjacent vertices vertex
k
j normalized to its maximum possible valueN
−
1
.It gives a basic measure of nodes systemic importance derived directly from the network structure but it applies no weight to the links, only registering whether a link exists between two nodes at all. Degree centrality is an important concept because it is the foundation for other methods which differ according to how they weight links.
2.Eigenvector centrality metric is computed as
( )
1
1
i j ij j
j M i j G
x
x
a x
λ
∈λ
∈=
∑
=
∑
, (2)
where
M i
( )
is the set of neighbors for the nodei
andλ
- eigenvalue for vector.This metric determines how closely the concrete node with number i is connected with other strongly connected nodes.The approach is widely used in the web, allowing to assess the systemic importance of a node by reference to the importance of the nodes it is connected to. In this case, it is possible to become systemically important either by having links to a largenumber of nodes or by having a smaller number of links to nodes which themselves are systemically important. This is captured by eigenvector centrality.
But the net strength and eigenvector centralities of a node are not the only factors to take into consideration when considering the stability of a network. A node may have low net strength and even be relatively non-central in the eigenvector sense, but it could still have a great deal of business flow through it.
( )
(
1
)(
2
)
jk jk
i j G i
n
i
n
B
N
N
< ∈
=
−
−
∑
, (3)
where
n
jk is the number of all the shortest pathsbetween nodes
j
andk
,n
jk( )
i
- the number of such shortest paths between nodesj
andk
, passingthrough the node
i
. Graph vertexes with high value of this metrics determine dissemination of information between two or more graph subset. Deleting or destruction of such vertexes may have a negative impact on all the communication system operation4.Closeness centrality metric is computed as
( )
11
i i
ij j G
N
C
L
d
−
∈
−
=
=
∑
, (4)
where
d
ij is the distance between nodesi
andj
,L
i- normalized distance between node
i
and other vertices. It determine the position of node via other nodes in a network, capturing the average distance between each node and every other nodes in the network.It is possible to achieve rapidly necessary nodes through the vertices with small value of this metrics.
5.PageRank metrics give an opportunity to carry out the comparison of relatively importance for nodes in graph (primarily this notion was introduced for hyperlinks in Web pages). It is computed recursively as
( ) (
)
( )
( )
( )
1
j M i
PR j
PR i
d
d
L j
∈
= −
+
∑
, (5)where
M i
( )
is the set of neighborsi
node,L j
( )
is the number of system links coming fromj
node, and( )
0,1
d
∈
is damper factor (attenuant, invariable). The most widely used application of this concept is Google’s PageRank which determines the value of links according to where they came from. The PageRank of a webpage reflects the reality that one link from the BBC’s website will likely generate more traffic than many links from a large number of small blogs.6.An important metrics of graph is as well сentral point dominance, it is computed as
[
max]
1
1
i iCPD
B
B
n
=
−
−
∑
, (6)where
B
max is maximum value of metric betweennescentrality in a network,
B
i - the value of betweennescentrality for the node
i
.This metric takes zero value for entire graph (all the nodes in such graph are connected with all others, that means each of pair of vertexes is adjacent). And this
metric takes unit value for graph with central vertex connected with all other vertexes, that means for “star” type graph.
2
Simulating of electronic money
system turnover
The investigation carried out in Financial University under the Government of Russian Federation [9] demonstrated the opportunities of graph analytics in analysis of reliability, stability and economic security of electronic money turnover system. The methodology for qualitative and quantitative estimation for system stability is the result of this investigation. It creates a comfortable method for network safety analysis, which can be directly applied to real network.
2.1. Structure of electronic money system graph
The graph created for simulating reflects the system of electronic money turnover inside the country. But it is also possible to include a few countries into consideration, if it is necessary to take into account the international interbank payments.
A special feature of this graph is the presence of a few top bank and interbank center for payments processing, so it is a real typical complex network. Moreover, if we suggest that the interbank center for payments processing is the main structure which conducts the payments for all financial agents, we obtain a graph of “star” type with unit value of metrics central point dominance. But another approach – without interbank center - was also applied, few top banks were considered as prevailing forms of nodes with great amount of links.
The remaining nodes in graph model (not the top banks) represents participants of electronic money turnover, the edges visualize communication of all types between them (all the links between two agents are displayed by the single edge for simplicity). At this research stage the graph does not include the payments between people (P2P), it reflects the interaction of firm and bank only (B2B), because any disturbance of finance communications with individuals is not dangerous for electronic money turnover system as a whole.
The graph was created on the base of samples with no more than 300 firm – participants of electronic money turnover, because it was demonstrated [1] that if the number of graph nodes is greater than 300, graph becomes dense and its average characteristics are approximately not changed with increase of nodes’ number. So, consideration on the first stage was restricted by the number of nodes less than 300.
The base for graph construction is a collection of nodes and edges (this list contains the information about all the necessary attributes).
The main attributes characterizing participants of electronic money turnover, are the following:
• For banks it is SWIFT code in international clearing, banks’ owner information, account numbers and so on
• For legal bodies and firms, it is taxpayer ID number, owner data, account numbers, company category
• and so on
Free software Gephi pack was used for graph constructing. Programs and algorithms included into this program pack [10-13] give the opportunity to find numerical values for graph metrics listed above and visualize various fragments of graph. Moreover, this program pack can help in community detections within the graph by means of well – known algorithms of community detection.
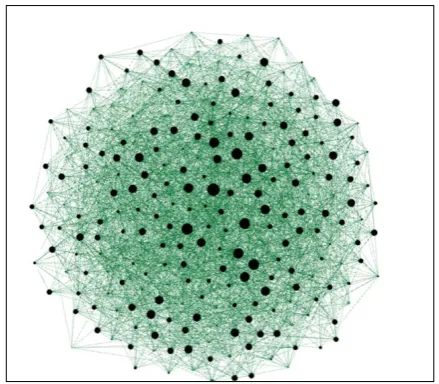
For illustration an example of the graph for simulating of electronic money turnover in Russia is given below, Figure 1. This graph corresponds to the network with a number of nodes equal 300, and number of links equal 2197 (including communications of G2B/B2G and B2B types). The further increase of these both numbers did not result in graph metrics changing.
Fig. 1 An example of graph for simulation and metrics calculation, generated by Gephi program pack
2.2 Results of the first stage of simulation: ranking and system stability analysis
The following procedure for constructing the integral quantitative and qualitative estimations of financial network unfailing performance and stability was developed by means of crash-tests on the base of rank distributions:
• The range of values for every of graph metrics, described above (formulae (1) - (5)) and computed by Gephi program pack, is divided into 4 quartiles in a usual way, according standard statistics rules;
• For centrality metrics i
D
,
Bi,
xiand
PR i( )
:
• The graph nodes with number
i
which metrics values lie in the upper quartile, obtain the highest level of significance, their ranks are 3• The graph nodes with number
i
which metrics values lie in the interquartile range (the central part of distribution between the first and the third quartile), obtain the intermediate level of importance, their ranks are 2• The nodes from the lower quartile obtain the lowest significance level, their ranks are 1
• For centrality metric
C
i the rank distribution is created in an opposite way:• The greatest level of importance is given for graph nodes with metrics values lie in the lower quartile, their ranks are 3
• The intermediate level of importance is chosen for the nodes with metrics values lying within the interquartile range, their ranks are 2
• The lowest level of significance with rank 1 is determined for nodes graph metrics values lying in the upper quartile
•The final integral metric of the node with number
i
significance rank (we have chosen the term of “significance rank” for this characteristic) is constructed on the base of algorithm described above, by means of formulae (1) –(5) as( )
( )
( )
( )
( )( )
( )
i i i
i
D B C
x PR i
rang i rang i rang i rang i
rang i rang i
= + + +
+ +
(7)
• Computing of these significance rank metrics were carried out for all the graph nodes
• The next step of methodology is to carry out descending sorting of all the graph nodes, the size of changing in significance ranks is the range from 5 to 15. This ordering opens the possibility to classify the graph nodes according to their significance rank (computed by (7)) for unfailing performance and stability of the whole network of electronic payments:
• The nodes in the upper part of this ranked list with the rank metrics values of 15, 14 and 13 for importance ranks have the greatest influence with safety of the whole system. Any disturbances and failures in these nodes will result with high probability in malfunction electronic money payment. These nodes determine so-called “red zone”.
• The nodes in the middle part of this ranked list with the values metrics of 12, 11, 10, 9 and 8 for significance ranks have an intermediate influence with safety of the whole system. We designate them as “yellow zone”
• The nodes with the lowest values of 7, 6 and 5 for importance ranks have minimum influence on the whole system safety. They are relegated to “green zone”
Table 1. Unfailing performance and stability matrix Proportion
of nodes in yellow
zone
Proportion of nodes in red zone
<25% 25-50% >50%
<50% Favorable
safety level
Boundary safety level
unacceptable safety level.
>50% Boundary
safety level
unacceptable
safety level . If the system is simulated by means of different graphs for its various parts (fragments), then it should be found the amounts of nodes in “red”, “yellow” and “green” zones for each part. After that the weighted average estimate for percentage of node numbers in each zone is computed. The weight coefficients are taken as a proportion of nodes in each fragment with respect to total amount of whole system nodes. The conclusion of acceptability for economic security level is made with the help of unfailing performance and stability matrix, Table 1
2.3 Model validation by means of crash-tests
Model validation and refinement of quantitative and qualitative estimations for reliability and stability level for the system of electronic payments, constituting the second part of simulation, was realized with the help of so-called crash-tests. These crash tests simulated expulsion of participants of electronic money payment system from turnover (deleting central and peripheral nodes of graph) and further investigation of transaction processing. The breakdowns of such type, which result in elimination of economic agents from electronic money turnover, may appear due to both faults and failures of hardware and equipment and hacker attacks and can completely block, exclude or eliminate important participants of electronic money turnover.
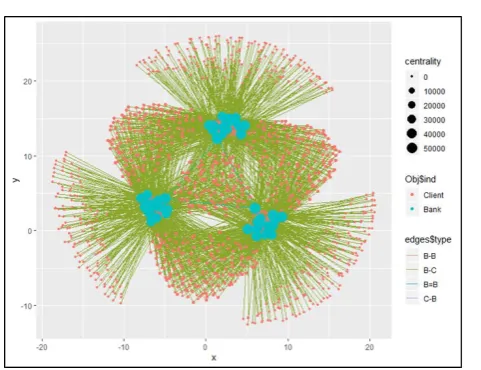
The procedure of the second stage simulation includes generating of graph with random links, consequent step-by-step deleting of graph nodes and considering the effectiveness of transaction completion. This process simulates a destruction of electronic money turnover participants. The typical pictures for generated graph and dependence of a proportion of successive transaction on percentage of nodes destroyed are given for illustration at Figure 2 and Figure 3
Fig. 2. Graph of electron money turnover participant with random links in crash-test scheme.
Figure 2 presents as an example a graph, created for 3 banks consortiums, including 51 banks, and 1000 banks’ clients (economical agents, participants of electronic money turnover). The probabilities that client has accounts in one, two, three and four banks are given by vector
(
0.3, 0.4, 0.2, 0.1)
, the probability distributions with other values were also used in simulation.The control of turnover system operation is carried out through computing of transaction realizability proportion for all the pairs of nodes (clients of banks), which are trying to facilitate an electronic payment transaction.
The payments, requiring various number of steps for transaction completing, were considered (Figure 3), there are the payments with 2, 3, 4 and 5 steps of transactions. The typical results of simulation, corresponding to graph from Figure 2, are given below, 2 step transaction is denoted by blue stability line, 3 step – by brown line, 4 steps – by green line and 5 steps – by red line.
Fig. 3. Dependence of a proportion of successive transaction on percentage of nodes.
• The most useful information can be obtained from the distances (the ranges) between stability lines.
• The ranges between OX-axis and blue line gives the information about stability margin due to intrabank communication,
• The range between blue and brown lines determines stability margin due to interbank corporative affairs (stability of corporation),
• The range between brown and green/red lines demonstrates stability due to existence of consortium of banks.
It should be mentioned that an example of investigation for interacting economic agents’ network functioning under “operating trouble” was studied in [14], but authors applied another technique there, they consider changes in the single centrality metrics, closeness centrality. Moreover, they have studied the propagation of crisis phenomena in economy, not the soundness and stability of financial networks.
3
Results, conclusion and forecasts
The nonlinear dynamics of graph metrics during its’ destruction and information erasing, resulting in system operation disfunction, was observed and investigated by means of simulation and crash tests. The critical level of disruption was determined; on reaching this level the system of electronic payment can’t operate completely correctly.
This suggests that methodology, developed for stability analysis of electronic money turnover system and resulted in appearance of Unfailing performance and stability matrix, operates effectively and may be applied to graph, based on real data, for monitoring and control the state of systems for electronic money turnover.
The model can also be applied for integral estimation of economic security level for the whole system, different part of which are simulated by few separate graphs.
The further development of this approach should include so-called time-varying graph, which gives opportunities to consider the graph of electronic money turnover as a dynamically developing structure. In this case it will be possible to create and investigate metrics for changing of electronic money participants interrelatedness as indicators for safety and stability level changing.
References
1. S. Golitsin. Public speaking at the conference “Scoring Days 2018” at 18.04.2018 [in Russian] https://drive.google.com/drive/folders/1RA z3FQx96qkenEnd7ne3GFn1s4mThsgu, access date 20.11.2018
2. Yu. Zhidkov, V. Kulik, Bankovskoe kreditivanie. №3 (Reglament Bank, Moscow 2018), [in Russian] 3. I. Molloy et al., Lecture Notes in Computer Science,
vol 9603 (Springer, Berlin, Heidelberg, 2017)
4. R. Ali, N. Vause, F. Zikes, Bank of England Financial Stability Paper No. 38 (Bank of England, 2016)
5. O. Shirokikh, G. Pastukhov, V. Boginski, S. Butenko, Computational Management Science Comput Manag Sci 10(2-3), 81-103, (2013)
6. A.M. D’Arcangelis, G. Rotundo, Complex networks and dynamics. - Springer, Cham Switzerland, 209-235 (2016)
7. S.Fortunato, Physics Reports 486(3-5), 75–174, (2010)
8. M.A. Basarab, B.G. Ivanov, A.V. Kolesnikov, V.A. Matveev, Voprosy cyberbezopastnosty 4(17), 11-19, (2016) [in Russian]
9. O.E. Pyrkina, Proceedings of XI Int. Conf. Management of large-scale system development (MLSD'2018) – V1. Planar reports. (Мoscow.: ISC RAS, 424-428 (2018) [in Russian]
10. U. Brandes, A. Faster. Journal of Mathematical Sociology 25(2):163-177, (2001)
11. J. M. Kleinberg, Journal of the ACM 46(5): 604– 632 (1999)
12. S. Brin, L. Page. Proceedings of the seventh International Conference on the World Wide Web 107-117 (WWW1998)
13. R. Tarjan, SIAM Journal on Computing 1(2): 146– 160 (1972)