Open Access Journal of Sports Medicine
Inter-sport variability of muscle volume
distribution identified by segmental bioelectrical
impedance analysis in four ball sports
Yosuke Yamada1,2
Yoshihisa Masuo3
Eitaro Nakamura4
Shingo Oda5
1Laboratory of Sports and Health
Science, Kyoto Prefectural University of Medicine, Kyoto, Japan; 2Japan
Society for the Promotion of Science, Tokyo, Japan; 3Waseda University
Research Institute for Elderly Health, Saitama, Japan; 4Department of
Sport Science, Kyoto Iken College of Medicine and Health, Kyoto, Japan;
5Faculty of Health and Well-being,
Kansai University, Osaka, Japan
Correspondence: Yosuke Yamada Laboratory of Sports and Health Science, Kyoto Prefectural University of Medicine 465 Kajii-cho, Kamigyo-ku, Kyoto, Japan, 602-8566 Tel +81 90 7831 8291 Email [email protected]
Abstract: The aim of this study was to evaluate and quantify differences in muscle distribu-tion in athletes of various ball sports using segmental bioelectrical impedance analysis (SBIA). Participants were 115 male collegiate athletes from four ball sports (baseball, soccer, tennis, and lacrosse). Percent body fat (%BF) and lean body mass were measured, and SBIA was used to measure segmental muscle volume (MV) in bilateral upper arms, forearms, thighs, and lower legs. We calculated the MV ratios of dominant to nondominant, proximal to distal, and upper to lower limbs. The measurements consisted of a total of 31 variables. Cluster and factor analyses were applied to identify redundant variables. The muscle distribution was significantly different among groups, but the %BF was not. The classification procedures of the discriminant analysis could correctly distinguish 84.3% of the athletes. These results suggest that collegiate ball game athletes have adapted their physique to their sport movements very well, and the SBIA, which is an affordable, noninvasive, easy-to-operate, and fast alternative method in the field, can distinguish ball game athletes according to their specific muscle distribution within a 5-minute measurement. The SBIA could be a useful, affordable, and fast tool for identifying talents for specific sports.
Keywords: discriminant analysis, cluster and factor analysis, segmental bioelectrical imped-ance analysis, baseball, lacrosse
Introduction
Whole-body composition, such as percent body fat (%BF) and lean body mass (LBM), is critical to sports performance, especially in endurance sports (eg, long-distance run-ning, swimming, and triathlon), acrobatic and artistic sports (eg, gymnastics and figure skating), and weight-limiting sports (eg, judo, wrestling, boxing, and weightlifting).1 Furthermore, some ball sports tend to require more height (eg, basketball and volley-ball), and certain team positions tend to require greater weight and LBM (eg, lineman in American football and prop in rugby).1
In contrast, specific whole-body composition may not be strictly required in many other ball sports.1 Ball sports, however, require sport-specific movement patterns such as kicking, hitting, throwing, or shooting balls, with or without instruments. The repetitive movements required during participation in both practice and games promote changes in active muscles; thus, muscle mass distribution among the body segments would likely adapt after long-term practice in ball sports. Holzbaur et al2 reported that the distribution of muscle volume in the upper limb is highly conserved across their sub-jects who did not participate in any special sports. In contrast, inter-sport variability of muscle volume distribution might exist in ball-sport athletes because of their long-term
Dove
press
O R I g I N A L R E S E A R C H open access to scientific and medical research
Open Access Full Text Article
Open Access Journal of Sports Medicine downloaded from https://www.dovepress.com/ by 118.70.13.36 on 26-Aug-2020
For personal use only.
Number of times this article has been viewed
This article was published in the following Dove Press journal: Open Access Journal of Sports Medicine
practice. However, to our knowledge, inter-sport differences in muscle distribution of ball-sport athletes have not been reported, but the assessment of these could be fundamental for further training and sport rehabilitation.
Bioelectrical impedance analysis (BIA) has gained recognition as an affordable, noninvasive, easy-to-operate, portable, and fast alternative for assessing body composi-tion.3–5 Traditionally, the impedance from wrist to ankle on one side of the body has been used to predict body compo-sition (whole-body method); however, this method is most influenced by the composition of thin segments in the body such as the forearm and lower leg.6 Therefore, researchers have proposed dividing the human body into different seg-ments or regions to accurately assess body composition.7,8 Segmental BIA (SBIA) can estimate not only whole-body composition,9 but also segmental (upper arm, forearm, thigh, and lower-leg) muscle volumes (MVs).3,10,11 Previous stud-ies have validated the accuracy of segmental MV estimated by SBIA against magnetic resonance imaging, computed tomography, and dual energy X-ray absorptiometry.
The present study was designed to evaluate and quantify inter-sport differences in muscle distribution among athletes of different ball sports. The objective was to determine whether SBIA is effective in discriminating amongst athletes of differ-ent ball sports by iddiffer-entifying sport-specific MV distributions. If the normal MV distribution could be identified for particular sports, then SBIA might be helpful for developing sport-specific training strategies and assessing abnormal muscle distribution and the effectiveness of resistance training.
We selected collegiate athletes playing baseball, soccer, tennis, and lacrosse because representative movements of each seem to recruit different muscle groups. Tennis players use one dominant hand in their racket swing, while baseball and lacrosse players use both hands, and soccer players use only their legs to manipulate the ball. Furthermore, lacrosse requires catching, passing, and shooting with a “crosse” carried in both arms, but does not require directly hitting a high-speed ball, whereas doing so is required in tennis and baseball. This may cause inter-sport differences in the distribution of MV in the upper limbs.
Methods
Participants
We recruited 163 Japanese male college athletes from four ball sports (baseball, soccer, tennis, and lacrosse) after obtaining written informed consent. Of those, 115 athletes (baseball, n = 52; soccer, n = 19; tennis, n = 11; lacrosse, n = 33) aged 20.5 ± 1.2 (mean ± SD) years were selected for
the study based on the following eligibility criteria: (1) no orthopedic disorders within 6 months; (2) no acute disease at the time of the measurements; (3) had played a given ball sport continually for at least 30 months; (4) not a keeper, goalie, or pitcher (because the number of keepers, goalies, or pitchers is too small to apply statistical analysis, they could not be allocated as other groups); (5) pure or right-strong handedness according to the Edinburgh Handedness Inventory;12 and (6) right-pure or right-strong footedness, meaning the preferential use of the right foot to act on and manipulate objects, such as to kick a ball, according to Chap-man et al’s foot preference test.13,14 The study protocol was approved by the ethics committee of the Kyoto Prefectural University of Medicine.
Basic theory of SBIA
Instruments for BIA introduce into the body a known amount of current (I), of about 800 µA, most often at a frequency of 50 kHz. The actual parameter measured with BIA is the volt-age (V), which is produced between two electrodes located most often at sites near to, but different from, the sites at which current is introduced. The measurement is normally expressed as a ratio, V/I, which is also called impedance (Z). In BIA, reactance (Xc) is about 10% of the resistance (R), so the magnitude of Z is similar to that of R. In many BIA reports, Z and R are used as if they are interchangeable, although
Z = (R2+ Xc2)1/2. (1)
Explanations of the BIA method often begin with a dis-cussion of a special, simplified volume that has a uniform cross-section, such as a cylinder, and that is filled with a homogeneous conducting material of resistivity (ρ). It is then observed that the end-to-end R is the resistivity times the length (L), divided by the cross-sectional area (A):
R =ρL/A. (2)
Multiplying the right side of the equation by L/L gives the following equation:
R =ρL2/Vol, (3)
where Vol is the volume. Rearranging gives
Vol =ρL2/R, (4)
an equation that allows one to determine the volume, for this special case, if ρ, L, and R are measured.15 The limb can be
Dovepress
Yamada et al
Open Access Journal of Sports Medicine downloaded from https://www.dovepress.com/ by 118.70.13.36 on 26-Aug-2020
considered as three electrical conductors, low-resistance skeletal muscle, and high-resistance adipose tissue and bone. Previous studies indicate good correlations between limb R or closely-related Z, measured at 50 kHz, and limb skeletal muscle volume estimated by magnetic resonance imaging (MRI) or computed tomography (CT). This observation suggests that limb muscle volume can be predicted from measured R or Z by SBIA.16
Measurement of SBIA
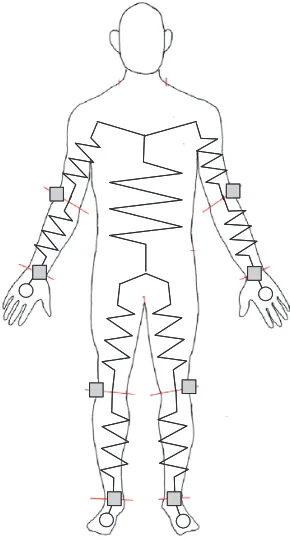
SBIA measurement was conducted according to previous studies.3,6,9,10,17 All measurements were done with the partici-pants in a relaxed supine position on a padded wooden table, arms slightly abducted from the body, forearms pronated, and legs slightly apart. An eight-channel battery-operated imped-ance instrument (Muscle-α; Art Haven 9, Kyoto, Japan) was used to simultaneously measure and display values obtained from four electrode pairs.9,10,17–19 This system applies a con-stant current of 500 µA at 50 kHz through the body. Before the test, a system calibration was conducted with precision resistors of 10, 100, and 1000 Ω, as well as several precision resistors provided by the manufacturer; errors were less than 1%. Participants were told to refrain from vigorous exercise and alcohol intake for 24 hours preceding the testing and to fast for at least 4 hours. All testing was done during the first month of the off-season of the respective sports. The room temperature was kept within a thermoneutral range (20°C–22°C). Impedance measurements were taken with 2 × 2 cm2 pre-gelled electrocardiogram tab-type monitoring electrodes (Red DotTM; 3MTM, St Paul, MN, USA) within 5 to 10 minutes after the participants were in the supine position. Current-injection electrodes were placed on both sides of the body and on the dorsal surfaces of the hands and feet proximal to the metacarpal–phalangeal and metatarsal–phalangeal joints, respectively. Voltage-measurement electrodes were placed on both sides of the body at the middorsum of the wrist centered on a line joining the bony prominences of the radius and ulna, at the dorsal surface of both elbows between the lateral epicondyles of the humerus, at the articular cleft between the femoral and tibial condyles of both legs, and at the mid-anterior ankle centered on a line joining the malleolus lateralis and malleolus medialis (Figure 1).6,17
The anthropomorphic distinction between the trunk and upper or lower limb segments is difficult. Therefore, the principle of equipotential7 was exploited. The detail of mea-suring the impedance of the upper arm and upper leg without shoulder and hip electrodes was described in a previous study.6 When Z
1 was defined as the impedance with shoulder
and hip electrodes and Z2 was defined as the impedance without shoulder and hip electrodes using electrodes in the contralateral limbs, Z2 was very strongly correlated with Z1 (r = 0.977 to 0.981, P 0.001); Z1. Z1 can be calculated using the following equations:
for the upper arm, Z1= 0.827 × Z2 (5)
(R2= 0.962, standard error of the mean [SEE] = 3.71 Ω);
And, for the upper leg, Z1= 0.876 × Z2 (6)
(R2= 0.961, SEM = 1.98 Ω). These results indicate that Z 1 and Z2 are proportionate to each other and either value can be used. Therefore, Z2 was used in the present study.
The repeatability of the Z measurements for each segment was assessed in a pilot study with 14 young adult athletes on two separate days, and no significant difference was detected in the intraclass correlation coefficients (ICC[3,1]) for the test– retest (0.94–0.98). The %BF of the Japanese college athletes was calculated according to a previous study.9 MVs were calculated from Z and segment L using the following equations provided by a previous study of Japanese college athletes:10
upper arms, (70.681[L2/Z] – 72.71); (7)
Figure 1 Schema of electrode locations.
Notes: ,current-injection electrodes; , voltage-measurement electrodes.
Dovepress Muscle distribution difference in ball sports
Open Access Journal of Sports Medicine downloaded from https://www.dovepress.com/ by 118.70.13.36 on 26-Aug-2020
forearms, (110.41[L2/Z] + 54.238); (8) thighs, (131.19[L2/Z] – 152.86); (9) lower legs, (126.35[L2/Z] + 31.35). (10)
The standard errors of the estimates against the MVs mea-sured by MRI were as follows: forearm, 38.4 cm3; upper arm, 40.9 cm3; lower leg, 107.2 cm3; and thigh, 362.3 cm3.10
Measurements and procedures
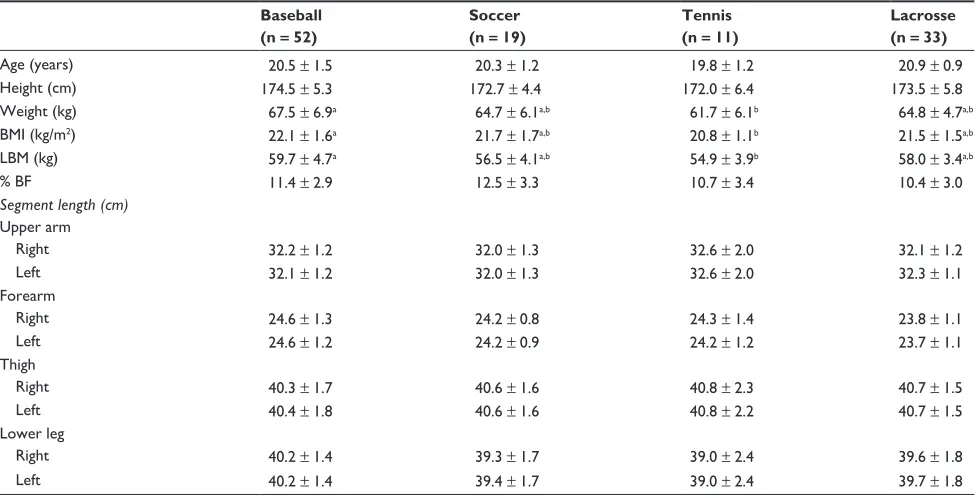
The measurements were anthropometric characteristics (n = 13; Table 1), segmental MV (n = 8; Table 2), and ratio between muscle volumes (n = 10; Table 2). The measurements included 31 variables (Figure 2). Body mass was measured to the nearest 0.1 kg with the participants dressed in light clothing. Barefoot standing height was measured to the near-est 0.1 cm with a wall-mounted stadiometer. The lengths of the limbs were measured to the nearest 0.5 cm with a flexible tape (Flat rule; KDS Co, Ltd, Kyoto, Japan). The segment lengths were measured as following: for forearm, between the mid-dorsum of the wrist centered on a line joining the bony prominences of the radius and ulna and the lateral epi-condyle of the humerus; for upper arm, between the lateral epicondyle of the humerus and the head of the radius and the acromion process of the shoulders; for lower leg, between the mid-anterior ankle centered on a line joining the malleolus
lateralis and malleolus medialis and the articular cleft between the femur and tibia-condyles; for upper leg, between the articular cleft between the femur and tibia-condyles and the greater trochanter of the femurs.
The ratio of the dominant-to-nondominant (D/N) limbs was calculated for the upper arms, forearms, thighs, and lower legs by:
D/N (%) = (MV of dominant limb)/
(MV of nondominant limb) × 100–100. (11)
The ratio of proximal-to-distal (P/D) limbs was calculated for the upper and lower limbs on both sides by:
P/D = (MV of proximal limb)/(MV of distal limb). (12)
The ratio of the upper-to-lower limb (U/L) was calculated for the right and left sides by:
U/L = (MV of upper limb)/(MV of lower limb). (13)
Data analysis
Results are presented as means ± SD. One-way analysis of variance (ANOVA) was carried out for group comparisons, and Tukey’s b was used post hoc as the test of multiple com-parisons to account for different sample sizes of the groups.20 A single multivariate analysis of variance (MANOVA) was
Table 1 Physical characteristics of the analyzed participants (n = 115)
Baseball (n = 52)
Soccer (n = 19)
Tennis (n = 11)
Lacrosse (n = 33)
Age (years) 20.5 ± 1.5 20.3 ± 1.2 19.8 ± 1.2 20.9 ± 0.9
Height (cm) 174.5 ± 5.3 172.7 ± 4.4 172.0 ± 6.4 173.5 ± 5.8
Weight (kg) 67.5 ± 6.9a 64.7 ± 6.1a,b 61.7 ± 6.1b 64.8 ± 4.7a,b
BMI (kg/m2) 22.1 ± 1.6a 21.7 ± 1.7a,b 20.8 ± 1.1b 21.5 ± 1.5a,b
LBM (kg) 59.7 ± 4.7a 56.5 ± 4.1a,b 54.9 ± 3.9b 58.0 ± 3.4a,b
% BF 11.4 ± 2.9 12.5 ± 3.3 10.7 ± 3.4 10.4 ± 3.0
Segment length (cm)
Upper arm
Right 32.2 ± 1.2 32.0 ± 1.3 32.6 ± 2.0 32.1 ± 1.2
Left 32.1 ± 1.2 32.0 ± 1.3 32.6 ± 2.0 32.3 ± 1.1
Forearm
Right 24.6 ± 1.3 24.2 ± 0.8 24.3 ± 1.4 23.8 ± 1.1
Left 24.6 ± 1.2 24.2 ± 0.9 24.2 ± 1.2 23.7 ± 1.1
Thigh
Right 40.3 ± 1.7 40.6 ± 1.6 40.8 ± 2.3 40.7 ± 1.5
Left 40.4 ± 1.8 40.6 ± 1.6 40.8 ± 2.2 40.7 ± 1.5
Lower leg
Right 40.2 ± 1.4 39.3 ± 1.7 39.0 ± 2.4 39.6 ± 1.8
Left 40.2 ± 1.4 39.4 ± 1.7 39.0 ± 2.4 39.7 ± 1.8
Notes: a,bSignificantly different at post hoc multiple comparisons by Turkey’s b (a.b). Right is dominant and left is non-dominant side in all participants.
Abbreviations: BMI, body mass index; LBM, lean body mass; %BF, percent body fat.
Dovepress
Yamada et al
Open Access Journal of Sports Medicine downloaded from https://www.dovepress.com/ by 118.70.13.36 on 26-Aug-2020
conducted before ANOVA to avoid type I error. A correlation matrix among the ratios of the 31 variables was calculated and submitted to cluster and factor analyses to identify pos-sible redundant variables. Ten suitable dependent variables were selected from these results for the discriminant analysis. Discriminant analysis was employed to identify the nature of the discovered differences and to provide a scaling model with functions that maximized group differences. Classifica-tion procedures were used to determine if groups could be accurately described by their muscle characteristics.21 All analyses were performed using SPSS 12.0 for Windows (SPSS, Inc, Chicago, IL, USA), with an alpha of 0.05 used to denote statistical significance.
Results
The single MANOVA shows a significant main effect for group (P 0.001).
Physical characteristics
There were no significant differences amongst groups for age, height, %BF, and all segmental lengths (Table 1).
Baseball players had greater weight, body mass index (BMI), and LBM compared to tennis players.
Segmental MV characteristics
There was no significant difference amongst groups for the MV of the right thigh, but there were significant group dif-ferences in the other segments (P 0.05; Table 2). Baseball players had greater MVs of the right and left forearms than other players and greater MVs of the left upper arm, left thigh, and right and left lower legs compared to tennis play-ers. Lacrosse players had a greater MV of the right upper arm than soccer players and greater MVs of the left upper arm and right and left lower legs compared to tennis players.
There were no significant differences amongst groups for the ratio of the dominant-to-nondominant MV in the lower legs, the ratio of the proximal-to-distal MV in the right and left legs, and the ratio of the upper-to-lower MV in the left limbs (Table 2). In contrast, tennis players had remarkably greater ratio of the dominant-to-nondominant MV in the upper arms (12.54% ± 5.88%) and forearms (10.38% ± 4.35%) compared to other players. Tennis and
Table 2 The muscle volumes and muscle volume ratios between segments
Baseball Soccer Tennis Lacrosse
Segmental muscle volume (cm3) Upper arm
Right 806 ± 110a,b,*** 727 ± 100b 745 ± 105a,b,*** 813 ± 95a,***
Left 770 ± 95a 719 ± 88a,b 663 ± 99b 788 ± 87a
Forearm
Right 634 ± 84a 544 ± 70b 573 ± 82b,*** 558 ± 55b
Left 638 ± 87a 535 ± 72b 519 ± 66b 556 ± 54b
Thigh
Right 4270 ± 563 4092 ± 412*** 3909 ± 560 4164 ± 383
Left 4259 ± 538a 3923 ± 470a,b 3839 ± 539b 4106 ± 398a,b
Lower leg
Right 1484 ± 188a 1398 ± 158a,b 1321 ± 161b,** 1494 ± 159a
Left 1474 ± 183a 1402 ± 159a,b 1287 ± 162b 1491 ± 156a
Muscle volume ratio
Ratio of dominant-to- nondominant limbs (%)
Upper arms 4.68 ± 5.47b 0.89 ± 4.71b 12.54 ± 5.88a 3.20 ± 4.81b
Forearms -0.44 ± 5.49b 1.69 ± 4.58b 10.38 ± 4.35a 0.30 ± 3.56b
Thighs 0.24 ± 3.80b 4.57 ± 3.93a 1.81 ± 3.07a,b 1.56 ± 4.73a,b
Lower legs 0.74 ± 4.39 -0.18 ± 4.27 2.68 ± 2.33 0.30 ± 4.58
Ratio of proximal-to-distal limbs
Right arm 1.28 ± 0.13b 1.34 ± 0.15b 1.31 ± 0.18b 1.46 ± 0.13a
Left arm 1.22 ± 0.13c 1.35 ± 0.11a,b 1.29 ± 0.20b,c 1.42 ± 0.12a
Right leg 2.89 ± 0.28 2.94 ± 0.26 2.96 ± 0.27 2.80 ± 0.28
Left leg 2.90 ± 0.27 2.81 ± 0.28 2.99 ± 0.29 2.77 ± 0.30
Ratio of upper-to-lower limbs
Right side 0.251 ± 0.018a 0.232 ± 0.020b 0.253 ± 0.017a 0.242 ± 0.014a,b
Left side 0.247 ± 0.022 0.236 ± 0.024 0.232 ± 0.019 0.240 ± 0.015
Notes:a,b,cSignificantly different (a.b.c). **,***Significantly larger than nondominant side by paired t test (**P 0.01, ***P 0.001). Right is dominant and left is non-dominant
side in all participants.
Dovepress Muscle distribution difference in ball sports
Open Access Journal of Sports Medicine downloaded from https://www.dovepress.com/ by 118.70.13.36 on 26-Aug-2020
baseball players had a greater ratio of the upper-to-lower MV in the right limbs than soccer players. Soccer players had a greater ratio of the D/N MV in the thighs (4.57% ± 3.93%) compared to baseball players, and lacrosse players had a greater ratio of the P/D limbs MV in their right and left arms compared to all other players.
Reducing redundancy by cluster analysis
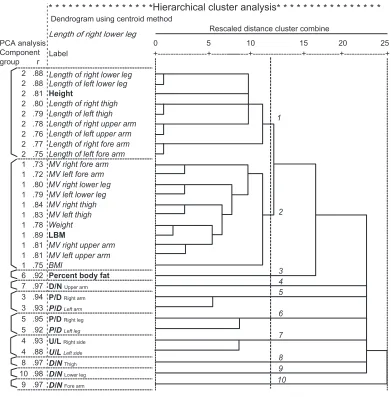
The correlation matrix among the 31 variables was submitted to cluster analysis to measure the similarity among variables or clusters based on the squared Euclidean distance after nor-malization using Z scores, and the variables were clustered based on the centroid method (Figure 2). The data suggested that rescaled distances of more than 12.5 (r = 0.5) indicate no
similarity among variables; there were two major and three minor clusters and five independent variables. The first major cluster contained height and all of the segment lengths. The second major cluster contained weight, BMI, LBM, and all of the segment MVs. The P/D of the right and left arms were combined into a cluster, the P/D of the right and left legs were combined into one cluster, and the U/L of the right and left limbs were combined into another cluster. D/N and %BF in each segment were separated from the other clusters.
When the same correlation matrix was submitted to factor analysis, ten factors were identified with eigenvalues greater than 0.65, and 95.5% of the total variance was accounted for by these ten factors. These ten factors were rotated using the varimax criterion to make the structure easier to understand
* * * * * * * * * * * * * * * *Hierarchical cluster analysis* * * * * * * * * * * * * * * * Dendrogram using centroid method
20 25
15 10
5 0
+---+---+---+---+---+
2 .88
Length of right lower leg
2 .88 2 .81 2 .80 2 .79 2 .78 2 .76 2 .77 2 .75 1 .73 1 .72 1 .80 1 .79 1 .84 1 .83 1 .78 1 .89 1 .81 1 .81 1 .75
6 .92 Percent body fat D/N Upper arm
P/D Right arm P/D Left arm
P/D Right leg P/D Left leg
U/L Right side U/L Left side
D/N Thigh D/N Lower leg D/N Fore arm 7 .97
3 .94 3 .93 5 .95 5 .92 4 .93 4 .88 8 .97 10 .98 9 .97
Rescaled distance cluster combine PCA analysis
Component group r Label
Height
Length of left thigh Length of right upper arm Length of left upper arm Length of right fore arm Length of left fore arm Length of left lower leg Length of right lower leg
Length of right thigh
1
2
3 4 5
6
7
8 9 10 MV right lower leg
MV right thigh MV left thigh Weight
LBM
MV right upper arm MV left upper arm BMI
MV left fore arm MV right fore arm
MV left lower leg
Figure 2 Dendrogram of the cluster analysis.
Notes: The dendrogram does not plot actual distances but rescales them to numbers between 0 and 25. The left side of the figure shows factor numbers and the factor
loading obtained from the factor analysis. All variables in the same cluster have high factor loading for the same factor. The variables in bold were used for the discriminant analysis.
Abbreviations: BMI, body mass index; D/N, the ratio of dominant-to-nondominant limbs in the upper arms, forearms, thighs, and lower legs; L, length; LBM, lean body mass; MV, muscle volume; PCA, principal component analysis; P/D, the ratio of proximal-to-distal limbs in the right and left arms and legs; U/L, the ratio of upper-to-lower limbs in the right and left sides.
Dovepress
Yamada et al
Open Access Journal of Sports Medicine downloaded from https://www.dovepress.com/ by 118.70.13.36 on 26-Aug-2020
(Figure 2). The results indicate that the variables have very high factor loading for each of the ten factors, and that all variables in the same cluster have high factor loading for the same factor.
Height, LBM, %BF, D/N in the upper arms, forearms, thighs, and lower legs, P/D in the right arm and leg, and U/L in the right limbs were selected as representatives of the 31 mea-surement variables based on the following criteria: (1) one variable was selected from each cluster; (2) one variable was selected among those with high factor loading for the same factor; and (3) one variable was selected among those related to the same physiological system.
Multiple discriminant analysis to quantify
variable contributions
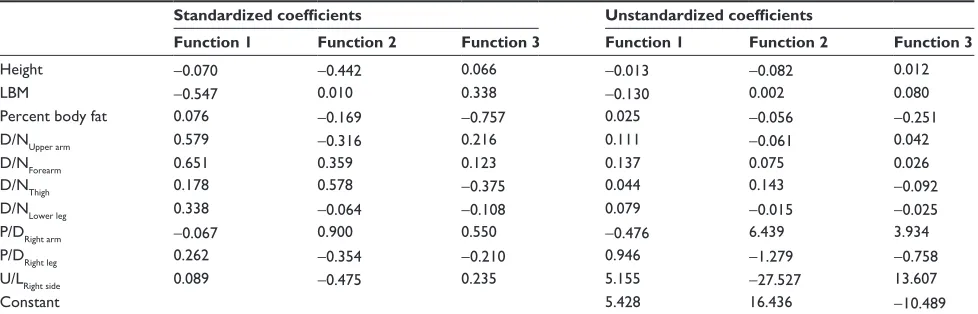
Multiple discriminant analysis revealed three significant functions (P 0.001; Table 3). Based on Wilks’ lambda values, discriminant function 1 accounted for 43.3% of the variance, discriminant function 2 accounted for 42.1%, and discriminant function 3 accounted for 14.6%. Standardized coefficients represent the relative importance of the variables by quantifying the potential of each variable to discriminate among athletes according to their sport. Unstandardized coef-ficients allow for the derivation of discriminant scores for each individual. Based on these scores, group membership could be predicted according to the proximity of the respec-tive group centroid values (mean group values).
The first discriminant function described the differences between tennis players and the other groups (group centroids of discriminant function 1: tennis, 2.916; soccer, 0.0095; baseball, -0.3620; lacrosse, -0.4071; Figure 3, Table 3). The
D/N in the upper arms and forearms, and LBM had rela-tively large standardized coefficients. The second discrimi-nant function described the differences between baseball players and soccer or lacrosse players (group centroids of discriminant function 2: baseball, -0.9767; soccer, 1.003; lacrosse, 1.013; tennis -0.1545). The P/D in the right arm, D/N in the thighs, and U/L in the right limbs had relatively large standardized coefficients. The third discriminant func-tion described the differences between soccer and lacrosse players (group centroids of discriminant function 3: soccer, -1.102; baseball, -0.0278; lacrosse, 0.5985; tennis, 0.2405), and %BF and P/D in the right arm had relatively large stan-dardized coefficients. Approximately 84% of the athletes could be discriminated correctly in this model (Table 4).
When we used four physique variables (height, LBM, BMI, and %BF) in the discriminant analysis, only 49.6% of athletes could be correctly discriminated, and only the first function was significant. However, when we used four muscle-distribution variables (D/N in the upper arm, D/N in the thigh, P/D in the right upper limb, and U/L in the right limb), 66.1% athletes could be correctly discriminated, and all three functions were significant (P 0.001).
Discussion
The %BF was not different among athletes who participated in baseball, soccer, tennis, and lacrosse (10.4%–12.5%). This result agrees with the review by Sinning,1 who cited studies with similar results (baseball, 12.6%; soccer, 9.5%; tennis, 11.3%; lacrosse, 12.3%), and the %BF was intermediate when compared to long-distance runners (4.7%), gymnasts (6.5%), and defensive linemen of American football (18.2%).
Table 3 Statistical significance and standardized and unstandardized coefficients for the three discriminant functions
Standardized coefficients Unstandardized coefficients
Function 1 Function 2 Function 3 Function 1 Function 2 Function 3
Height -0.070 -0.442 0.066 -0.013 -0.082 0.012
LBM -0.547 0.010 0.338 -0.130 0.002 0.080
Percent body fat 0.076 -0.169 -0.757 0.025 -0.056 -0.251
D/NUpper arm 0.579 -0.316 0.216 0.111 -0.061 0.042
D/NForearm 0.651 0.359 0.123 0.137 0.075 0.026
D/NThigh 0.178 0.578 -0.375 0.044 0.143 -0.092
D/NLower leg 0.338 -0.064 -0.108 0.079 -0.015 -0.025
P/DRight arm -0.067 0.900 0.550 -0.476 6.439 3.934
P/DRight leg 0.262 -0.354 -0.210 0.946 -1.279 -0.758
U/LRight side 0.089 -0.475 0.235 5.155 -27.527 13.607
Constant 5.428 16.436 -10.489
Notes: Function 1: Wilk’s Lambda 0.201, Chi-square 171.6, df 30, P 0.001; Function 2: Wilk’s Lambda 0.393, Chi-square 99.9, df 18, P 0.001; Function 3: Wilk’s
Lambda 0.757, Chi-square 29.8, df 8, P 0.001.
Abbreviations: LBM, lean body mass; D/N, the ratio of dominant-to-nondominant limbs in the upper arms, forearms, thighs, and lower legs; P/D, the ratio of proximal-to-distal limbs in the right arms and legs; U/L, the ratio of upper-to-lower limbs on the right sides.
Dovepress Muscle distribution difference in ball sports
Open Access Journal of Sports Medicine downloaded from https://www.dovepress.com/ by 118.70.13.36 on 26-Aug-2020
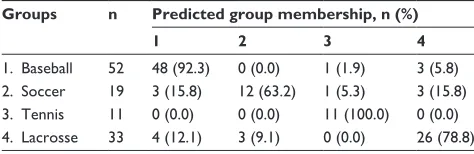
When whole-body composition and physical character-istics were used, only 49.6% of the athletes could be dis-criminated by a significant function. In contrast, when muscle distribution and physique were included, we could correctly discriminate 84.3% of the athletes with three significant functions (Table 4). This was particularly true when the four muscle-distribution variables (D/N in the upper arms, D/N in the thighs, P/D in the right arm, and U/L in the right limbs) were used. With that model, 66.1% of the athletes could be correctly discriminated, and all three functions were signifi-cant (P 0.001). The results suggest that the athletes of the four sports have different muscle distributions.
There are several advantages in using the ratio of MV between segments. One strength is the dramatic reduction of multicollinearity in the multivariate analysis. The skel-etal muscles of the human body are well adapted for erect bipedalism in a gravity environment and are highly correlated with body weight or size. That body weight, BMI, LBM, and MV of all segments were classified into one cluster indicates that they had high multicollinearity in our study population (Figure 2). In contrast, the MV ratios between segments were distinct from body weight and from each other and were thus identified in the discriminant analysis. Another
strength is related to the sensitivity of SBIA to interindividual differences in muscle structure (eg, muscle shape, pennation angle, fiber composition, and intra- and extracellular water distribution). The MV ratio probably reduces errors arising from these characteristics as they are likely to be similar in the numerator and denominator.
The ratio of the distal to proximal muscle mass in the upper arms has not been well examined. Recently, Holzbaur et al analyzed upper-limb MV in ten young participants with varied body size and indicated that the MV of each limb strongly correlated with total MV. They stated that the mean volume fraction was sufficient to scale all upper limb muscles of a typical individual with a different total MV. In contrast, we found significant differences in the ratio of the distal to proximal muscle mass among athletes from the different ball sports. We examined well trained athletes in ball sports, whereas Holzbaur et al examined only healthy men and women who did not participate in any special sports. These results suggest that sports-specific repetition during practice produces a body-specific muscle distribution that differs from the normal muscle distribution. It is well known that the molecular composition including muscle changes with respect to the type and duration of exercise.22–24 Sanchis-Moysi et al25–28 reported that tennis participation is associated with increased muscle volumes in dominant compared to the nondominant arm, likely due to selectively hypertrophy of the loaded muscles. Sports-specific repeti-tion produces selectively hypertrophy as well as selective adaptation of molecular composition in skeletal muscles.
Lacrosse players had significant D/N differences in the upper arm, but no differences in the forearm, thigh, and lower leg. Lacrosse players also had greater ratio of the P/D
Table 4 Classification for all significant discriminant functions
Groups n Predicted group membership, n (%)
1 2 3 4
1. Baseball 52 48 (92.3) 0 (0.0) 1 (1.9) 3 (5.8) 2. Soccer 19 3 (15.8) 12 (63.2) 1 (5.3) 3 (15.8) 3. Tennis 11 0 (0.0) 0 (0.0) 11 (100.0) 0 (0.0) 4. Lacrosse 33 4 (12.1) 3 (9.1) 0 (0.0) 26 (78.8)
Note: Percent of correctly classified cases: 84.3% (P 0.05).
A B
−4
−2
0
2
4
−4 −2
0 2
4
Discriminant function 1
Discriminant function
2
−4 −2 0 2 4
−4 −2 0 2 4
Discriminant function 2
Discriminant function
3 Baseball
Soccer Tennis Lacrosse
Figure 3 The two-dimensional projection plots of the group centroids.
Notes: Thetwo-dimensional projection plots of the group centroids. (A) the two-dimensional projection of discriminant function 2 and 3. (B) the two-dimensional projection of discriminant function 1 and 2. , baseball; , soccer; , tennis; , lacrosse.
Dovepress
Yamada et al
Open Access Journal of Sports Medicine downloaded from https://www.dovepress.com/ by 118.70.13.36 on 26-Aug-2020
MV in the arms compared to baseball and tennis players. Despite the dramatic worldwide increase in lacrosse, only a few studies have examined the physical characteristics of male lacrosse players.29,30 Although recommendations con-cerning resistance training for male lacrosse players have been reported,31 there is a lack of objective experimental data about their muscle mass and strength characteristics. Lacrosse requires catching, passing, and shooting with a crosse carried in both arms, but does not require directly hitting a high-speed ball. Therefore, compared to the upper arms, the hypertrophy of muscles in the forearms developed during practice is predicted to be relatively smaller; however, it is unknown if greater forearm strength is necessary for accuracy and velocity during passing and shooting. Further studies are required to establish objective recommendations about strength training for male lacrosse players.
Baseball players had significant D/N characteristics in their upper arms. They, however, did not have significant D/N characteristics in volumes of their forearm, thigh, or lower leg muscles. A previous study also reported a significantly larger MV of the deltoid muscle on the dominant side of baseball players,32 but another study reported no significant difference in forearm muscle strength.33 A possible explanation for the difference may be that batting uses both hands, and the large impact and high-power output of muscle contraction is evoked in both forearm muscles.
Tennis, baseball, and lacrosse athletes had a signifi-cantly larger MV in their dominant upper arm than in their nondominant upper arm; however, tennis athletes had the largest difference (12.5%) between their dominant and non-dominant upper-arm MVs compared to the other athletes. Furthermore, only tennis athletes had a significantly larger difference (10.4%) between their dominant and nondominant forearm MVs.34–38 In soccer, upper body dominance may not be expected due to the demands of the sport, because upper body muscles are just required during running in the soccer match. However, in baseball and lacrosse, the upper body is used extensively; in the two sports, the bat or stick, respectively, is held with both hands. Tennis players could be discriminated from the other athletes mainly by the larger ratio of D/N MV in the upper arm and forearm.
Soccer athletes had significantly larger MV (4.57%) in the dominant thigh than in the nondominant thigh in the present study. Although we are unaware of a study that has examined MV differences between dominant and nondominant thigh muscles, various studies have examined their strength dif-ferences.9,39–43 Some of these studies reported a significant strength difference between dominant and nondominant thigh
muscles,39–41 whereas others reported no difference.42,43 One reason for the discrepancy may be the selection criteria for footedness, because footedness is not as easy to distinguish as handedness.13,14 We used Chapman’s multi-item foot-preference test to select only right-pure or right-strong footed athletes.14,15 Some previous studies44,45 defined the dominant leg as just the kicking leg, which could have influenced the results of those previous studies. Another possible reason may be the relatively small (5%) difference between dominant and nondominant thigh MVs compared to the larger (.10%) difference between dominant and nondominant arm MVs in tennis players. In the previous studies44,45 that reported no significant differences, small tendencies for differences were observed (2%–7%) that could easily be masked by measure-ment error or a small sample size. This is particularly true with muscle strength, which can be affected by psychological factors or measurement order. Our results suggest that soc-cer players, who had strong footedness, had a moderate but significant difference between dominant and nondominant thigh MVs.
SBIA can be used to estimate segmental MV as well as whole-body composition.3,8–10 However, BIA depends on several assumptions to estimate body composition or regional MV, and the accuracy of BIA remains a subject of debate, especially the frequently used single-frequency BIA (50 kHz), which is subject to error due to changes in extracel-lular water (ECW) balance.44 Therefore, measurement condi-tions are vitally important. In our research, we minimized the effect of altered fluid balance, exercise, food, temperature, postural change, orthopedic disorders, acute disease, and competitive season. In addition, we used equations validated for college athletes to estimate whole-body composition and segmental MV,9,10 thus maximizing the reliability of %BF, LBM, and segmental MV measurements.
A limitation of our study is that we did not examine kinetics (eg, using electromyography or inverse dynamics based on motion analysis) regarding how the athletes use their muscles during sports-specific movements. In addition, it remains uncertain whether motor-skill training or strength training influences sports-specific muscle distribution. Previ-ous studies suggest that regular participation in competitive sports programs during early adolescence contributes to increased muscularity and strength capability.45–47 If we con-sider strength training as a practice component of a particular sport, we could conclude that muscle distribution is induced by practice and games. Furthermore, studies comparing expertise and career as well as longitudinal studies are among the necessary future investigations. Since this study
Dovepress Muscle distribution difference in ball sports
Open Access Journal of Sports Medicine downloaded from https://www.dovepress.com/ by 118.70.13.36 on 26-Aug-2020
only involved Japanese subjects, the results in this study may be only generalizable to Japanese or general Asian popula-tions. Thus, further studies on other ethnicities are needed.
For error analysis, although the potential measurement error of impedance is relatively small (up to 1%), the potential measurement error of segment length is large (up to 2%). The impact of measurement error of segment length on calculating muscle volume is up to 4%, and the impact on calculating MV ratio is up to 5.7%. It should be noted that the measuring accuracy of segmental length is fundamental to calculate MV and MV ratio.
Whole-body BIA is affected by %BF.6 In contrast, the effect of the distribution of fat on the estimation of segmental MV by SBIA is unknown.11,48 The distribution of body fat may vary depending on sports participation.49 It is important to examine fat and muscle distribution simultaneously. Further studies are needed.
We estimated muscle volume by SBIA, which is a second-ary method to estimate MV and inferior to MRI or CT. The previous studies that examined the validity of SBIA to esti-mate MV with MRI10,17,50 had important limitations, including (1) the accuracy estimations of MV would vary depending on subject samples; and (2) smaller islands of adipose tissue within the skeletal muscle bundle were not fully excluded, and so the skeletal volume might be overestimated.51 Therefore, further study to clarify the influences in the subject samples and especially the method used to analyze the MRI scans to estimate skeletal MV, is needed to generalize the findings obtained in the present study. Sanchis-Moysi et al25–28 exam-ined the segmental MVs in professional and prepubescent tennis players and soccer players recently. We would like to note that SBIA is an affordable, noninvasive, easy-to-operate, portable, and fast (within 5–10 minutes) alternative for assessing segmental or whole-body MV. Thus, SBIA can be a practical method for assessing MV as a primary physical checkup. The present results show its feasibility in telling the difference among baseball, soccer, tennis and lacrosse players, and further suggest that these players have adapted their physique to their specific sports. The SBIA could be a useful, affordable, and fast tool for identifying talents for specific sports.
Conclusion
We identified inter-sport differences in muscle distribution in baseball, soccer, lacrosse, and tennis players using SBIA. When comparing lacrosse, baseball, and tennis players, it was evident that the impact of ball hitting during practice and games promotes muscle hypertrophy in the forearm.
We also demonstrated that the use of the MV ratio between segments can prevent the multicollinearity problem encoun-tered in multivariate analysis. The SBIA, a simple and rapid assessment instrument, can be applied to distinguish ball game athletes based on their specific muscle distribution and might be useful for assessment and target-setting in training and sport rehabilitation.
Acknowledgment
The authors thank Professor Dale A Schoeller (Nutritional Sciences, University of Wisconsin, Madison, WI, USA) for helpful discussions and editing of the manuscript.
Disclosure
This study was supported by a research grant for YY from Research Fellowships of the Japan Society for the Promotion of Science for Young Scientists, Tokyo, Japan (23-333).
References
1. Sinning WE. Body composition in athletes. In: Roche AF, Heymsfield SB, Lohman TG, editors. Human Body Composition. Champaign, IL: Human Kinetics; 1996:257–273.
2. Holzbaur KR, Murray WM, Gold GE, Delp SL. Upper limb muscle volumes in adult subjects. J Biomech. 2007;40(4):742–749.
3. Yamada Y, Yamashita D, Yamamoto S, et al. Whole-body and segmental muscle volume are associated with ball velocity in high school baseball pitchers. Open Access Journal of Sports Medicine. 2013;4:89–95. 4. Kyle UG, Genton L, Karsegard L, Slosman DO, Pichard C. Single
prediction equation for bioelectrical impedance analysis in adults aged 20–94 years. Nutrition. 2001;17(3):248–253.
5. Baumgartner RN. Electrical impedance and total body electrical conductivity. In: Roche AF, Heymsfield SB, Lohman TG, editors.
Human Body Composition. Champaign, IL: Human Kinetics; 1996: 79–107.
6. Yamada Y, Masuo Y, Yokoyama K, et al. Proximal electrode placement improves the estimation of body composition in obese and lean elderly during segmental bioelectrical impedance analysis. Eur J Appl Physiol. 2009;107(2):135–144.
7. Organ LW, Bradham GB, Gore DT, Lozier SL. Segmental bioelectrical-impedance analysis: theory and application of a new technique. J Appl Physiol. 1994;77(1):98–112.
8. Lorenzo AD, Andreoli A. Segmental bioelectrical impedance analysis.
Curr Opin Clin Nutr Metab Care. 2003;6(5):551–555.
9. Ishiguro N, Kanehisa H, Miyatani M, Masuo Y, Fukunaga T. A com-parison of three bioelectrical impedance analyses for predicting lean body mass in a population with a large difference in muscularity. Eur J Appl Physiol. 2005;94(1–2):25–35.
10. Miyatani M, Kanehisa H, Masuo Y, Ito M, Fukunaga T. Validity of estimating limb muscle volume by bioelectrical impedance. J Appl Physiol. 2001;91(1):386–394.
11. Yamada Y, Schoeller DA, Nakamura E, Morimoto T, Kimura M, Oda S. Extracellular water may mask actual muscle atrophy during aging.
J Gerontol A Biol Sci Med Sci. 2010;65(5):510–516.
12. Oldfield RC. The assessment and analysis of handedness: the Edinburgh inventory. Neuropsychologia. 1971;9(1):97–113.
13. Chapman JP, Chapman LJ, Allen JJ. The measurement of foot preference.
Neuropsychologia. 1987;25(3):579–584.
14. Gabbard C, Hart S. A question of foot dominance. J Gen Psychol. 1996;123(4):289–296.
Dovepress
Yamada et al
Open Access Journal of Sports Medicine downloaded from https://www.dovepress.com/ by 118.70.13.36 on 26-Aug-2020
15. [No authors listed]. NIH Consensus statement. Bioelectrical impedance analysis in body composition measurement. National Institutes of Health Technology Assessment Conference Statement. December 12–14, 1994. Nutrition. 1996;12(11–12):749–762. 16. Pietrobelli A, Morini P, Battistini N, Chiumello G, Nunez C,
Heymsfield SB. Appendicular skeletal muscle mass: prediction from multiple frequency segmental bioimpedance analysis. Eur J Clin Nutr. 1998;52(7):507–511.
17. Tanaka NI, Miyatani M, Masuo Y, Fukunaga T, Kanehisa H. Applicability of a segmental bioelectrical impedance analysis for predicting the whole body skeletal muscle volume. J Appl Physiol. 2007;103:1688–1695. 18. Miyatani M, Kanehisa H, Fukunaga T. Validity of bioelectrical
imped-ance and ultrasonographic methods for estimating the muscle volume of the upper arm. Eur J Appl Physiol. 2000;82(5–6):391–396. 19. Yamada Y, Kimura M, Nakamura E, Masuo Y, Oda S. Limb muscle
mass decrease with aging in Japanese men and women aged 15–97 yr.
Japanese Journal of Physical Fitness and Sports Medicine. 2007;56(5): 461–472. Japanese with English abstract.
20. Metter EJ, Lynch N, Conwit R, Lindle R, Tobin J, Hurley B. Muscle qual-ity and age: cross-sectional and longitudinal comparisons. J Gerontol A Biol Sci Med Sci. 1999;54(5):B207-B218.
21. Leone M, Lariviere G, Comtois AS. Discriminant analysis of anthropo-metric and biomotor variables among elite adolescent female athletes in four sports. J Sports Sci. 2002;20(6):443–449.
22. Joyner MJ, Coyle EF. Endurance exercise performance: the physiology of champions. J Physiol. 2008;586(1):35–44.
23. Iaia FM, Hellsten Y, Nielsen JJ, Fernström M, Sahlin K, Bangsbo J. Four weeks of speed endurance training reduces energy expenditure during exercise and maintains muscle oxidative capacity despite a reduction in training volume. J Appl Physiol. 2009;106(1):73–80.
24. Costill DL, Daniels J, Evans W, Fink W, Krahenbuhl G, Saltin B. Skeletal muscle enzymes and fiber composition in male and female track athletes.
J Appl Physiol. 1976;40(2):149–154.
25. Sanchis-Moysi J, Idoate F, Dorado C, Alayon S, Calbet JA. Large asym-metric hypertrophy of rectus abdominis muscle in professional tennis players. PLoS One. 2010;5(12):e15858.
26. Sanchis-Moysi J, Idoate F, Izquierdo M, Calbet JA, Dorado C. Iliopsoas and gluteal muscles are asymmetric in tennis players but not in soccer players. PLoS One. 2011;6(7):e22858.
27. Sanchís-Moysi J, Idoate F, Olmedillas H, et al. The upper extremity of the professional tennis player: muscle volumes, fiber-type distribution and muscle strength. Scand J Med Sci Sports. 2010;20(3):524–534. 28. Sanchis-Moysi J, Idoate F, Serrano-Sanchez JA, Dorado C, Calbet JA.
Muscle hypertrophy in prepubescent tennis players: a segmentation MRI study. PLoS One. 2012;7(3):e33622.
29. Withers RT, Craig NP, Bourdon PC, Norton KI. Relative body fat and anthropometric prediction of body density of male athletes. Eur J Appl Physiol Occup Physiol. 1987;56(2):191–200.
30. Steinhagen MR, Meyers MC, Erickson HH, Noble L, Richardson MT. Physiological profile of college club-sport lacrosse athletes. J Strength Cond Res. 1998;12(4):226–231.
31. Burger TA, Burger ME. A preseason resistance training program for men’s lacrosse. Strength Cond J. 2006;28(3):20–27.
32. Hasegawa S, Tachi H, Saito K, Wang L, Kato K. Muscle volume and strength charateristics [sic] of the rotator cuff and deltoid muscles in asymptomatic baseball pitchers. Japanese Journal of Physical Fitness and Sports Medicine. 2004;53(5):483–492. Japanese with English abstract.
33. Mikesky AE, Edwards JE, Wigglesworth JK, Kunkel S. Eccentric and concentric strength of the shoulder and arm musculature in collegiate baseball pitchers. Am J Sports Med. 1995;23(5):638–642.
34. Ellenbecker TS, Ellenbecker GA, Roetert EP, Silva RT, Keuter G, Sperling F. Descriptive profile of hip rotation range of motion in elite tennis players and professional baseball pitchers. Am J Sports Med. 2007;35(8):1371–1376.
35. Ellenbecker TS, Roetert EP. Testing isokinetic muscular fatigue of shoulder internal and external rotation in elite junior tennis players.
J Orthop Sports Phys Ther. 1999;29(5):275–281.
36. Ellenbecker TS, Roetert EP. Isokinetic profile of elbow flexion and extension strength in elite junior tennis players. J Orthop Sports Phys Ther. 2003;33(2):79–84.
37. Ellenbecker TS, Roetert EP, Riewald S. Isokinetic profile of wrist and forearm strength in elite female junior tennis players. Br J Sports Med. 2006;40(5):411–414.
38. Ducher G, Jaffre C, Arlettaz A, Benhamou CL, Courteix D. Effects of long-term tennis playing on the muscle-bone relationship in the dominant and nondominant forearms. Can J Appl Physiol. 2005;30(1):3–17. 39. Kramer JF, Balsor BE. Lower extremity preference and knee extensor
torques in intercollegiate soccer players. Can J Sport Sci. 1990;15(3): 180–184.
40. Masuda K, Kikuhara N, Takahashi H, Yamanaka K. The relationship between muscle cross-sectional area and strength in various isoki-netic movements among soccer players. J Sports Sci. 2003;21(10): 851–858.
41. Ostenberg A, Roos E, Ekdahl C, Roos H. Isokinetic knee extensor strength and functional performance in healthy female soccer players.
Scand J Med Sci Sports. 1998;8(5 Pt 1):257–264.
42. Sangnier S, Tourny-Chollet C. Comparison of the decrease in strength between hamstrings and quadriceps during isokinetic fatigue testing in semiprofessional soccer players. Int J Sports Med. 2007;28(11): 952–957.
43. Agre JC, Baxter TL. Musculoskeletal profile of male collegiate soccer players. Arch Phys Med Rehabil. 1987;68(3):147–150.
44. Schoeller DA. Bioelectrical impedance analysis. What does it measure?
Ann N Y Acad Sci. 2000;904:159–162.
45. Stenevi-Lundgren S, Daly RM, Karlsson MK. A school-based exercise intervention program increases muscle strength in prepubertal boys. Int J Pediatr. 2010;2010:307063.
46. Hoshikawa Y, Iida T, Muramatsu M, et al. Thigh muscularity and strength in teenage soccer players. Int J Sports Med. Epub October 11, 2012. 47. Ara I, Vicente-Rodriguez G, Perez-Gomez J, et al. Influence of
extra-curricular sport activities on body composition and physical fitness in boys: a 3-year longitudinal study. Int J Obes (Lond). 2006;30(7): 1062–1071.
48. Karelis AD, Chamberland G, Aubertin-Leheudre M, Duval C. Validation of a portable bioelectrical impedance analyzer for the assessment of body composition. Appl Physiol Nutr Metab. 2013;38(1):27–32. 49. Abe T, Sakurai T, Kurata J, Kawakami Y, Fukunaga T. Subcutaneous
and visceral fat distribution and daily physical activity: comparison between young and middle aged women. Br J Sports Med. 1996;30(4): 297–300.
50. Ishiguro N, Kanehisa H, Miyatani M, Masuo Y, Fukunaga T. Applicability of segmental bioelectrical impedance analysis for pre-dicting trunk skeletal muscle volume. J Appl Physiol. 2006;100(2): 572–578.
51. Hu HH, Nayak KS, Goran MI. Assessment of abdominal adipose tissue and organ fat content by magnetic resonance imaging. Obes Rev. 2011; 12(5):e504–e515.
Dovepress Muscle distribution difference in ball sports
Open Access Journal of Sports Medicine downloaded from https://www.dovepress.com/ by 118.70.13.36 on 26-Aug-2020
Open Access Journal of Sports Medicine
Publish your work in this journal
Submit your manuscript here: http://www.dovepress.com/open-access-journal-of-sports-medicine-journal
Open Access Journal of Sports Medicine is an international, peer-reviewed, open access journal publishing original research, reports, reviews and commentaries on all areas of sports medicine. The manuscript management system is completely online and includes a very quick and fair peer-review system.
Visit http://www.dovepress.com/testimonials.php to read real quotes from published authors.
Dovepress
Dove
press
Yamada et al
Open Access Journal of Sports Medicine downloaded from https://www.dovepress.com/ by 118.70.13.36 on 26-Aug-2020