ISSN 2286-4822 www.euacademic.org
Impact Factor: 3.1 (UIF) DRJI Value: 5.9 (B+)
Mapping of Lineaments in Adwa River Basin Using
Remote Sensing and GIS Techniques
SHARMISTHA NAGAL Research Scholar Department of Geography University of Allahabad India
Abstract:
which has numerous long and short fractures/lineation whose structural trends are mainly to the Son Narmada Tapti Lineament and gets the special significance to the given study area. The extracted lineaments were statistically analyzed to determine lengths and intersections of the lineaments to create rose diagram and lineament map.
Key words: Lineaments, Neotectonic, LISS-III satellite image, River basin
1. Introduction
faults, exploration of mineral deposits, petroleum prospects and groundwater etc.
The Adwa river basin has been evolved as a result of typical hydro geomorphic processes of semi-arid zone, operating under the influence of active tectonic lineaments. A detailed analysis of stream morphology in relation to geology and lineaments carried out over the entire Adwa River Basin indicated the morphological control of the streams while flowing over the lineaments from the western to the eastern part of the basin.
Objective of the study
The purpose of this study is to analyze the spatial distribution of lineaments extracted from remotely sensed satellite data to analyze length and orientation for the understanding of the faults and their association to the Son Narmada Lineaments. Thus to prepare a detailed classification of major and minor lineaments and their influence on hydro geomorphic processes in the Adwa river basin this study has been undertaken.
2. Study Area
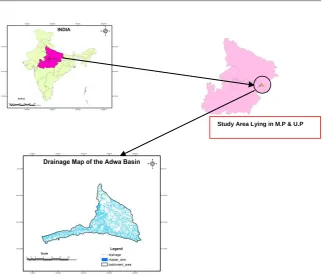
The Adwa River is the tributary of the Belan river and the Belan river is the tributary of the Tons and then the Ganges river system. The Adwa River meets the Belan River in the Mirzapur district of Uttar Pradesh though the pear shaped basin of the Adwa River stretches between two states i.e. Uttar and Madhya Pradesh. The boundary of the two states almost bisects the Adwa river basin. The latitudinal and longitudinal extent of this basin is from 24o 34’ N to 24o 54’ N and from 82o
06’ E to 82o 33’ E respectively. This study area covers the total
Fig. 1 Study Area with its general drainage
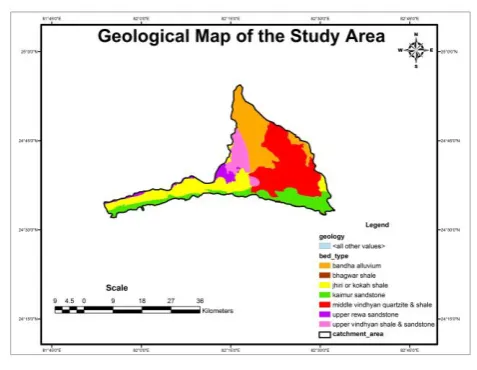
3. Geology of the Study Area
Geologically the area mapped forms part of Vindhyan Plateau. The river basin lies in between Ganga River Basin in the North and Vindhyan Mountain System in the South. The rocks of the Kaimur group being the oldest in the area, forms vast plateau on both the flanks of Belan River and its tributary mainly Adwa River. These are overlain by the rocks of the Rewa Group which comprises of argilloarenaceous sequence. Many different tectonic phases and neotectonic movements have intensively affected these rocks. Sedimentary structures preserved indicate on a shallow water stables shelf environment. Both planar and trough shaped cross beds have been recorded. Cross beds indicate northwest to southeast palaeo current direction, some evidences of neo tectonic have been recorded from rocks of the
Dhandraul Formation. Ichno-fossils have been identified in Lower Rewa sandstone of Rewa Group. The two-third of the southern part of the Adwa basin lies in Northern Foreland of Peninsular India (NFPI) and only one – third of northern portion of basin lies on the fertile Gangetic plain.
Fig. 2 Geological Set-up of the Study Area
4. Lineament
Lineaments/fractures are defined as mappable linear surface features, which differ distinctly from the patterns of adjacent features and presumably reflect subsurface phenomena (O’Leary et al. 1976). Satellite data along with aerial photographs are widely used to extract lineaments for different studies. The study of lineaments has been applied successfully to structural geology studies and their applications such as ore forming systems, mineral exploration, petroleum etc.
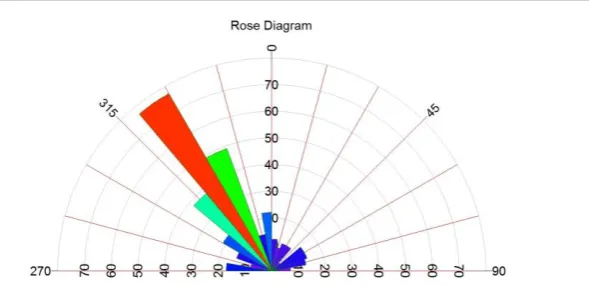
South-Southeast (SSE). These directions have been correlated with the Neo-Tectonics by Pati.et.al (2006).
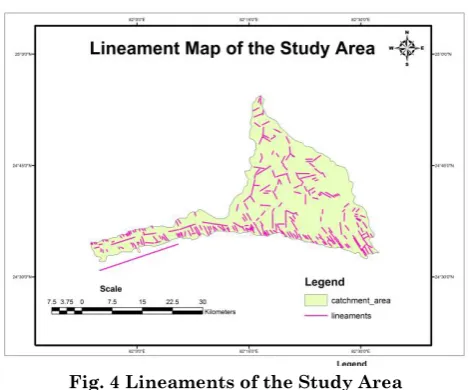
Fig.3 Major Lineament Map of the Study Area
Fig. 5 Rose Diagram of Lineament Distribution of the Study Area
5. Methodology for Lineament Analysis
The structural data featuring joints/fractures, foliations and lineament orientations have been analyzed very critically. Several lineaments run NE-SW, NW-SE, E-W and WNW-ESE directions (Fig. 4), which control the basement structure in the study area.
Some additional digital image processing techniques like contrast enhancement, contrast stretch, color composites and spatial filtering is also used to mark lineaments using Erdas Imagine 9.1 (image processing software). ArcGIS 9.3 (a GIS software) was used for database creation, azimuth direction, lineaments length and lineaments classification using different criteria e.g. direction, origin and types etc.
The study of these lineaments in relation to geology, structure, magnetism, mineralization and deep geophysical responses etc. led to the classification of these lineaments into various groups and classes.
1) Stream and streams segment designates relatively short; straight channel reaches commonly connecting at sharp, angular junctions. Stream segments include the shortest lineaments recognized, as short as 2 km long. Stream segments were delineated only if they were part of a distinctive sequence of linear channels.
2) Drainage line designates linear valley trends independent of the orientation or linearity of channel segments.
3) Scarp and fault line scrap designates a prominent topographic break evident because of changes in land cover or land use, changes in drainage pattern, variations in outcropping rock units, or the presence of shadows on the imagery.
4) In dividing lineaments between the high plains and rolling plains categories, the scarps of the caprock escarpment boundary feature are considered separately as a unique physiographic category.
6) Tonal anomaly designates as a linear feature.
Based on the length of individual lineaments, such lineaments have been classified:
(i) Micro (ii)minor (iii)medium (iv)major (v) mega
5.1. Lineament Extraction
Two most widely used common methods for the extraction of lineaments from satellite images are:
1) Visual extraction: At which the user primarily starts by image processing method to make edge enhancements, using the directional and non directional filters such as the Laplacian, and Sobel, then the lineaments are digitized manually by the user.
2) Automatic (digital) extraction: different computer-aided methods for lineament extraction have been proposed. Mainly used in the lineament extraction methods are based on edge enhancement techniques.
In this study, the author has used the Visual Extraction technique to extract lineaments from the satellite image and 5 major and 346 micro, minor and medium lineaments are extracted from IRS LISS-3 images data. The resulted lineament maps (shown in Figures 3 and 4) and the frequency distribution of micro, minor and medium lineaments are represented with the help of a rose diagram as seen in Fig.5. Manually extracted lineaments are evaluated in order to extract further information on the distribution and nature of the lineaments.
5.2. Lineament Length
length into three categories. There are 296 lineaments of the micro type (< 2km) which is equal to about 84.33% which covers the larger part of the study area and 49 lineament are minor type which is equal to 13.96% and while only 1 is of medium category (Table 1). The resulting map reveals a range of lengths which are indicative of several geo-tectonic and geomorphic controls, mainly the power of the tectonic forces, rock hardness and consolidation, geomorphic setting of terrain where lineaments exist.
Table.1 Details of Different Lineament Types S.
No.
Type of Lineaments Total Number Percentage
1. Micro (< 2kms) 296 84.33%
2. Minor (2 to 10kms) 49 13.96%
3. Medium (10 to 20kms) 1 0.28%
4. Major (20 to 100kms) 5 1.42%
Total Number of Lineaments 351
5.3. Classification of Lineaments
The length of lineaments can be used for further classification keeping in mind the high resolution data/large scale of mapping (up to 1:5000) possible. Lineaments can be classified based on their length as (i) micro: <2 km, (ii) minor: 2-10 km, (iii) medium: 10-20 km, (iv) major: 20-100km, and (v) mega > 100 km.
5.4 Lineament Trends in the Area
6. Conclusion
Acknowledgement
I would like to convey my heartfelt thanks to Prof. Sanjay Tignath for helping me out in this study and supervising me in the geological aspect of this paper.
REFERENCES
Bhave, K.N., Ganju, J.L., and Jokhan, Ram, 1989: Origin, Nature and Geological Significance of Lineaments. In: Qureshy, M.N., and Hinze, W.J (Ed.). Regional Geophysical Lineaments their Tectonic and Economic Significance. Mem. Geol. Soc. India, Vol. 12; 35-42. Drury, S., Image interpretation in Geology, Chapman and Hall,
London, 1993.
Gupta, R.P., 1991. Remote Sensing Geology. Spinder Verlag, Germany.
Hobbs, W. H. “Lineaments of the Atlantic Border region ,” Geological Society, vol. 15, pp. 483–506, 1904.
Hung, L.Q., “Remote sensing based hydrogeological analysis of Suoimuoi catchment Vietnam [MSc thesis]”, Vrije Universiteit Brussel, 87p, 2001.
Jensen, J.R., 1986. Introductory Digital Image Processing. Prentice, Hall, USA
Lillesand, T M,1989 Remote Sensing and Image interpretation; Wiley, USA.
Mostafa, M., Zakir, F., “New enhanced techniques for azimuthal analysis of lineaments for detecting tectonic trends in and around the Afro-Arabian Shield”, International Journal of Remote Sensing, 17, 2923– 2943, 1996.
Pati, J.K, V.P Malviya and K.Prakash (2006). Basement Reactivation and its relation to Neo-Tectonic activity in and around Allahabad, Ganga Plain. Journal of Indian Society of Remote Sensing, Vol.34, No.1, 2006.
P. C. I. Geomatica, PCI Geomatica User’s Guide Version 9. 1, Richmond Hill , Ontario, Canada, 2001.