ISSN (Print) : 2320 – 3765 ISSN (Online): 2278 – 8875
I
nternational
J
ournal of
A
dvanced
R
esearch in
E
lectrical,
E
lectronics and
I
nstrumentation
E
ngineering
(An ISO 3297: 2007 Certified Organization)
Vol. 5, Issue 12, December 2016
Simulation of different Topologies for Active
Power Factor Correction Using DC – DC
Converters
Mohammad Ilyas1 Ombir singh2
Assistant Professor, Dept. of EEE, Al-Flah University, Faridabad, Haryana, India1
M. Tech Student [Power Systems], Dept. of EEE, Al-Flah University, Faridabad, Haryana, India2
ABSTRACT: With rapid development in power semiconductor devices, the usage of power electronic systems has expanded to new and wide application range that include residential, commercial, aerospace and traction system and SMPS. The current drawn by power semi converter devices from the line is distorted resulting in a high Total Harmonic Distortion (THD) and low Power Factor (PF). Hence, there is a continuous need for power factor improvement and reduction of line current harmonics. In this paper we have done the comparative analysis of various circuits for Power Factor Correction using active PFC circuits. It is based on an optimized power sharing strategy to improve the current quality and at the same time to reduce the switching losses. Voltage mode control is used for switching operation of Buck Converter and Average current mode control is used for switching operation of Boost and Dual Boost Converter based PFC methods. Key words: Power factor, Buck converter, Boost converter, Dual Boost converter, Voltage mode control, Average Current mode control. There are multiple solutions to make line current is nearly sinusoidal. This paper also presents the technique for single phase power factor correction of non-linear loads using an active power filter.
I. INTRODUCTION
An ac to dc converter consisting of a line frequency diode bridge rectifier with a large output filter capacitor is cheap and robust, but demands a harmonic rich ac line current. As a result, the input power factor is poor - [1]. The most common power quality disturbance is instantaneous power interruption, lasting only a few cycles and happening randomly. The fault time is less than the hold-up time in switched mode power supplies (SMPS). Hence the SMPS must to support the load without turn-off under instantaneous power disturbances. Nevertheless, the PFC pre-regulator often breaks under these disturbances, even when nominal voltage returns in just a few cycles - [2]. Various power factor correction (PFC) techniques are employed to overcome these power quality problems [3] out of which the boost converter topology has been extensively used in various ac/dc and dc/dc applications. In fact, the front end of today’s ac/dc power supplies with power-factor correction (PFC) is almost exclusively implemented with Active PFC topologies [4], [7], [8]. The use of Power Factor Correction (PFC) is necessary in order to comply the recent international standards, such as IEC-1000-3-2 and IEEE-519 – [5]. The bulky size of these filters, their poor dynamic response, complexity and high cost, the lack of voltage regulation and their sensitivity to line-frequency, limits their use to below 200 W applications.. This has led to many proposed topologies such as the tapped-inductor boost, cascaded boost and interleaved boost converters [5-8]. This paper introduces another variation, Dual Boost PFC Converter which provides a higher boost factor and also provides proper controlling - [6], [9]. Here Average Current Control method is used for better control. This paper initially involves simulation of basic power electronic conventional rectifier circuits and the analysis of the current and voltage waveforms. It starts with simple circuits and switches to advanced circuits by implementing advanced techniques such as Active PFC and their subsequent effect on the current and voltage waveforms expecting better results, mainly focusing on the objective of improving the input current waveform i.e. making it sinusoidal by tuning the circuits. All the simulation work is carried out in MATlab – Simulink.
ISSN (Print) : 2320 – 3765 ISSN (Online): 2278 – 8875
I
nternational
J
ournal of
A
dvanced
R
esearch in
E
lectrical,
E
lectronics and
I
nstrumentation
E
ngineering
(An ISO 3297: 2007 Certified Organization)
Vol. 5, Issue 12, December 2016
II. POWER FACTOR WITH LOADS
Power factor is defined as the cosine of the angle between voltage and current in an ac circuit. If the circuit is inductive, the current lags behind the voltage and power factor is referred to as lagging. However, in a capacitive circuit, current leads the voltage and the power factor is said to be leading.
Fig1: Power Triangle
= /
1 .Linear Systems
In a linear system, the load draws purely sinusoidal current and voltage; hence the power factor is determined only by the phase difference between voltage and current.
2. Nonlinear Systems
In non linear systems like power electronic systems, due to the non-linear behavior of the active switching of power devices, the phase angle representation alone is not valid. A non linear load draws typical distorted line current from the line. For sinusoidal voltage and non- sinusoidal current the PF can be expressed as
PF =VrmsI1rms
VrmsIrms cosØ
PF =I1rms
Irms cosØ
= Ø Kp = cosØ, ← [0,1]
Where, cosΦ is the displacement factor of the voltage and current. Kp is the purity factor or the distortion factor.
Another important parameter that measures the percentage of distortion is known as the current total harmonic distortion (THDi) which is defined as follows:
Kp =
=
a. Harmonics
All types of switching converters produce harmonics because of the non-linear relationship between the voltage and current across the switching device. Harmonics are also produced by Power generation equipment (slot harmonics). Induction motors (Saturated magnetic).Transformers (Over excitation leading to saturation) Magnetic-ballast fluorescent lamps (arcing) and AC electric arc furnaces etc. III
III. RECTIFIERS
ISSN (Print) : 2320 – 3765 ISSN (Online): 2278 – 8875
I
nternational
J
ournal of
A
dvanced
R
esearch in
E
lectrical,
E
lectronics and
I
nstrumentation
E
ngineering
(An ISO 3297: 2007 Certified Organization)
Vol. 5, Issue 12, December 2016
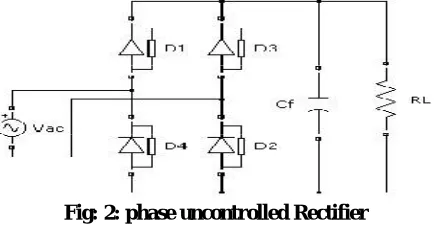
i) Uncontrolled Rectifiers
Uncontrolled rectifiers are used as front -end converters in SMPSs, VFDs, DC power supplies, and some UPSs. The circuit diagram of single phase uncontrolled rectifier is shown in fig.2
Fig: 2: phase uncontrolled Rectifier
Generally uncontrolled rectifiers are connected directly to a DC smoothing capacitor.fig. 3 show its input voltage and current waveforms.
Fig: 3: Single phase uncontrolled rectifier waveforms
ii) Controlled Rectifier
Controlled rectifiers are used in variable speed DC drives DC power plants, induction heating and welding furnace control, etc. Fig. 4 shows the circuit diagram of the single-phase fully controlled rectifier
Fig: 4: Single phase controlled Rectifier
The controlled rectifier is normally connected to a smoothing controlled rectifier could be considered as constant.fig 5 shows the input voltage and current waveforms.
ISSN (Print) : 2320 – 3765 ISSN (Online): 2278 – 8875
I
nternational
J
ournal of
A
dvanced
R
esearch in
E
lectrical,
E
lectronics and
I
nstrumentation
E
ngineering
(An ISO 3297: 2007 Certified Organization)
Vol. 5, Issue 12, December 2016
The predominant harmonic component in the current waveform is the third and the displacement angle is Ø. While using rectifier circuits, voltage distortions take place due to two factors namely, commutation notches and voltage clamping.
Fig.6: Harmonic content of the current wave obtained from a Rectifier circuit.
IV. NEED FOR IMPROVEMENT OF POWER FACTOR
Conventional AC rectification is thus a very inefficient process, resulting in waveform distortion of the current drawn from the mains. This produces a large spectrum of harmonic signals that may interfere with other equipment.
At higher power levels (200 to 500 watts and higher) severe interference with other electronic equipment may become apparent due to these harmonics sent into the power utility line. Another problem is that the power utility line cabling, the installation and the distribution transformer, must all be designed to withstand these peak current values resulting in higher electricity costs for any electricity utility company.
Conventional AC rectification has the following main disadvantages:
It creates harmonics and electromagnetic interference (EMI).
It has poor power factor.
It produces high losses.
It requires over-dimensioning of parts.
It reduces maximum power capability from the line.
A. ACTIVE PFC METHODS
An active approach is the most effective way to correct power factor of electronic supplies. Here, we place different Active PFC converters between the bridge rectifier and the load. The converter tries to maintain a constant DC output bus voltage and draws a current that is in phase with and at the same frequency as the line voltage.
Advantages:
• Active wave shaping of the input current • Filtering of the high frequency switching
• Feedback sensing of the source current for waveform control • Feedback control to regulate output voltage
i) Buck Converter
ISSN (Print) : 2320 – 3765 ISSN (Online): 2278 – 8875
I
nternational
J
ournal of
A
dvanced
R
esearch in
E
lectrical,
E
lectronics and
I
nstrumentation
E
ngineering
(An ISO 3297: 2007 Certified Organization)
Vol. 5, Issue 12, December 2016
Fig7: Buck Converter
ii). Boost Converter
The key principle that drives the boost converter is the tendency of an inductor to resist changes in current. When being charged it acts as a load and absorbs energy (somewhat like a resistor); when being discharged it acts as an energy source (somewhat like a battery). The fig 8 shows Boost Converter Circuit. The voltage it produces during the discharge phase is related to the rate of change of current, and not to the original charging voltage, thus allowing different input and output voltages.
Fig.8: Boost Converter
iii). Dual Boost Converters
Conventionally, boost converters are used as active Power factor correctors. However, a recent novel approach for PFC is to use dual boost converter (fig.9) i.e. two boost converters connected in parallel. Where choke Lb1 and switch Tb1 are for main PFC while Lb2 and Tb2 are for active filtering the filtering circuit serves two purposes i.e. improves the quality of line current and reduces the PFC total switching loss. The reduction in switching losses occurs due to different values of switching frequency and current amplitude for the two switches.
The parallel connection of switch mode converter is a well known strategy. It involves phase shifting of two or more boost converters connected in parallel and operating at the same switching frequency.
Fig.9: Dual boost converter
V. CONTROL PRINCIPLE
ISSN (Print) : 2320 – 3765 ISSN (Online): 2278 – 8875
I
nternational
J
ournal of
A
dvanced
R
esearch in
E
lectrical,
E
lectronics and
I
nstrumentation
E
ngineering
(An ISO 3297: 2007 Certified Organization)
Vol. 5, Issue 12, December 2016
should be performed in a closed-loop manner using principles of negative feedback. The two most common closed-loop control methods for PWM dc-dc converters, namely the voltage-mode control and the current mode control
i) Voltage Mode Control
In this control mode converter output voltage is regulated and feedback through a resistive voltage divider. It is compared with a precision external reference voltage, Vref in a voltage error amplifier. The error amplifier produces a control voltage that is compared to a constant-amplitude saw tooth waveform. The comparator or the PWM Modulator produces a PWM signal that is fed to drivers of controllable switches in the dc-dc converter. The duty ratio of the PWM signal depends on the value of the control voltage.
Fig10: Schematic diagram for voltage mode control.
ii) Current Mode Control
This paper is focused on Current Mode Control. In this mode of control as shown in fig.11 Signals in current waveform has advantage over voltage signals. Voltage being an accumulation of flux, which is slow in time as far as control mechanism, is concerned. This led to the development of a new area in switch mode power supply design using Current Mode Control. Here, the average or peak current is employed in the feedback loop of the switch mode power converters. It has given new avenues of analysis and at same time introduced complexities in terms of multiple loops.
Fig.11: Current mode control
VI. SIMULATION AND RESULTS
This paper involves simulation of basic power electronic circuits and the analysis of the current and voltage waveforms. It starts with simple circuits with a gradual increase in complexity by inclusion of new components and their subsequent effect on the current and voltage waveforms. We focus on the objective of improving the input current waveform i.e. making it sinusoidal by tuning the circuits. All the simulation work is done in MATLAB Simulink.
i) Simulation and Results for Rectifier circuit with PFC Buck Converter
ISSN (Print) : 2320 – 3765 ISSN (Online): 2278 – 8875
I
nternational
J
ournal of
A
dvanced
R
esearch in
E
lectrical,
E
lectronics and
I
nstrumentation
E
ngineering
(An ISO 3297: 2007 Certified Organization)
Vol. 5, Issue 12, December 2016
Fig 12: Buck Converter
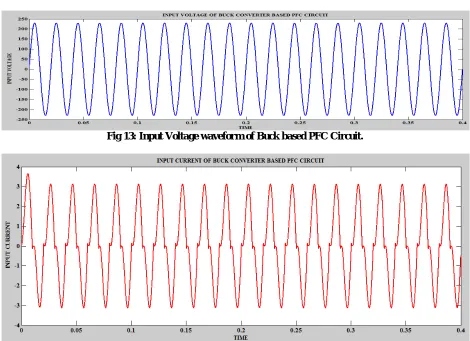
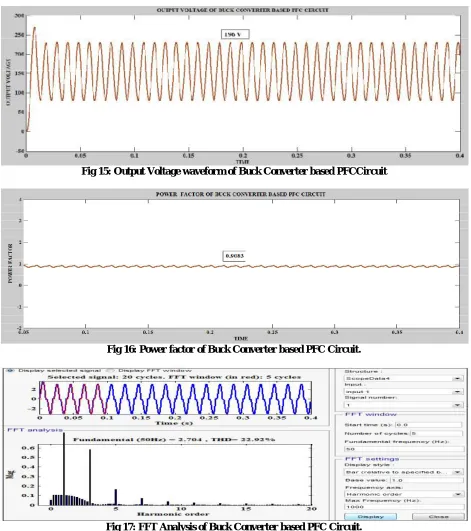
Here, Voltage mode Control is used for implementing control circuit to Buck Converter based PFC method. The circuit is simulated using Simulink and input current with respect to input voltage waveform and output waveforms are plotted in graph as shown in the fig13,fig14,fig15 respectively. The fig. 16 shows that the Power Factor is 0.9083 which is improved from previous model. The power Factor can be improved nearly unity by using Boost Converter.
Fig 13: Input Voltage waveform of Buck based PFC Circuit.
ISSN (Print) : 2320 – 3765 ISSN (Online): 2278 – 8875
I
nternational
J
ournal of
A
dvanced
R
esearch in
E
lectrical,
E
lectronics and
I
nstrumentation
E
ngineering
(An ISO 3297: 2007 Certified Organization)
Vol. 5, Issue 12, December 2016
Fig 15: Output Voltage waveform of Buck Converter based PFCCircuit
Fig 16: Power factor of Buck Converter based PFC Circuit.
Fig 17: FFT Analysis of Buck Converter based PFC Circuit.
ISSN (Print) : 2320 – 3765 ISSN (Online): 2278 – 8875
I
nternational
J
ournal of
A
dvanced
R
esearch in
E
lectrical,
E
lectronics and
I
nstrumentation
E
ngineering
(An ISO 3297: 2007 Certified Organization)
Vol. 5, Issue 12, December 2016
ii). Simulation and Results for Rectifier circuit with PFC Boost Converter
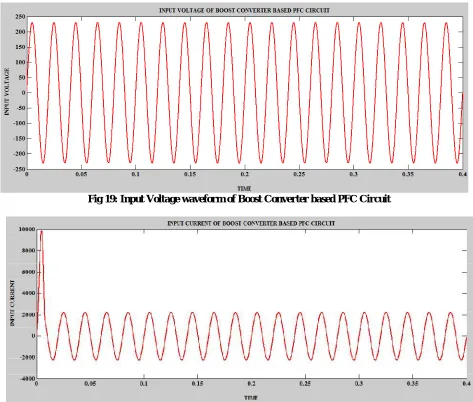
Boost converter is a DC-DC Converter which provides output voltage is greater than input voltage. Here, the inductor responds to changes in current by inducing its own voltage to counter the change in current, and this voltage adds to the source voltage while the switch is open. If a diode-and capacitor combination is placed in parallel to the switch, the peak voltage can be stored in the capacitor, and the capacitor can be used as a DC source with an output voltage greater than the DC voltage driving the circuit. This boost converter acts like a step-up transformer for DC signals are shown in fig: 18.
Fig.18: Boost Converter
ISSN (Print) : 2320 – 3765 ISSN (Online): 2278 – 8875
I
nternational
J
ournal of
A
dvanced
R
esearch in
E
lectrical,
E
lectronics and
I
nstrumentation
E
ngineering
(An ISO 3297: 2007 Certified Organization)
Vol. 5, Issue 12, December 2016
Fig 19: Input Voltage waveform of Boost Converter based PFC Circuit
Fig 20: Input Current of Boost Converter based PFC Circuit
ISSN (Print) : 2320 – 3765 ISSN (Online): 2278 – 8875
I
nternational
J
ournal of
A
dvanced
R
esearch in
E
lectrical,
E
lectronics and
I
nstrumentation
E
ngineering
(An ISO 3297: 2007 Certified Organization)
Vol. 5, Issue 12, December 2016
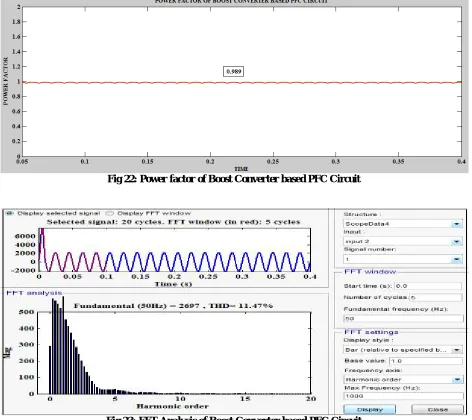
Fig 22: Power factor of Boost Converter based PFC Circuit
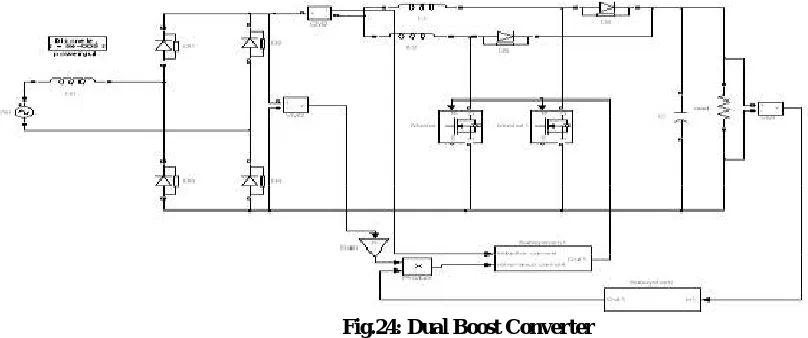
Fig 23: FFT Analysis of Boost Converter based PFC Circuit
iii) Simulation and Results for Rectifier circuit with PFC Dual Boost Converter
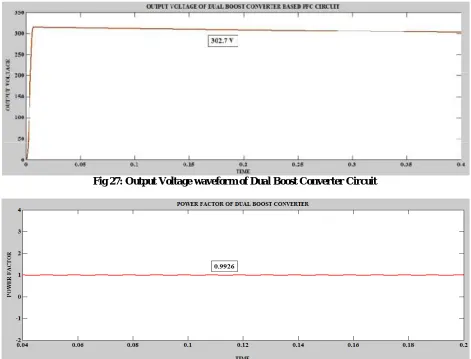
Fig. 24 shows the proposed topology. The inductors L1 & L2 have the same values, the diodes D5-D6 are the same type and the same assumption was for the MOSFETS (M1 & M2).
ISSN (Print) : 2320 – 3765 ISSN (Online): 2278 – 8875
I
nternational
J
ournal of
A
dvanced
R
esearch in
E
lectrical,
E
lectronics and
I
nstrumentation
E
ngineering
(An ISO 3297: 2007 Certified Organization)
Vol. 5, Issue 12, December 2016
Fig.24: Dual Boost Converter
When the MOSFETS M1 & M2 are in ON state, the proposed topology transfers energy from the dc source (Vb) into the inductors L1 & L2 . Here, the current divides and equal currents are flowing through inductor L1/Mosfet 1 and inductor L2/Mosfet2 the output current is flowing through load RL and C where C is the smoothing capacitor. I input current with respect to input voltage waveform and output waveforms are plotted in graph as shown in the fig. 25,fig26, fig27respectively. Here, the input current waveform is nearly sinusoidal. The power factor is increased from 0.9772 to 0.998 as shown in fig. 28. It is cleared from above figure that the power factor is made nearly unity by using Dual Boost Converter model and hence power at supply side and power at load side made equal.
ISSN (Print) : 2320 – 3765 ISSN (Online): 2278 – 8875
I
nternational
J
ournal of
A
dvanced
R
esearch in
E
lectrical,
E
lectronics and
I
nstrumentation
E
ngineering
(An ISO 3297: 2007 Certified Organization)
Vol. 5, Issue 12, December 2016
Fig 26: Input Current waveform of Dual Boost Converter Circuit.
Fig 27: Output Voltage waveform of Dual Boost Converter Circuit
ISSN (Print) : 2320 – 3765 ISSN (Online): 2278 – 8875
I
nternational
J
ournal of
A
dvanced
R
esearch in
E
lectrical,
E
lectronics and
I
nstrumentation
E
ngineering
(An ISO 3297: 2007 Certified Organization)
Vol. 5, Issue 12, December 2016
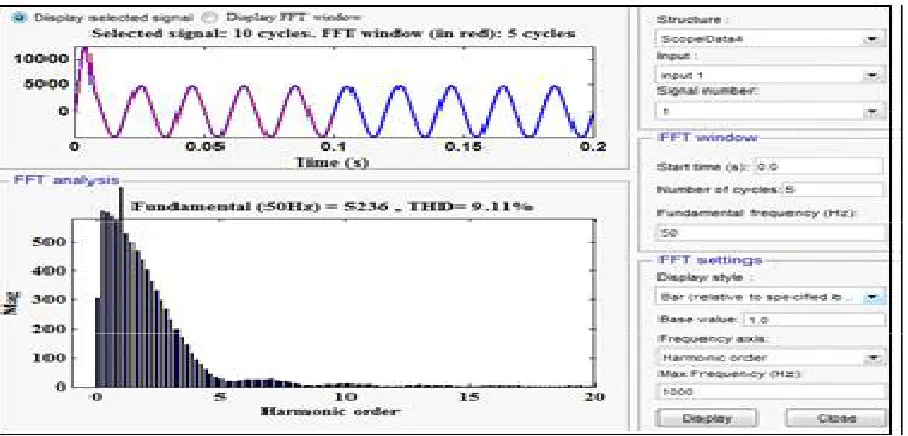
From FFT analysis of input current waveform shown in fig. 29 is from 11.47% to 9.11%of harmonics and the input current is nearly sinusoidal. THD percentage is reduced further by using this model.
Fig 29: FFT Analysis of Dual Boost Converter Circuit
Table: Analysis of PF and THD
S.N Topology Power Factor FFT Analysis Output Voltage
1
Buck Converter based APFC Circuit 0.9083 22.92% 196 V 2
Boost Converter based APFC Circuit 0.989 11.47% 284.5 V 3
Dual Boost Converter based APFC Circuit 0.9926 9.11% 302.7 V
VII. CONCLUSION
The Power Factor Correction with different converters are simulated with MATLAB Simulink. In this paper conventional converter, Buck converter, Boost converter using Current Mode Control and Dual Boost Converter using Current Mode Control are discussed and implemented. The complete performance analysis is done where in FFT analysis and voltage and current output comparison is taken into consideration. It is analyzed that the total harmonic distortion is less in dual boost converter in comparison with boost converter. The power factor of the dual boost converter is way better than the other techniques. This performance can further be improved using the optimization and the artificial techniques in to implementation.
REFERENCES
[1] Hussain S. Athab, IEEE Member, P. K. Shadhu Khan, senior IEEE Member, A Cost Effective Method of Reducing Total Harmonic Distortion (THD) in Single-Phase Boost Rectifier 1-4244-0645-5/07/$20.00©2007 IEEE.
[2] Tiago Kommers Jappe & Samir Ahmad Mussa, Federal University of Santa Catarina, INEP-Power Electronics Institute, lorian´opolis, SC, Brazil, Current control techniques applied in PFC boost converter at instantaneous power interruption - 978-1-4244-4649-0/09/$25.00 ©2009 IEEE. [3] Shikha Singh G.Bhuvaneswari Bhim Singh, Department of Electrical Engineering, Indian Institute of Technology, Delhi
ISSN (Print) : 2320 – 3765 ISSN (Online): 2278 – 8875
I
nternational
J
ournal of
A
dvanced
R
esearch in
E
lectrical,
E
lectronics and
I
nstrumentation
E
ngineering
(An ISO 3297: 2007 Certified Organization)
Vol. 5, Issue 12, December 2016
[5] C. Attaianese, Senior Member, IEEE - V. Nardi, Member, IEEE - F. Parillo - G. Tomasso, Member, IEEE Department of Automation, Electromagnetism, Computer Science and Industrial Mathematics University of Cassino, via G. Di Biasio 43, I-03043 Cassino (FR) – ITALY, Predictive Control Of Parallel Boost Converters – 978-1- 4244-1766-7/08 2008 IEEE.
[6] JFJ van Rensburg, MJ Case and DV Nicolae, Vaal University of Technology, Faculty of Engineering & Technology, P. Bag X021, Vanderbijlpark, 1900, South Africa 2)University of Johannesburg, Power & Control Engineering
Technology, PO Box 17011, Doorfontein 2028, Johannesburg, South Africa, Double-Boost DC to DC Converter - 978-1- 4244-1766-7/08 2008 IEEE.
[7] Yasunobu Suzuki, Toru Teshima Isao Sugawara Akira Takeuchi, Experimental Studies on Active and Passive PFC Circuits, 0-78'03-3996-7/97/ $1 0.0001 997 I EEE.
[8] Paul Nosike Ekemezie, Design Of A Power Factor Correction AC-DC Converter, P. N. Ekemezie is with the Department of Electronic Engineering, University of Swaziland, Private Bag 4, Kwaluseni, M201, Swaziland, 1- 4244-0987-X/07/$25.00 ©2007 IEEE.