Three Area Power System Control System
Design using PSO with PID for Load
Frequency Control
Emad Ali Daood 1, A.K. Bhardwaj 2
Department of Electrical Engineering, SSET, SHIATS, Allahabad, U.P, India1
Professor, Department of Electrical Engineering, SSET, SHIATS, Allahabad, U.P, India 2
ABSTRACT: frequency control of three area Power system using particle swarm optimization (PSO) algorithm. The proposed approach has superior feature, including easy implementation, stable convergence characteristics and very good computational performances efficiency. The main objective is to obtain a stable, robust and controlled system by tuning the PID controller using PSO algorithm. The incurred value is compared with the traditional tuning techniques like Ziegler Nichols and is proved better. The interconnected three area LFC system is modelled and simulated using MATLAB-SIMLINK environment and the PID control parameters are tuned based on PSO algorithm. Hence the results establishes that tuning the PID controller using the PSO technique gives less over shoot, system is less sluggish and reduces the integral Time absolute error( ITAE) Particle Swarm Optimization method finds the best parameters for controller and designed controller is an optimal controller.
The studies power system is subjected to load disturbances to validate the effectiveness of the proposed PSO controller. The simulated results are obtained for different load configurations of the PSO based controller.
KEYWORDS: PSO, Ziegler Nichols, PID controller, ITAE, Load frequency control
I. INTRODUCTION
For large scale power systems which normally consist of interconnected control areas, load frequency control (LFC) is important to keep the system frequency and the inter-area tie power as near to the scheduled values as possible. Because loading of a given power system is never constant and to ensure the quality of power supply, a load frequency controller is needed to maintain the system frequency at the desired nominal value. In a deregulated power system, each control area contains different kinds of uncertainties and various disturbances due to increased complexity, system modeling errors and changing power system structure Therefore, a control strategy is needed that not only maintains constancy of frequency and desired tie-power flow but also achieves zero steady state error and inadvertent interchange. Among the various types of load frequency controllers, the most widely employed is the conventional proportional integral (PI) controller.
However, since the “I” control parameters are usually tuned, it is incapable of obtaining good dynamic performance for various load and system change scenarios. Many studies have been carried out in the past about the load frequency control. In literature, some control strategies have been suggested based on the conventional linear control theory [1]. These controllers may be unsuitable in some operating conditions due to the complexity of the power systems such as nonlinear load characteristics and variable operating points. According to [2], conventional PID control schemes will not reach a high degree of control performances.
Cohen-Coon’s [6], Astrom and Hagglund[7] and many other traditional techniques. Although new methods are proposed for tuning the PID controller, their usage is limited due to complexities arising at the time of implementation. Since, Particle Swarm Optimization algorithm is an optimization method that finds the best parameters for controller in the uncertainty area of controller parameters and obtained controller is an optimal controller, it has been used in almost all sectors of industry and science. One of them is the load frequency control [8]. In this study, it is used to determine the parameters of a PID controller according to the system dynamics
The objective of this study is to investigate the load frequency control and inter area tie-power control problem for a multi-area power system taking into consideration the uncertainties in the parameters of system. An optimal control scheme based particle swarm optimization (PSO) Algorithm method is used for tuning the parameters of this PID controller. The proposed controller is simulated for a three-area power system. To show effectiveness of proposed method and also compare the performance of these three controllers, several changes in demand of first area, demand of second area and demand of three areas simultaneously are applied. Simulation results indicate that PSO controllers guarantee the good performance under various load conditions.
II. OVERVIEW PARTICLE SWARM OPTIMIZATION
PSO is a population-based optimization method first proposed by Eberhart and Colleagues [9, 10]. Some of the attractive features of PSO include the ease of implementation and the fact that no gradient information is required. It can be used to solve a wide array of different optimization problems. Like evolutionary algorithms, PSO technique conducts search using a population of particles, corresponding to individuals. Each particle represents a candidate solution to the problem at hand. In a PSO system, particles change their positions by flying around in a multidimensional search space until computational limitations are exceeded. This new approach features many advantages; it is simple, fast and can be coded in few lines. Also its strong requirement is minimal. Moreover, this approach is advantageous over evolutionary and genetic algorithm in many ways. First, PSO has memory. That is, every particle remembers its best solution (global best). Another advantage of PSO is that the initial population of the PSO is maintained and so there is no need for applying operators to the population, a process that is time-and memory-storage-consuming. In addition, PSO is based on constructive cooperation between particles, in contrast with the genetic algorithms, which are based on the survival of the fittest[ 11-14]
Steps of PSO:Steps of PSO as implemented for optimizationare[11-14]:
Step 1: Initialize an array of particles with random positions and their associated velocities to satisfy the inequality constraints.
Step 2: Check for the satisfaction of the equality constraints and modify the solution if required.
Step 3: Evaluate the fitness function of each particle.
Step 4: Compare the current value of the fitness function with the particles previous best value (pbest). If the current fitness value is less, then assign the current fitness value to pbest and assign the current coordinates (positions) to pbestx.
Step 5: Determine the current global minimum fitness value among the current positions.
Step 6: Compare the current global minimum with the previous global minimum (gbest). If the current global minimum is better than gbest, then assign the current global
minimum to gbest and assign the current coordinates (positions) to gbestx.
Step 7: Change the velocities.
Step 9: Repeat step 2-8 until a stop criterion is satisfied or the maximum number of iterations is reached.
PSO and HPSO algorithm definition: The PSO definition is presented as follows [19,22,26]:
Each individual particle i has the following properties: xi = A current position in search space.
vi = A current velocity in search space.
yi =A personal best position in search space.
The personal best position pi corresponds to the position in search space, where particle i presents the smallest error as determined by the objective function f, assuming a minimization task.
The global best position denoted by g represents the position yielding the lowest error among all the pi’s.
Equation 1 and 2 define how the personal and global best values are updated at time k, respectively. In
below, it is assumed that the swarm consists of s particles. Thus, During each iteration, every particle in the swarm is updated using 4 and 5. Two pseudorandom sequences r1 ~ U(0,1) and r2 ~ U(0,1) are used to affect the stochastic nature of the algorithm.
where vP is the velocity of particle P, C1 and C2 are two positive constants, a is the so-called inertia weight, XP is the position of particle P, XPbest is the best-fitness point reached by P up to time t-1, Xgbest is the best-fitness point found by the whole swarm, rand() is a random value taken from a uniform distribution in the interval [0,1].
Evolutionary operators such as selection, crossover and mutation have been applied into the PSO. By applying selection operation in PSO, the particles with the best performance are copied into the next generation, therefore, PSO can always keep the best performed particles. By applying crossover operation, information can be exchanged or swapped between three particles so that they can fly to the new search area as in evolutionary programming and genetic algorithms. Among the three evolutionary operators, the mutation operators are the most commonly applied evolutionary operators in PSO. The purpose of applying mutation to PSO is to increase the diversity of the population and the ability to have the PSO to escape the local minima[11-14] .
III. MODEL OF THREE –AREA INTERCONNECTED POWER SYSTEM
Basically, Three area power system consists of a governor, a turbine and a generator with feedback of regulation constant. System also includes step load change input to the generator. This work mainly related with the controller unit of a three area power system. Simple block diagram of a three area power system with the controller is shown in Figure 1, where f 1and f 2 are the frequency deviations in area 1 and area 2 respectively in Hz. P d1and P d 2 are the load demand increments. In most of the studies earlier the researchers have used the dynamic model of the power system given by O. I. Elgerd[15].
The area control error (ACE) for the ith area is defined as:
with PID controller, the conventional automatic generation controller has a control equation of the form 9.
Where KPiKIiKd are the gains of the proportional ,integral and derivative controllers for the ith area.
To simplify the analysis, the three interconnected areas were considered identical. The optimal parameter values are such that: KP1 = KP2=K3 = KP and KI1 = KI2=KI3 = KI and Kd1 = Kd2=Kd3 = Kd
The nominal system parameters are given in appendix. The performance index considered in this study is of the form:
Fig.1 Simulation of a three area power system with the controller
Fig.2 PSO PID block diagram of single area network
Table 1: Parameters of the three area power system
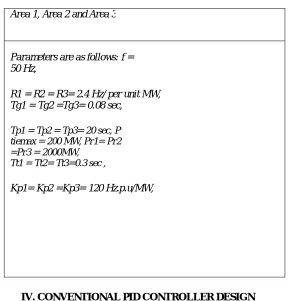
Area 1, Area 2 and Area 3
Parameters are as follows: f = 50 Hz,
R1 = R2 = R3= 2.4 Hz/ per unit MW, Tg1 = Tg2 =Tg3= 0.08 sec,
Tp1 = Tp2 = Tp3= 20 sec, P tiemax = 200 MW, Pr1= Pr2 =Pr3 = 2000MW, Tt1 = Tt2= Tt3=0.3 sec ,
Kp1= Kp2 =Kp3= 120 Hz.p.u/MW,
IV. CONVENTIONAL PID CONTROLLER DESIGN
V. PSO BASED CONTROLLER DESIGN
The PID controller optimized by PSO is designed for LFC and tie-power control. The goals are control of frequency and inter area tie-power with good oscillation damping, also obtaining a good performance In this study, the optimum values of the parameters Kp ,Ki and Kd for PID controller is easily and accurately computed using a PSO. In a typical run of the PSO, an initial population is randomly generated. This initial population is referred to as the 0th generation. Each individual in the initial population has an associated performance index value. Using the performance index information, the PSO then produces a new population. In order to obtain the value of the performance index for each of the individuals in the current population, the system must be simulated. The PSO then produces the next generation of individuals using the reproduction crossover and mutation operators. These processes are repeated until the population is converged and optimum value of parameters found.
VI. RESULTS AND COMPARISION
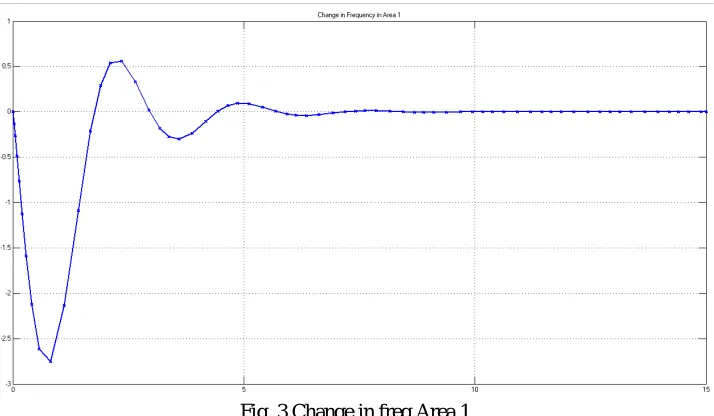
During the simulation study, error signal s Df1,Df2 and tie line power which is required for the controller is transferred to PSO software. All positions of particles on each dimension are clamped in limits which are specified by the user, and the velocities are clamped to the range [vmin., vmax.] given as [15]:a step increase in demand of 0.01 p.u is applied to area 1 The frequency deviation of the first area Df1 and the frequency deviation of the second area Df2 and inter area tie-power signals of the closed-loop system are shown in Fig. 3 ,4 and 5. Similarly a step increase in demand of 0.01 is applied to area2. frequency deviation of the first area Df1 and the frequency deviation of the second area Df2 and inter area tie-power signals of the closed-loop system are shown in Fig. 6-8. Simulation results show performance improvement in time domain specifications for a step load of 0.01 p.u.
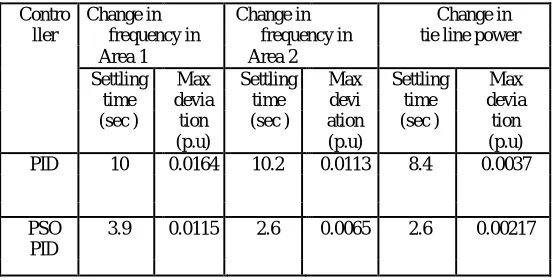
Table 2: Simulink Model performances for conventional PID controller and proposed controller for 1% load at Area 1
Contro Change in Change in Change in
ller frequency in frequency in tie line power
Area 1 Area 2
Settling Max Settling Max Settling Max
time devia time devi time devia
(sec ) tion (sec ) ation (sec ) tion
(p.u) (p.u) (p.u)
PID 10 0.0164 10.2 0.0113 8.4 0.0037
PSO 3.9 0.0115 2.6 0.0065 2.6 0.00217
PID
Table 3: Simulink Model performances for conventional PID controller and proposed PSO controller for 1% load at Area 2
Contr Change in Change in Change in tie line
oller frequency in frequency in power
Area 1 Area 2
Settling Max Settling Max Settling Max
time devi time devia time devia
(sec ) ation (sec ) tion (sec ) tion
(p.u) (p.u) (p.u)
10 0.0113 9.4 0.0164 8.4 0.00378
PID
PSO 3.7 0.0096 3 0.0145 2.3 0.002157
Table 4: Simulink Model performances for conventional PID controller and proposed controller for 1% load at Area 3
Contr Change in Change in Change in tie line
oller frequency in frequency in power
Area 1 Area 2
Settling Max Settling Max Settling Max
time devi time devia time devia
(sec ) ation (sec ) tion (sec ) tion
(p.u) (p.u) (p.u)
PID 10 0.0113 9.4 0.0164 8.4 0.00378
PSO 3.7 0.0096 3 0.0145 2.3 0.002157
PID
Using the PSO approach, global and local solutions could be simultaneously found for better tuning of the controller parameters. The PID value which was obtained by the PSO algorithm is compared with that of the one derived from conventional method in various perspectives, namely robustness and stability. performances. All the simulations were implemented using MATLAB/SIMULINK
A comparison of time domain specifications peak overshoot, peak time, rise time and settling time for a step load of 0.01 p.u at area 1 are tabulated as given in table(2).and It is found very clearly that the PSO based controller drastically reduces the overshoot by a large value. Settling time, Rise Time and Peak Time have also improved. Henceforth outperforms that of the traditionally tuned controller with Zeigler- Nichols criterion.
Similarly for a step change of 0.01 p.u at area2 are tabulated in Table 3. At the simulation, the number of generations is taken 10 and the population size is taken 5. c1 and c2 constants are taken as 0.12 and 1.2
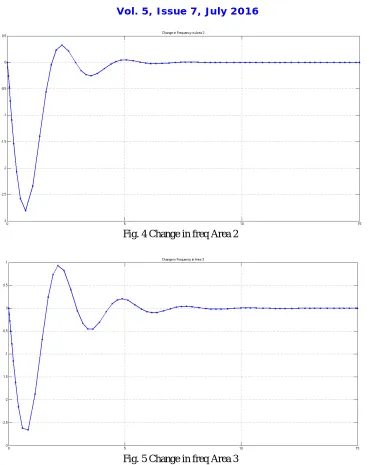
Fig. 4 Change in freq Area 2
Fig. 5 Change in freq Area 3
VII. CONCLUSION
REFERENCES
1. A.Kumar, O.P.Malik, G.S.Hope, Variablestructure-system control applied to AGC of aninterconnected power system, IEE Proceedings,Vol.
132, Pt. C, No. 1,pp. 23-29, January 1985.
2. Unbehauen, H., Keuchel, U., Kocaarslan, I., Real-TimeAdaptive Control of Electrical Power and Enthalpy for a 750 MW Once-Through Boiler,
Proceedings of IEEInternational Control Conference 91, Edinburg, Scotland, Vol.1, pp. 42-47, 25-28 March 1991.
3. Kim Dong Hwa and Park Jin Ill: Intelligent PID Controller Tuning of AVR system using GA and PSO Springer-Verlag Berlin Heidelberg:
ICIC 2005, Part II, LNCS 3645, pp 366-375.(2005).
4. K.J.Astrom, T.Hagglund, The future of PIDcontrol,Control Eng.Pract.9(11)(2001)1163–1175.
5. Ziegler, G. and Nichols, N. B, 1942.Optimum settings for automatic controllers, Trans. ASME, 64,759-768.
6. G.H Cohen and G.A Coon: Theoretical Consideration of Retarded Control , Trans ASME 75,pp.827/834,(1953)
7. Astrom, K J.;.Hagglund .T,1984, Automatic tuning of simple regulators with specifications on phase and amplitude margins, Automatica,
20,645-651.
8. Taher, S.A., Hemati, R., Abdolalipour, A., Tabie, S.H.,Optimal Decentralized Load Frequency Control Using HPSO Algorithms in
Deregulated Power Systems,American Journal of Applied Sciences 5 (9): 1167-1174, 2008.
9. Kennedy, J., Eberhart, R.C., Particles SwarmOptimization, Proc. IEEE International Conference onNeural Networks, Perth Australia, IEEE
Service Center, Piscataway, NJ, IV:1942-1948, 1995.
10. Eberhart, R.C., Kennedy, J., A New Optimizer UsingParticles Swarm Theory, Proc. Sixth InternationalSymposium on Micro Machine and
Human Science, Nagoya-Japan, IEEE Service Center, Piscataway, NJ, 39-43, 1995
11. Al-Awami, A.T. at al., 2007. A particle-swarmbased approach of power system stability enhancement with UPFC. Elec. Power and Energy
Syst., (29): 251-259
12. Miranda, V. and N. Fonseca, 2002. New evolutionaryparticle swarm algorithm (EPSO) applied tovoltage/VAR control. The 14th PSCC Conf.
(PSCC'02-2002), Seville, Spain.
13. .Blackwell, T. and P.J. Bentley, 2002. Don't push meCollision-avoiding swarms. IEEE Cong. On EvolComput, Honolulu, Hawaii, USA
14. Krink, T., J.S. Vesterstrøm and J. Riget, 2002. PSO withspatial particle extension, Proc. of the 4th Congress onEvol. Comput., (CEC-2002).
15. Fosha C.E., Elgerd O.I., The megawatt – frequency control theory, IEEE Trans. Power Appl. Syst. (1970) Vol.89, pp. 563 – 571
16. Chen, J., Ren, Z., Fan, X., Particle Swarm OptimizationWith Adaptive Mutation And Its Application Research In Tuning Of PID Parameter,