Original Article
Association of
EGLN1
and
EGLN3
single-nucleotide
polymorphisms with chronic obstructive pulmonary
disease risk in a Chinese population
Si Fang*, Jinfan Qiu*, Huapeng Yu, Huizhen Fan, Xiping Wu, Zekui Fang, Qixiao Shen, Shuyu Chen
Department of Respiration, Zhujiang Hospital, Southern Medical University, Guangzhou, China. *Equal
contribu-tors.
Received December 11, 2016; Accepted March 31, 2017; Epub July 15, 2017; Published July 30, 2017
Abstract: Hypoxia is implicated in the process of chronic inflammation, which is the characteristic pathogenesis of
COPD (chronic obstructive pulmonary disease). EGLNs (EglN prolyl hydroxylase) that connect oxygen sensing to the activation of HIF-1 (hypoxia inducible factor-1) have been proven to play a role in the development of COPD. The ob-jective of this study was to explore the role of EGLN1 and EGLN3 SNPs (single-nucleotide polymorphisms) in suscep-tibility and development of COPD in a Chinese cohort. Seven SNPs were chosen from two genes (EGLN1 and EGLN3) in 217 cases and 447 controls. The relationship between SNPs and COPD risk was analyzed by using genetic model analysis. Among the seven SNPs, rs11156819 in EGLN3 exhibited a significant association with COPD risk with an
OR of 1.392 (95% CI=1.085-1.787, P=0.009). In the log-additive model, the minor allele T of rs11156819 in EGLN3
significantly increased the risk of COPD (OR=1.58, 95% CI=1.14-2.19, P=0.006) after adjusting for gender, age and smoking status. Furthermore, the haplotypes TC (rs11156819-rs900358) was associated with increased COPD risk (OR=1.49, 95% CI=1.10-2.03, P=0.011). This study suggests that rs11156819 in EGLN3 gene has a significant as -sociation with COPD susceptibility among the Chinese population.
Keywords: EGLN1, EGLN3, single-nucleotide polymorphisms, COPD, case-control study
Introduction
Chronic obstructive pulmonary disease (CO- PD) has been one of the diseases with the high-est morbidity and mortality all over the world, resulting in increasing economic and social bur-den [1]. The pathogenesis character of COPD is the parenchymal tissues destruction and
irre-versible airflow limitation, which is induced by the chronic inflammatory response [2]. With pulmonary function deterioration and the dis-ease progression, the alveolar hypoxia and hypoxemia are increasingly severe. In addition, it seems that tissue hypoxia plays a vital role in progression and comorbidities of COPD, includ-ing cardiovascular disease, lung cancer and pulmonary hypertension [3].
Chronic hypoxemia can stimulate the expres-sions of hypoxia inducible factor-1 (HIF-1) and a family of oxygen-dependent HIF hydroxylat- ing dioxygenases termed EglN prolyl
hydroxy-lase (EGLNs), both of which mediate the main response to hypoxia. HIF-1 is a pivotal player in mobilizing the cellular adaptation to low oxy-gen availability [4]. It consists of two subunits:
HIF-1α and HIF-1β [5]. In normoxia, HIF-1α is
rapidly degraded by hydroxylation pathway [6, 7]. However, theoxygen-dependent
hydroxyl-ation of HIF-1α is mediated by a family of EglN
prolyl hydroxylase (EGLNs). There are three
EGLN family members (EGLN1, EGLN2, EGLN3) in human and mice [8]. Under hypoxia con- ditions, EGLNs lose their activity and fail to
hydroxylate HIF-1α, which leads to HIF-1α
sta-bilization [9, 10]. As a consequence, HIF-1α
speeds up the adaptive changes in cellular metabolism, along with the production of
sev-eral pro-inflammatory factors after hypoxia
[10]. In fact, hypoxia has been proven to
partici-pate in the process of chronic inflammation [11]
and HIF-1 favors the development of
intracel-lular oxygen and the activation of HIF-1α are
supposed to involve in the process of chronic
inflammation and COPD.
Cigarette smoking is the most commonly reco- gnized environmental risk factor for COPD [14]. However, not all smokers develop into COPD despite the similar smoking history. Therefore, there are some potential genetic factors which would contribute to the development and se- verity of COPD [15]. In order to illuminate the pathogenesis of COPD, researchershave con-ducted many candidate genes over the past few decades. Several novel loci at CHRNA3/ CHRNA5/IREB2 [16] and HHIP [17] have been proven to be the risk loci for COPD by GW-
AS; additional loci have also been identified
through larger study at RAB4B, EGLN2, MIA
and CYP2A6 [18]. In addition, increasing stu- dies performed on Chinese people have
con-firmed several susceptible loci associated
with COPD such as HHIP [19], RNF150/EGLN2
[20], CDH13 [21].
Numerous studies have found that some su- sceptible loci in EGLN2 increased the risk of COPD [20, 22]. However, few studies have explored the relationship between EGLN1 and
EGLN3 and the risk of COPD. Therefore, we con-ducted a case-control study to evaluate the association between seven single-nucleotide polymorphisms (SNPs) in EGLN1 and EGLN3
genes and COPD in Chinese population. Materials and methods
Study subjects
In this study, 217 patients from Zhujiang Hospital were enrolled. Inclusion criteria for
participants with COPD were: age ≥40 years,
forced expiratory volume in 1 second (FEV1)/ forced vital capacity (FVC) <0.7. The severity of
COPD was identified with the guidelines of WHO
Global initiative for Chronic Obstructive Lung Disease (GOLD) [1]. Exclusion criteria were bronchial asthma, lung cancer, pulmonary tuberculosis, bronchiectasis and other pulmo-nary diseases. Meanwhile, 447 control sub-jects without established diagnosis of medical illness and COPD family history were randomly enrolled from the health centers of Zhujiang Hospital during the same period. All of the par-ticipants signed informed consent forms at the beginning of the study. This study was approved
by the Ethics Committee of Zhujiang Hospital, Southern Medical University.
SNPs selection and genotyping
Seven tag SNPs (rs2009873, rs11156819, rs1680709, rs1680710, rs1750708, rs176- 9601, rs900358) from EGLN1 and EGLN3, with minor allele frequencies >5% in the Hap- Map Chinese Han Beijing population, were selected in this study. According to the previous studies, 5 ml of peripheral blood were collected from each subject and stored at -80°C [20]. According to the manufacturer’s instructions, genomic DNA was extracted from whole blood
samples using the FlexGene DNA purification
kit (Xibao Biotech Co, Shanghai, china). SNPscanTM (Center for Human Genetics Re-
search, Shanghai Genesky Bio-Tech Co, Ltd) was used to test the loci information of sam-ples. The technical personnel of genotyping were blind to the case or control status of samples.
Statistical analysis
Statistical analyses were conducted in SPSS 20.0 (IBM Corporation, Armonk, NY, USA). Continuous variables were presented as mean ± SD and analyzed by Student’s t-test. Then, categorical variables were analyzed by
χ2 test. Each SNP was tested for deviation
from Hardy-Weinberg equilibrium (HWE) using the x2 test to compare the observed and ex-
pected genotype frequencies among the con- trols.
Furthermore, the association between all SNPs and the risk of COPD under different genetic models (codominant, dominant, reces-sive, over-dominant and log-additive) was cal-culated by SNP stats software [23]. Multivariate logistic regression analysis was used to as- sess the relationship between each SNPs and different group of COPD (mild/moderate and severe/very severe), and confounders (age, gender and smoking status).
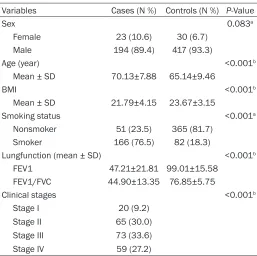
sta-Table 1. Demographic characteristics of patients and control participants
Variables Cases (N %) Controls (N %) P-Value
Sex 0.083a
Female 23 (10.6) 30 (6.7) Male 194 (89.4) 417 (93.3)
Age (year) <0.001b
Mean ± SD 70.13±7.88 65.14±9.46
BMI <0.001b
Mean ± SD 21.79±4.15 23.67±3.15
Smoking status <0.001a
Nonsmoker 51 (23.5) 365 (81.7) Smoker 166 (76.5) 82 (18.3)
Lungfunction (mean ± SD) <0.001b
FEV1 47.21±21.81 99.01±15.58 FEV1/FVC 44.90±13.35 76.85±5.75
Clinical stages <0.001b
Stage I 20 (9.2)
Stage II 65 (30.0) Stage III 73 (33.6) Stage IV 59 (27.2)
Pa: P-values were calculated from two-side chi-square test. Pb: P-values
were calculated by Student t-tests. BMI: body mass index; FEV1: forced expiratory volume in one second; FVC: forcedexpiratory volume.
tistical tests, a two-side significant level of P
less than 0.05 was used. Results
The demographic and baseline characteris- tics of the study are summarized in Table 1. Totally, 664 subjects were enrolled in our study, 217 patients with COPD and 447 control
sam-ples. There was no significant difference in gen -der (P=0.083) between the cases and con- trols. However, age, BMI and smoking status
between the two groups were significantly dif -ferent (P<0.001). Among patients with COPD (23 women and 194 men), most of them are in moderate to severe stage of this disease (63.6% in stage II-III).
Table 2 summarized the loci information and allele frequencies of all selected SNPs in both cases and controls. All seven tested SNPs were in Hardy-Weinberg equilibrium in control group (P>0.1). Furthermore, only rs11156819 on 14- q13.1 was associated with a higher risk of developing the disease (OR of 1.392, 95% CI= 1.085-1.787, P=0.009), while no significant dif -ferences were observed in other six SNPs.
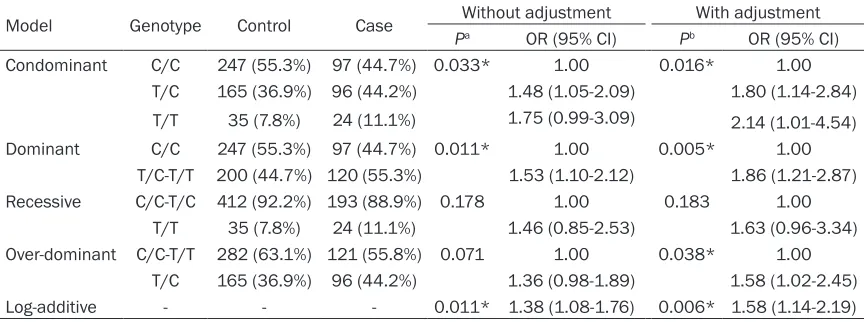
Then the association between se- lected SNPs and the COPD risk was explored by genetic models (con-dominant, (con-dominant, recessive, over- dominant and log-additive). Our re- sults showed that the minor allele T of rs11156819 in EGLN3 (Table 4) was noticeably associated with an increased risk of COPD in the con-dominant (TC vs CC; TT vs CC) before (OR=1.48, 95% CI=1.05-2.09; OR= 1.75, 95% CI=0.99-3.488, P= 0.033, respectively) and after (OR= 1.80, 95% CI=1.14-2.84; OR=2.14, 95% CI=1.01-4.54, P=0.016, res- pectively) adjustment. Simultaneou- sly, in the dominant model (T/C-T/T vs C/C), the T/C-T/T genotype was associated with an increased risk of developing COPD before (OR=1.53, 95% CI=1.10-2.12; OR=1.86, 95% CI=1.21-2.87, P=0.005, respective-ly) correcting for age, gender and smoking status. The genotype “T/C” in the over-dominant model, in- creased COPD risk with an OR of 1.58 (95% CI=1.02-2.45, P=0.038) after adjustment. Additionally, in the
log-addi-tive model, rs11156819 showed a significant
association with the risk of COPD before (OR=1.38, 95% CI=1.08-1.76, P=0.011) and after adjustment (OR=1.58, 95% CI=1.14- 2.19, P=0.006). Compared with EGLN3, there was no evidence that rs2009873 in EGLN1
influenced the risk of COPD using genotype
model both the crude analysis and the analysis for age, gender, and smoking status (Table 3).
As shown in Table 5, the frequencies of 4 SN- Ps between mild/moderate and sever/very sever subgroup were compared to illuminate the association between EGLN1/EGLN3 genes and severity of COPD. However, there were
no significant differences among these SNPs.
Then, we analysed the relationship between 7 SNPs and COPD phenotypes under the assum- ption of a dominant mode of inheritance. Our data demonstrated that none of the SNPs
was significantly associated with lung
fun-ction among cases only or all subjects (Table 6).
[image:3.612.91.348.94.350.2]Table 2. Characteristics of candidate SNPs and their association with the risk of COPD
SNPID Gene name Chromosome MAF (case) MAF (control) P-HWE OR (95% CI) P-value rs2009873 EGLN1 1q42.1 0.475 0.468 0.808 1.029 (0.818-1.295) 0.808 rs11156819 EGLN3 14q13.1 0.332 0.263 0.315 1.392 (1.085-1.787) 0.009*
rs1680709 EGLN3 14q13.1 0.039 0.029 0.527 1.361 (0.730-2.536) 0.330 rs1680710 EGLN3 14q13.1 0.037 0.035 0.558 1.607 (0.577-1.973) 0.836 rs1750708 EGLN3 14q13.1 0.037 0.036 0.603 1.032 (0.560-1.903) 0.919 rs1769601 EGLN3 14q13.1 0.032 0.035 0.558 0.929 (0.489-1.765) 0.822 rs900358 EGLN3 14q13.1 0.247 0.244 0.914 1.015 (0.777-1.324) 0.915 *P<0.05 indicates statistical significance; P-values were calculated from two-side chi-square test; SNP: single-nucleotide
[image:4.612.91.523.249.404.2]poly-morphisms; MAF: minor allele frequency; HWE: Hardy-weinberg equilibrium; OR: odds ratio; 95% CI: 95% confidence interval.
Table 3. Association between rs2009873 genotypes and COPD risk under different genetic models
Model Genotype Control Case Without adjustment With adjustment Pa OR (95% CI) Pb OR (95% CI)
Condominant T/T 128 (28.6%) 61 (28.1%) 0.996 1.00 0.995 1.00 220 (49.2%) 106 (48.8%) 1.01 (0.69-1.48) 0.93 (0.56-1.53) T/C
99 (22.2%) 50 (23.1%) 1.06 (0.67-1.67) 0.95 (0.52-1.74) C/C
Dominant T/T 128 (28.6%) 61 (28.1%) 0.888 1.00 0.776 1.00 T/C-C/C 319 (71.4%) 156 (71.9%) 1.03 (0.72-1.47) 0.93 (0.58-1.49) Recessive T/T-T/C 348 (77.9%) 167 (77.0%) 0.796 1.00 0.999 1.00
C/C 99 (22.1%) 50 (23.0%) 1.05 (0.72-1.55) 1.0 (0.60-1.67) Over-dominant T/T-C/C 227 (50.8%) 111 (51.2%) 0.929 1.00 0.797 1.00
T/C 220 (49.2%) 106 (48.8%) 0.99 (0.71-1.36) 0.95 (0.62-1.45) Log-additive - - - 0.81 1.031 (0.82-1.29) 0.86 0.97 (0.72-1.31)
Pa: P-values were calculated from two-side chi-square test; Pb: P-values were calculated by multivariate logistic regression analysis adjusted for
age, sex and smoking status; COPD: chronic obstructive pulmonary; OR: odds ratio; 95% CI: 95% confidence interval.
Table 4. Association between rs11156819 genotypes and COPD risk under different genetic models
Model Genotype Control Case Without adjustment With adjustment Pa OR (95% CI) Pb OR (95% CI)
Condominant C/C 247 (55.3%) 97 (44.7%) 0.033* 1.00 0.016* 1.00 T/C 165 (36.9%) 96 (44.2%) 1.48 (1.05-2.09) 1.80 (1.14-2.84)
1.75 (0.99-3.09) 24 (11.1%)
35 (7.8%)
T/T 2.14 (1.01-4.54)
Dominant C/C 247 (55.3%) 97 (44.7%) 0.011* 1.00 0.005* 1.00 T/C-T/T 200 (44.7%) 120 (55.3%) 1.53 (1.10-2.12) 1.86 (1.21-2.87) Recessive C/C-T/C 412 (92.2%) 193 (88.9%) 0.178 1.00 0.183 1.00
T/T 35 (7.8%) 24 (11.1%) 1.46 (0.85-2.53) 1.63 (0.96-3.34) Over-dominant C/C-T/T 282 (63.1%) 121 (55.8%) 0.071 1.00 0.038* 1.00
T/C 165 (36.9%) 96 (44.2%) 1.36 (0.98-1.89) 1.58 (1.02-2.45) Log-additive - - - 0.011* 1.38 (1.08-1.76) 0.006* 1.58 (1.14-2.19)
*P<0.05 indicates statistical significance; Pa: P-values were calculated from two-side chi-square test; Pb: P-values were
calculated by multivariate logistic regression analysis adjusted for age, sex and smoking status. COPD: chronic obstructive
pulmonary; OR: odds ratio; 95% CI: 95% confidence interval.
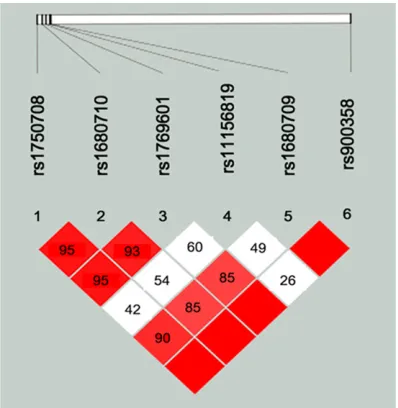
with COPD and control samples. The values of LD between SNPs are shown in Figure 1. Based on LD determinations, rs900853 was in com-plete LD (D’=1) with the other SNPs except
[image:4.612.90.522.461.622.2]multi-Table 5. Genotype frequencies of SNPs and odd ratios in COPD subgroups
SNPID Genotype Mild/moderate (n=85) Severe/very severe (n=132) Pa Pb OR (95% CI)
rs2009873 T/T 18 (21.2%) 43 (32.6%) 0.055 0.095 1
T/C 50 (58.8%) 56 (42.4%) 0.487 (0.239-0.989)
0.812 (0.346-1.904) 33 (25.0%)
17 (20.0%) C/C
rs11156819 C/C 40 (47.1%) 57 (43.2%) 0.149 0.198 1
T/C 32 (37.6%) 64 (48.5%) 1.342 (0.728-2.475)
0.581(0.227-1.487) 11 (8.3%)
13 (15.3%) T/T
rs1680709 A/A 75 (88. 6%) 127 (96.2%) 0.068 0.067 1
A/G 9 (10.2%) 4 (3.0%) 0.250 (0.072-0.866)
0.474 (0.029-7.481) 1 (0.8%)
1 (1.2%) G/G
rs900358 C/C 46 (54.1%) 77 (58.3%) 0.232 0.332 1
C/A 31 (36.5%) 50 (37.9%) 0.992 (0.505-1.683)
0.399 (0.117-1.359) 5 (3.8%)
8 (9.4%) A/A
Pa: P-values were calculated from two-side chi-square test; Pb: P-values were calculated by multivariate logistic regression
[image:5.612.91.524.85.278.2]analysis adjusted for age, sex and smoking status. COPD: chronic obstructive pulmonary; OR: odds ratio; 95% CI: 95% confi -dence interval.
Table 6. Genetic association between SNPs and pulmonary function
SNPID FEV1% predicted FEV1/FVC FEV1% predicted FEV1/FVC
Pa (case only) Pb (case only) Pa (all subjects) Pb (all subjects)
rs2009873 0.269 0.198 0.737 0.066
rs111568119 0.330 0.077 0.797 0.183
rs1680709 0.325 0.441 0.891 0.568
rs1680710 0.325 0.441 0.524 0.662
rs1750708 0.192 0.249 0.640 0.363
rs1769601 0.085 0.063 0.767 0.478
rs900358 0.382 0.951 0.282 0.935
Pa: P-values were calculated by liner regression analysis adjusted for age, sex and smoking status. Pb: P-values were calculated
including all subjects by liner regression analysis adjusted for age, sex, smoking status and COPD case/control status.
Figure 1. Linkage disequilibrium (LD) for the EGLN3 SNPs genotyped in this study. The LD plots were generated by Haploview software 4.2. LD values are shown as r2 and LD block was defined according to
the confidence intervals.
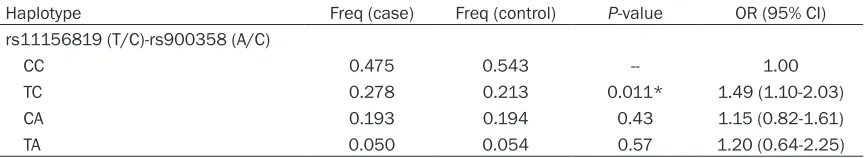
locus genotypes in EGLN3. As shown in Table 7, haplotype TC (rs11156819-rs900853) was associated with an increased risk of COPD (OR=1.49, 95% CI=1.10-2.03, P=0.011). Discussion
[image:5.612.96.520.342.461.2] [image:5.612.90.289.504.708.2]Table 7. EGLN3 haplotype association with COPD susceptibility
Haplotype Freq (case) Freq (control) P-value OR (95% CI)
rs11156819 (T/C)-rs900358 (A/C)
CC 0.475 0.543 -- 1.00
TC 0.278 0.213 0.011* 1.49 (1.10-2.03)
CA 0.193 0.194 0.43 1.15 (0.82-1.61)
TA 0.050 0.054 0.57 1.20 (0.64-2.25)
*P<0.05 indicates statistical significance; P-values were calculated from two-side chi-square test; COPD: chronic obstructive
pulmonary; OR: odds ratio; 95% CI: 95% confidence interval.
yet to be explored. In this case-control stu- dy, we analyzed the association of seven SN- Ps (rs2009873, rs11156819, rs1680109, rs- 1680710, rs1750708, rs1769601, rs900358) in EGLN1 and EGLN3 with COPD risk in Chinese population. The results showed that rs11156819 in EGLN3 was associated with the risk of COPD in the allelic and genetic model. Therefore, it suggested that SNPs of
EGLN3 could play a vital role in the pathogene-sis of COPD.
To be specific, the minor allele T in
rs1115-6819 was associated with a1.392-fold incre-ment in the risk of COPD in allelic model. Under the condominant genetic model, in comparison with the C/C, the T/C or T/T model was related with an increased COPD risk. Furthermore, the similar results were also observed in the do- minant and over-dominant models. In addition to the allelic and genetic approaches, we also performed haplotype analysis. The results indi-cated that the haplotype TC in rs11156819 and rs900358 was associated with a 49% in- crease in COPD risk, while the other haplotypes
showed no significant difference. In general,
the minor allele T in rs11156819 in EGLN3 is a risk factor of COPD. In light of patients with COPD in different severity status in our study, further investigation was carried out to explore the correlation of these SNPs with the seve- rity of COPD (lung function impairments).
Nevertheless, we did not find associations
between the selected SNPs and the severity of COPD before or after adjusting for gender, age and smoking status. At present, some researchers put forward that many COPD-related quantitative traits are more sensitive in detecting the disease status than the con- ventional genetic studies which use binary disease status as primary phenotypes [26]. Therefore, quantitative genetic association an- alysis was performed to deepen the asso- ciation between candidate SNPs and FEV1%
predicted or FEV1/FVC. It appears that none of
these SNPs showed significant association with
COPD-related quantitative traits. These contra-dictory results may be resulted from cross-sec-tional study design of our research, and lung function changing frequently.
The three HIF-prolyl-hydroxylases, termed pro-lyl hydroxylase domains (PHD1, PHD2, and
PHD3), are also known as EGLN2, EGLN1 and
EGLN3, respectively. The study reveals that
EGLN1 is the main oxygen sensor and acts as a leading role in the regulation of HIF activity in hypoxia [27]. In our study, we failed to find
the association between rs2009873 in EGLN1
and the risk of COPD in the allelic model and genetic model. On account of the minor allele frequencies >5%, we chose only one SNP in
EGLN1, which may not provide a comprehen-sive knowledge between them.
However, other study found that EGLN3 is the isoform which plays a major role in regulation of HIF activity under chronic hypoxia [28-31]
with low expression [32]. In order to compen-sate for the reduced activity, EGLN3 strongly upregulates its expression and retains much of its enzymatic activity under hypoxia [33, 34]. Furthermore, EGLN3 showed the multiple fun- ctions with a widest range of other hydroxy lation targets besides HIF [35]. In our study, rs- 11156819, locating in the exon of the EG- LN3 gene, was found to be associated with increased the risk of COPD in the allelic model and genetic model. The haplotype TC increased the risk of COPD by 1.49 fold. Although our
study firstly reports the association between
rs11156819 in EGLN3 and the pathogenesis of COPD, the underlying mechanismis not com-pletely understood and further exploration is needed.
To our knowledge, this is the first study to
EGLN3 genes and COPD. We found the SNPs of EGLN3 associated with the pathogenesis of COPD. Nevertheless, there are some limita-tions in our study. Firstly, the sample size was relatively small. The numbers of participants
were insufficient to evaluate whether rs111-56819 is more significant in smokers via con
-ducting population stratification of smokers.
Secondly, age, BMI and smoking status were not completely matched between cases and controls, which might have an impact on the results. Finally, we did not estimate the rare genetic variation especially in EGLN1, which may be a vital contributor of susceptibility of COPD. In our future study, more patients and candidate genes should be enrolled and explored to further elucidate the genetic patho-genesis of COPD.
Acknowledgements
We acknowledge the all participants for making this work possible.
Disclosure of conflict of interest
None.
Address correspondence to: Huapeng Yu, Depart- ment of Respiration, Zhujiang Hospital of Sou- thern Medical University, NO 253 Middle Industry Avenue, Guangzhou, China. E-mail: [email protected]
References
[1] Vestbo J, Hurd SS, Agustí AG, Jones PW, Vogel-meier C, Anzueto A, Barnes PJ, Fabbri LM, Mar-tinez FJ, Nishimura M, Stockley RA, Sin DD, Rodriguez-Roisin R. Global strategy for the di-agnosis, management, and prevention of chronic obstructive pulmonary disease. Am J Respir Crit Care Med 2013; 187: 347-365. [2] Hogg JC. Pathophysiology of airflow limitation
in chronic obstructive pulmonary disease. Lan-cet 2004; 364: 709-21.
[3] Baz-Dávila R, Espinoza-Jiménez A, Rodríguez-Pérez MDC, Zulueta J, Varo N, Montejo Á, Al-meida-González D, Aguirre-Jaime A, Córdoba-Lanús E, Casanova C. Role of HIF1A, VEGFA and VEGFR2 SNPs in the susceptibility and progression of COPD in a Spanish population. PLoS One 2016; 11: e0154998.
[4] Semenza GL. HIF-1: mediator of physiological and pathophysiological responses to hypoxia. J Appl Physiol (1985) 2000; 88: 1474-80.
[5] Wang GL, Jiang BH, Rue EA, Semenza GL. Hy-poxia-inducible factor 1 is a basic-helix-loop-helix-PAS heterodimer regulated by cellular O2 tension. Proc Natl Acad Sci U S A 1995; 92: 5510-4.
[6] Sutter CH, Laughner E, Semenza GL. Hypoxia-inducible factor 1alpha protein expression is controlled by oxygen-regulated ubiquitination that is disrupted by deletions and missense mutations. Proc Natl Acad Sci U S A 2000; 97: 4748-53.
[7] Huang LE, Gu J, Schau M, Bunn HF. Regulation of hypoxia-inducible factor 1alpha is mediated by an O2-dependent degradation domain via the ubiquitin-proteasome pathway. Proc Natl Acad Sci U S A 1998; 95: 7987-92.
[8] Zheng X, Zhai B, Koivunen P, Shin SJ, Lu G, Liu J, Geisen C, Chakraborty AA, Moslehi JJ, Smal-ley DM, Wei X, Chen X, Chen Z, Beres JM, Zhang J, Tsao JL, Brenner MC, Zhang Y, Fan C, DePinho RA, Paik J, Gygi SP, Kaelin WJ, Zhang Q. Prolyl hydroxylation by EglN2 destabilizes FOXO3a by blocking its interaction with the USP9x deubiquitinase. Genes Dev 2014; 28: 1429-44.
[9] Kaelin WG. Proline hydroxylation and gene ex-pression. Annu Rev Biochem 2005; 74: 115-28.
[10] Kaelin WJ, Ratcliffe PJ. Oxygen sensing by metazoans: the central role of the HIF hydroxy-lase pathway. Mol Cell 2008; 30: 393-402. [11] Taylor CT. Interdependent roles for hypoxia
in-ducible factor and nuclear factor-kappaB in
hypoxic inflammation. J Physiol 2008; 586:
4055-9.
[12] Hellwig-Burgel T, Rutkowski K, Metzen E, Fan-drey J, Jelkmann W. Interleukin-1beta and tu-mor necrosis factor-alpha stimulate DNA bind-ing of hypoxia-inducible factor-1. Blood 1999; 94: 1561-7.
[13] Scharte M, Han X, Bertges DJ, Fink MP, Delude RL. Cytokines induce HIF-1 DNA binding and the expression of HIF-1-dependent genes in cultured rat enterocytes. Am J Physiol Gastroin-test Liver Physiol 2003; 284: G373-84. [14] Hooper R, Burney P, Vollmer WM, McBurnie
MA, Gislason T, Tan WC, Jithoo A, Kocabas A, Welte T, Buist AS. Risk factors for COPD
spiro-metrically defined from the lower limit of nor -mal in the BOLD project. Eur Respir J 2012; 39: 1343-53.
[15] Wan ES, Silverman EK. Genetics of COPD and emphysema. Chest 2009; 136: 859-66. [16] Ober C, Tan Z, Sun Y, Possick JD, Pan L, Nicolae
[17] Pillai SG, Ge D, Zhu G, Kong X, Shianna KV, Need AC, Feng S, Hersh CP, Bakke P, Gulsvik A, Ruppert A, Lodrup CK, Roses A, Anderson W, Rennard SI, Lomas DA, Silverman EK, Gold-stein DB; ICGN Investigators. A genome-wide association study in chronic obstructive
pul-monary disease (COPD): identification of two
major susceptibility loci. PLoS Genet 2009; 5: e1000421.
[18] Cho MH, Castaldi PJ, Wan ES, Siedlinski M, Hersh CP, Demeo DL, Himes BE, Sylvia JS, Klanderman BJ, Ziniti JP, Lange C, Litonjua AA, Sparrow D, Regan EA, Make BJ, Hokanson JE, Murray T, Hetmanski JB, Pillai SG, Kong X, An-derson WH, Tal-Singer R, Lomas DA, Coxson HO, Edwards LD, MacNee W, Vestbo J, Yates JC, Agusti A, Calverley PM, Celli B, Crim C, Ren-nard S, Wouters E, Bakke P, Gulsvik A, Crapo JD, Beaty TH, Silverman EK; ICGN Investiga-tors; ECLIPSE InvestigaInvestiga-tors; COPDGene Investi-gators. A genome-wide association study of
COPD identifies a susceptibility locus on chro -mosome 19q13. Hum Mol Genet 2012; 21: 947-57.
[19] Wang B, Zhou H, Yang J, Xiao J, Liang B, Li D, Zhou H, Zeng Q, Fang C, Rao Z, Yu H, Ou X, Feng Y. Association of HHIP polymorphisms with COPD and COPD-related phenotypes in a Chinese Han population. Gene 2013; 531: 101-5.
[20] Ding Y, Niu H, Yang H, Sun P, Chen Y, Duan M, Xu D, Xu J, Jin T. EGLN2 and RNF150 genetic variants are associated with chronic obstruc-tive pulmonary disease risk in the Chinese population. Int J Chron Obstruct Pulmon Dis 2015; 10: 145-51.
[21] Yuan YM, Zhang JL, Xu SC, Ye RS, Xu D, Zhang Y, Zhang YJ, Chen YL, Liu YL, Su ZG. Genetic variants of CDH13 determine the susceptibility to chronic obstructive pulmonary disease in a Chinese population. Acta Pharmacol Sin 2016; 37: 390-7.
[22] Lamontagne M, Couture C, Postma DS, Timens W, Sin DD, Pare PD, Hogg JC, Nickle D,
Lavio-lette M, Bosse Y. Refining susceptibility loci of
chronic obstructive pulmonary disease with lung eqtls. PLoS One 2013; 8: e70220. [23] Sole X, Guino E, Valls J, Iniesta R, Moreno V.
SNPStats: a web tool for the analysis of asso-ciation studies. Bioinformatics 2006; 22: 1928-9.
[24] Barrett JC, Fry B, Maller J, Daly MJ. Haploview: analysis and visualization of LD and haplotype maps. Bioinformatics 2005; 21: 263-5. [25] Peter J, Barnes DS. Chronic obstructive
pulmo-nary disease. N Engl J Med 2000; 343: 269-280.
[26] An L, Lin Y, Yang T, Hua L. Exploring the interac-tion among EPHX1, GSTP1, SERPINE2, and TGFB1 contributing to the quantitative traits of chronic obstructive pulmonary disease in Chi-nese Han population. Human Genomics 2016; 10: 3.
[27] Berra E, Benizri E, Ginouves A, Volmat V, Roux D, Pouyssegur J. HIF prolyl-hydroxylase 2 is the key oxygen sensor setting low steady-state of HIF-1 in normoxia. EMBO J 2003; 22: 4082-4090.
[28] D’Angelo G, Duplan E, Boyer N, Vigne P, Frelin C. Hypoxia up-regulates prolyl hydroxylase ac-tivity: a feedback mechanism that limits HIF-1 responses during reoxygenation. J Biol Chem 2003; 278: 38183-7.
[29] Del PL, Castellanos MC, Temes E, Martin-Puig S, Cuevas Y, Olmos G, Landazuri MO. The von Hippel Lindau/hypoxia-inducible factor (HIF) pathway regulates the transcription of the HIF-proline hydroxylase genes in response to low oxygen. J Biol Chem 2003; 278: 48690-5. [30] Marxsen JH, Stengel P, Doege K, Heikkinen P,
Jokilehto T, Wagner T, Jelkmann W, Jaakkola P, Metzen E. Hypoxia-inducible factor-1 (HIF-1) promotes its degradation by induction of HIF-alpha-prolyl-4-hydroxylases. Biochem J 2004; 381: 761-7.
[31] Aprelikova O, Chandramouli GV, Wood M, Vas-selli JR, Riss J, Maranchie JK, Linehan WM, Barrett JC. Regulation of HIF prolyl hydroxylas-es by hypoxia-inducible factors. J Cell Biochem 2004; 92: 491-501.
[32] Appelhoff RJ, Tian YM, Raval RR, Turley H, Har-ris AL, Pugh CW, Ratcliffe PJ, Gleadle JM. Dif-ferential function of the prolyl hydroxylases PHD1, PHD2, and PHD3 in the regulation of hypoxia-inducible factor. J Biol Chem 2004; 279: 38458-65.
[33] Ginouves A, Ilc K, Macias N, Pouyssegur J, Ber-ra E. PHDs oveBer-ractivation during chronic hy-poxia “desensitizes” HIFalpha and protects cells from necrosis. Proc Natl Acad Sci U S A 2008; 105: 4745-50.
[34] Stiehl DP, Wirthner R, Koditz J, Spielmann P, Camenisch G, Wenger RH. Increased prolyl 4-hydroxylase domain proteins compensate for decreased oxygen levels. Evidence for an auto-regulatory oxygen-sensing system. J Biol Chem 2006; 281: 23482-91.