ABSTRACT
ANDREWS KINGON, GENNA LEIGH. Development and Integration of Analytical Strategies for Deep Proteome Coverage and Quantification in Model Systems. (Under the direction of Dr. David Charles Muddiman).
Integrated liquid chromatography tandem mass spectrometry (LC-MS/MS)-based workflows are crucial to streamline method development in proteomic research, and to ultimately increase the amount of information (qualitative and quantitative) to address biological questions through proteomics. Furthermore, it is essential to contribute to the fundamentals, as well as be open to recognize there are far more variables, which most certainly interact, within the integrated strategy. We must consider new technologies and methods as they are introduced and are rapidly evolving on all fronts. Herein, this dissertation describes enhancements to modern LC-MS/MS proteomic measurements for characterizing and profiling protein expression (relatively and absolutely) in model systems through global and targeted approaches.
configuration was employed for the research described herein with the exception of the final study as new technology became available.
Thermophile proteomics offers a glimpse into microbial ecology in high temperature environments, presumably harboring technologically important enzymes and other thermostable biomolecules. A two part global exploration of the intra- and extracellular proteome of model bacterial systems, Caldicellulsiruptor saccharolyticus and Thermotoga maritima, characterize individual and microbial communities employing label-free spectral counting for relative quantification. Efficient sample preparation of the extracellular proteome is described to achieve a better in-depth analysis. Additionally, modification of growth conditions offers a preview of the intricate microbial behavior and interactions through analysis of proteome expression with different environmental stimuli.
coverage employing the TripleTOF; however, each platform afforded uniquely identified proteins ensuing a complementary nature overall.
The development of a targeted multiplexed assay for absolute quantification of proteins in the chicken ovarian cancer model was achieved employing protein cleavage isotope dilution MS to decipher protein fluctuation as a function of health status. A previous investigation of the longitudinal plasma samples revealed increased abundance of a predicted form of ovomacroglobulin in the diseased bird. This biomarker discovery based initiative prompted targeted MS strategies to absolutely quantify this protein and others of interest emphasizing and discussing detection of true biological change between healthy and diseased birds.
Development and Integration of Analytical Strategies for Deep Proteome Coverage and Quantification in Model Systems
by
Genna Leigh Andrews Kingon
A dissertation submitted to the Graduate Faculty of North Carolina State University
in partial fulfillment of the requirements for the degree of
Doctor of Philosophy
Chemistry
Raleigh, North Carolina 2012
APPROVED BY:
_______________________________ ______________________________ David C. Muddiman Alexander Deiters
Professor, Chemistry Professor, Chemistry Committee Chair
_______________________________ ________________________________ Morteza G. Khaledi Robert M. Kelly
ii
DEDICATION
iii BIOGRAPHY
iv
ACKNOWLEDGMENTS
I would like to acknowledge all those who have been instrumental in my trek through graduate school. While I am unable to name each individual, I recognize I would have not made it here alone, and without their persistent encouragement and support I would not have grown into the confident research scientist I hope that I am today.
I would sincerely like to express my gratitude to my research advisor, Dr. David C. Muddiman, his drive, compassion, motivation, and excitement for superior science is extraordinary and has guided me through my struggles and successes. Though he has never taken me up on pedaling around on the road bike, I realize my lack of familiarity with the band RUSH may have persuaded him otherwise.
The second individual I would like to personal acknowledge is Dr. Adam M. Hawkridge. He has also advocated and steered me to do my best through struggles and successes. Countless scientific conversations and evaluations of careful experimental designs have been extremely valuable for how I contemplate scientific problems.
v
vi
TABLE OF CONTENTS
LIST OF TABLES ... xii
LIST OF FIGURES ... xiv
LIST OF PUBLICATIONS ... xvii
CHAPTER 1 An Introduction to Quantitative Proteome Measurements by Liquid Chromatography Tandem Mass Spectrometry ... 1
1.1 Proteomics and Biological Mass Spectrometry ... 1
1.2 Separation Science ... 4
1.2.1 Liquid Chromatography ... 4
1.2.2 One-Dimensional Gel Electrophoresis ... 11
1.3 Electrospray Ionization ... 12
1.4 Mass Spectrometry ... 15
1.4.1 Fourier Transform Mass Spectrometry Principles and Related Hybrid Platforms ... 16
1.4.2 Time-of-Flight Mass Spectrometry Principles and Related Hybrid Platforms ... 21
1.4.3 Triple Quadrupole Mass Spectrometry Principles ... 23
1.5 Mass Spectrometry Based Quantification for Proteomic Analysis ... 26
1.5.1 Label-free Spectral Counting for Relative Protein Quantification ... 26
1.5.2 PC-IDMS for Absolute Protein Quantification ... 30
vii
1.7 References ... 36
CHAPTER 2 Coupling of a Vented Column with Splitless nanoRPLC-ESI-MS for Improved Separation of Brain Natriuretic Peptide-32 and its Proteolytic Peptides ... 50
2.1 Introduction ... 50
2.2 Experimental ... 53
2.2.1 Materials ... 53
2.2.2 Column Packing ... 54
2.2.3 Column Configurations ... 55
2.2.4 Sample Preparation... 58
2.2.5 Online nanoLC-MS ... 58
2.2.6 Data Analysis ... 60
2.3 Results and Discussion ... 60
2.3.1 Optimization of BNP-32 Separations ... 60
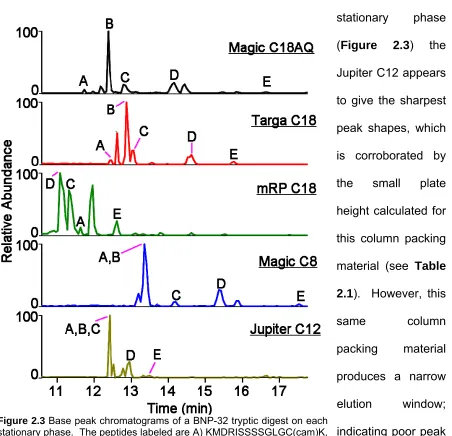
2.3.2 Determining Optimal Stationary Phases ... 62
2.3.3 Evaluation of a Vented Column Configuration ... 65
2.4 Conclusions ... 69
2.5 References ... 70
CHAPTER 3 Part I: Characterization of the Extracellular Proteome of the Extreme Thermophile Caldicellulosiruptor saccharolyticus by GeLC-MS2 ... 74
3.1 Introduction ... 74
viii
3.2.1 Thermophilic Bacterial Growth and Secretome Concentration ... 78
3.2.2 Protein Purification Techniques ... 79
3.2.3 GeLC-MS2 ... 82
3.2.4 Data Analysis ... 85
3.3 Results and Discussion ... 88
3.3.1 Evaluation of Protein Purification Techniques and Order of Operation Investigations ... 88
3.3.2 Protein Identification Attributed to Sample Preparation ... 92
3.3.3 Biological Importance and Evidence for Secretion ... 97
3.4 Conclusions ... 100
3.5 References ... 102
CHAPTER 4 Part II: Defining and Quantifying Individual and Co-cultured Intracellular Proteomes of Two Thermophilic Microorganisms by GeLC-MS2 and Spectral Counting ... 108
4.1 Introduction ... 108
4.2 Experimental ... 114
4.2.1 Thermophilic Bacterial Growth and Cell Lysis ... 114
4.2.2 GeLC-MS2 ... 115
4.2.3 Data Analysis ... 118
4.3 Results and Discussion ... 120
ix
4.3.2 Co-culture Media Weaknesses ... 132
4.3.3 Comparison of C. saccharolyticus Intracellular Proteome in Pure and Co-culture ... 134
4.3.4 C. saccharolyticus Extracellular and Intracellular Proteome Evaluation ... 135
4.4 Conclusions ... 139
4.5 References ... 142
CHAPTER 5 Improving Proteome Coverage on a LTQ-Orbitrap Using Design of Experiments ... 147
5.1 Introduction ... 147
5.2 Experimental ... 151
5.2.1 Saccharomyces cerevisiae Sample Preparation ... 151
5.2.2 NanoLC-LTQ-Orbitrap MS/MS Analysis ... 153
5.2.3 Data Analysis ... 154
5.3 Results and Discussion ... 157
5.3.1 Previous S. cerevisiae LTQ-Orbitrap MS/MS Analysis ... 157
5.3.2 DOE 1 ... 160
5.3.3 DOE 2 ... 168
5.4 Conclusions ... 173
x
CHAPTER 6 Performance Characteristics of a New Hybrid Triple Quadrupole Time-of-Flight Tandem Mass Spectrometer and Comparison to a
LTQ-Orbitrap ... 179
6.1 Introduction ... 179
6.2 Experimental ... 183
6.2.1 Saccharomyces cerevisiae Protein Preparation ... 183
6.2.2 nLC Platform ... 184
6.2.3 LTQ-Orbitrap MS ... 185
6.2.4 TripleTOF™ 5600 System ... 186
6.2.5 Data Analysis ... 186
6.3 Results and Discussion ... 188
6.4 Conclusions ... 201
6.5 References ... 203
CHAPTER 7 Multi-peptide nLC-PC-IDMS-SRM-based Assay for the Quantification of a Novel Form of Ovomacroglobulin in the Chicken Ovarian Cancer Model ... 206
7.1 Introduction ... 206
7.2 Experimental ... 209
7.2.1 Materials ... 209
7.2.2 Peptide Selection and Synthesis ... 209
7.2.3 Plasma and Tissue Sample Preparation ... 210
xi
7.3 Results and Discussion ... 214
7.3.1 Vitellogenin-1 ... 215
7.3.2 Transthyretin ... 216
7.3.3 Predicted Ovomacroglobulin ... 220
7.4 Conclusions ... 226
xii
LIST OF TABLES
Table 1.1 Table 2.1 Table 3.1 Table 3.2 Table 3.3 Table 3.4 Table 3.5 Table 3.6 Table 4.1 Table 4.2 Table 4.3 Table 5.1 Table 5.2 Table 5.3 Table 5.4 Table 5.5 Table 5.6 Table 5.7 Table 5.8 Table 5.9
Numbers of Peptides Mapping to Transitions ... 24
Average Plate Heights ... 65
Contaminant Proteins for Reverse Database ... 86
Composition of DSMZ 640 Media ... 88
Identified Proteins by Purification Method ... 94
Comparison of Spectral Counts ... 96
Proteins Predicted for Secretion ... 98
Proteins with Signal Peptide or Transmembrane Domains ... 99
Unique Proteins with ≥4 Spectral Counts ... 126
Summary of Protein Numbers for Each Culture ... 132
Proteins Identified in the Intra- and Extracellular Proteome ... 137
LTQ-Orbitrap Instrument Parameters for DOE ... 155
LTQ-Orbitrap Instrument Parameters Comparison ... 156
DOE 1 Screening Design Table ... 158
DOE 2 Screening Design Table ... 159
Six Factors for DOE 1 ... 161
Factor and Response Values for DOE 1 Best Method ... 165
Factor and Response Values for DOE 1 Worst Method ... 169
Three Factors for DOE 2 ... 170
xiii Table 6.1
Table 6.2 Table 6.3 Table 7.1
Top Modifications Considered in Search ... 188
Summary of Instrument Features and Results ... 192
Mass Error Summary ... 195
xiv
LIST OF FIGURES
Figure 1.1 Figure 1.2 Figure 1.3 Figure 1.4 Figure 1.5 Figure 1.6 Figure 1.7 Figure 1.8 Figure 1.9 Figure 1.10 Figure 1.11 Figure 1.12 Figure 1.13 Figure 2.1 Figure 2.2 Figure 2.3 Figure 2.4 Figure 2.5 Figure 3.1 Figure 3.2
Model Workflow for Modern MS-based Proteomics ... 3
Theoretical van Deemter Plot ... 6
Simplistic Flow Splitting Schematic ... 7
Representative nanoLC Pressure Profile ... 8
Electrospray Ionization Mechanism ... 13
Sequence of Events for FT-based MS ... 17
Image Current Detection by FTMS ... 18
Simplistic Representation of QqTOF ... 22
SRM and SIM Modes by QqQ ... 24
Extracted Ion Chromatograms Comparing SIM to SRM ... 25
Label-free Spectral Counting for Relative Quantification... 28
PC-IDMS-SRM for Absolute Quantification ... 31
Proteomic Workflow and Highlights of Dissertation ... 34
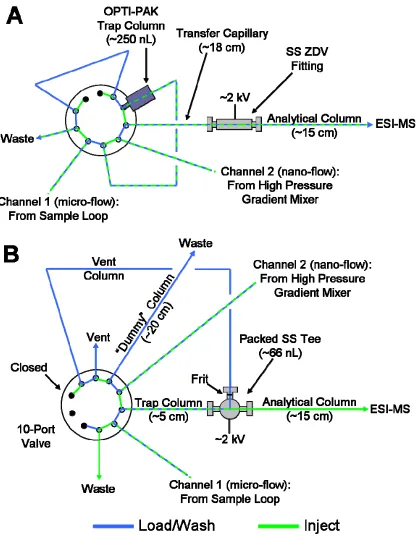
Valve Configuration Schematics ... 56
BNP-32 Structure, Mass Spectrum, and XIC ... 63
Base Peak Chromatograms for Each Stationary Phase ... 64
Base Peak Chromatograms for Each Configuration ... 66
Notched Box Plots of Chromatographic Efficiencies ... 67
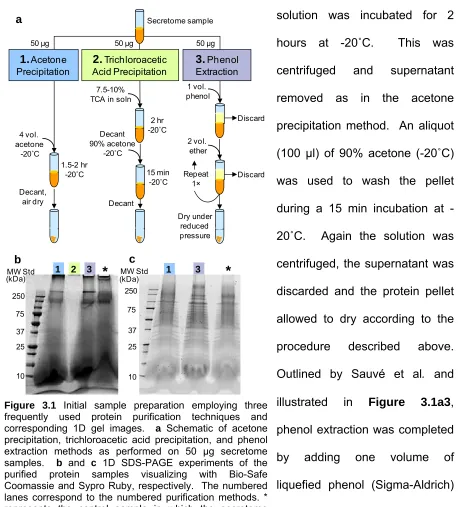
Workflow of Initial Sample Preparation ... 80
xv Figure 3.3
Figure 3.4 Figure 4.1 Figure 4.2 Figure 4.3 Figure 4.4 Figure 4.5 Figure 5.1 Figure 5.2 Figure 5.3 Figure 5.4 Figure 5.5 Figure 5.6 Figure 6.1 Figure 6.2 Figure 6.3 Figure 6.4 Figure 6.5 Figure 6.6 Figure 6.7 Figure 6.8 Figure 6.9
Gel Image of Order of Operation Investigation ... 92
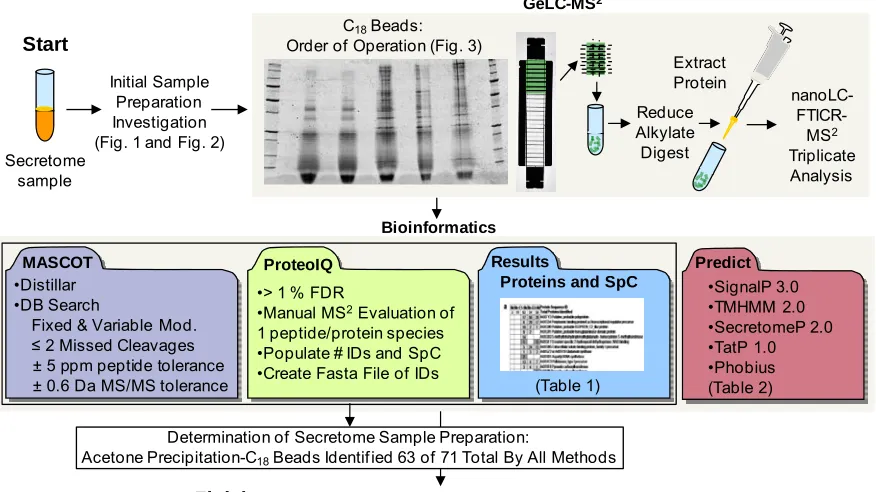
Experimental Workflow Including Prediction Servers ... 93
Gel Image of Thermophilic Intracellular Proteome ... 120
Venn Diagrams Comparing Proteins in Each Culture ... 121
Plots of Normalized Spectral Counts for Each Culture ... 123
Bar Graphs of Greater than Two-fold Change in Expression ... 124
Venn Diagrams Summarizing C. saccharolyticus Proteins ... 136
Mass Accuracy as a Function of Instrument Method ... 150
Experimental Workflow Investigating Parameters ... 152
Half Normal Quantile Plots for DOE 1 ... 163
Peptide Discriminant Value Distributions for Best Method ... 167
Peptide Discriminant Value Distributions for Worst Method ... 168
Half Normal Quantile Plots for DOE 2 ... 171
Experimental Workflow for NCSU and AB SCIEX ... 187
Sequence of Events for Orbitrap and TripleTOF ... 189
Box Plots of Time for Each Orbitrap Event ... 190
Venn Diagrams Comparing Proteins Identified ... 193
Data Acquisition Output for Selected Peptide ... 196
Assessing Acquisition Redundancy ... 197
Assessing Dynamic Range of Mass and m/z ... 197
Venn Diagrams Comparing Two LC Configurations ... 198
xvi Figure 6.10
Figure 7.1 Figure 7.2 Figure 7.3 Figure 7.4 Figure 7.5 Figure 7.6 Figure 7.7
Influence of MS2 Tolerance Window ... 200
Global, Discovery and Targeted, Validation Workflow ... 214
Quantification of Vitellogenin-1 ... 216
Quantification of Transthyretin ... 218
Quantification of Predicted Ovomacroglobulin ... 222
Concentration of Predicted Ovomacroglobulin Time Point 5 ... 223
Representative Raw Data of Transitions ... 224
xvii
LIST OF PUBLICATIONS
Peer reviewed manuscripts:
1. Andrews Kingon, G.L.; Petitte, J.N.; Muddiman, D.C.; Hawkridge, A.M., Multi-peptide nLC-PC-IDMS-SRM-based Assay for the Quantification of a Novel Form of Ovomacroglobulin in the Chicken Ovarian Cancer Model. 2012, submitted.
2. Andrews, G. L.; Simons, B. L.; Young, J. B.; Hawkridge, A. M.; Muddiman, D. C. Performance Characteristics of a New Hybrid Quadrupole Time-of-Flight Tandem Mass Spectrometer (TripleTOF 5600). Anal. Chem., 2011, 83, 5442-5446.
3. Andrews, G. L.; Dean, R. A.; Hawkridge, A. M.; Muddiman, D. C. Improving Proteome Coverage on a LTQ-Orbitrap Using Design of Experiments. J. Am. Soc. Mass Spectrom., 2011, 22, 773-783.
4. Gokce, E.; Andrews, G. L.; Dean, R. A.; Muddiman, D. C. Increasing proteome coverage with offline RP HPLC coupled to online RP nanoLC-MS. J. Chromatogr. B. 2011, 879, 610-614.
5. Andrews, G.; Lewis, D.; Notey, J.; Kelly, R.; Muddiman, D. Part II: defining and quantifying individual and co-cultured intracellular proteomes of two thermophilic microorganisms by GeLC-MS2 and spectral counting. Anal. Bioanal. Chem. 2010, 398, 391-404.
6. Andrews, G.; Lewis, D.; Notey, J.; Kelly, R.; Muddiman, D. Part I: characterization of the extracellular proteome of the extreme thermophile Caldicellulosiruptor saccharolyticus by GeLC-MS2. Anal. Bioanal. Chem. 2010, 398, 377-389.
xviii
Abstracts for presentation:
1. Poster - Measurement of the Intra- and Inter-individual Biological Variability of Chicken Plasma Proteins by Multiple Reaction Monitoring. The 59th American Society for Mass Spectrometry Conference, Denver, CO, June 2011. G.L. Andrews, J.N. Petitte, D.C. Muddiman, and A.M. Hawkridge.
2. Poster - Assessment of the Complementarity of LC-MS/MS Instruments on Proteome Coverage and Quantitative Accuracy Using Design of Experiments. The 59th American Society for Mass Spectrometry Conference, Denver, CO, June 2011. G.L. Andrews, B.L. Simons, J.B. Young, A.M. Hawkridge, and D.C. Muddiman.
3. Poster - DOE Assisted Improvement of Proteome Coverage and LC-MS/MS Instrument Platform Evaluation. The 7th Annual US Human Proteome Organization Conference, Raleigh, NC, March 2011. G.L. Andrews, B.L. Simons, J.B. Young, A.M. Hawkridge, and D.C. Muddiman.
4. Poster - Maximizing Proteome Coverage on a LTQ-Orbitrap MS Using Design of Experiments. The Annual Federation of Analytical Chemistry and Spectroscopy Society Conference, Raleigh, NC, October 2010. G.L. Andrews, R.A. Dean, A.M. Hawkridge, and D.C. Muddiman.
MEINHARD Student Poster Award Winner
5. Poster - Defining and Quantifying Individual and Co-cultured Intracellular Proteomes of Two Thermophilic Microorganisms by GeLC-MS2 and Spectral Counting. The 58th American Society for Mass Spectrometry Conference, Salt Lake City, UT, June 2010. G.L. Andrews, D.L. Lewis, J.S. Notey, R.M. Kelly, and D.C. Muddiman.
6. Oral - Defining and Relatively Quantifying the Dirty Little Secretome and Intracellular Proteome of Thermophilic Microorganisms by GeLC-MS2. NCSU Analytical Division Seminar, Raleigh, NC, March 2010. G.L. Andrews, D.L. Lewis, J.S. Notey, R.M. Kelly, and D.C. Muddiman.
xix
8. Poster - Investigating the Secretome of Individual and Co-cultured Thermophiles for Small putative Proteins of Enzymatic Potential. The 57th Annual American Society for Mass Spectrometry Conference, Philadelphia, PA, June 2009. G.L. Andrews, D.L. Lewis, S.E. Blumer-Schuette, J.S. Notey, R.M. Kelly, T.S. Collier, and D.C. Muddiman.
9. Poster - Exploring the Enzymatic Potential of Small Putative Proteins in the Secretome of Individual and Co-culture Thermophiles. NCSU Chemistry Department Symposium, Raleigh, NC, March 2009. G.L. Andrews, D.L. Lewis, S.E. Blumer-Schuette, J.S. Notey, R.M. Kelly, T.S. Collier, and D.C. Muddiman.
1 CHAPTER 1
An Introduction to Quantitative Proteome Measurements by Liquid Chromatography Tandem Mass Spectrometry
1.1 Proteomics and Biological Mass Spectrometry
Proteomics strives to carefully and precisely identify, characterize, and quantify proteins, protein isoforms, post-translational modifications (PTMs), and interactions between proteins localized within a particular compartment (e.g.,
pathway, organ, organelle), as well as detect and measure how the proteins may change as a function of stimuli (i.e., spatial, temporal, and physiological variations).1 Proteome measurements are remarkably more valuable than static genome measurements in providing information about dynamic biological function and processes.2 For example, one of the first cancer biomarkers was realized in 1848 by physician and scientist H. Bence Jones, the presence of this protein is used to aid in detecting multiple myeloma.3-6 Currently, proteomic efforts persist in developing and precisely characterizing biomarkers for use as diagnostic and prognostic markers.
2
demonstrated to extend over 12 orders of magnitude.10, 11 Roughly half of the protein mass in human plasma is attributed to albumin, and the top 12 most abundant proteins construct nearly 95% of plasma protein by mass.11 The other potentially millions of proteins are in lower abundance and usually of more interest and greater biological importance. The number of possible species and the abundance of these species cause great challenges in defining proteome measurements, thus demanding well-defined approaches, carefully integrated methods, and advanced technologies (e.g., sample processing, fractionation, and instrument platform design) as essential elements.
3
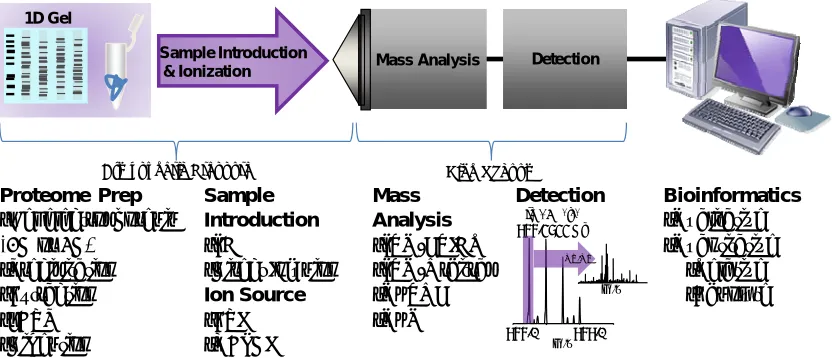
Figure 1.1 A model workflow for modern MS-based proteomics investigations. Protein samples are
processed and ultimately digested into peptides. Frequently, introduction of the peptide solution via a LC platform is directed towards the MS inlet in which gas-phase ions are generated by electrospray ionization and interrogated by a hybrid MS platform affording accurate precursor mass and sequencing information. Raw data is processed through a bioinformatic platform to profile the proteomic sample. The examples for each category are not inclusive.
conditions for electrospray ionization (ESI) which volatizes and ionizes proteome samples for MS analysis. Employing different instrument platforms and detection modes expands the depth of proteome coverage and affords quantification strategies in both global and targeted analysis.16 These technologies combined with the proper bioinformatics platform for thorough data analysis offer a foundation for developing proteome investigations in complex systems ranging from identifying the proteins in biological pathways to biomarker discovery and validation.
Mass Analysis •LTQ-FTICR •LTQ-Orbitrap •QqTOF •QqQ
Detection Bioinformatics •Qualitative •Quantitative
•Relative •Absolute
Sample Introduction & Ionization
Atmospheric Pressure High Vacuum
Sample Introduction •LC
•Direct Infusion Ion Source •ESI •MALDI
Mass Analysis Detection
[M+2H+]2+ 977.4844 Da
977.0 979.0 m/z
m/z
Proteome Prep •Gel electrophoresis (1D or 2D)
•Precipitation •Extraction •FASP •Digestion
1D Gel
4 1.2 Separation Science
1.2.1 Liquid Chromatography
Complex protein samples are reality for proteomic investigations in biological systems. To reduce this sample complexity, a variety of fractionation and separation techniques are available prior to MS analysis (e.g., on- and off-line LC, one- and two-dimensional gel electrophoresis, and isoelectric focusing). Most commonly, the coupling of LC facilitates investigation by decreasing sample complexity as analyte partitions between stationary and mobile phases allowing for temporal separation. LC system miniaturization in a splitless format affords several advantages over other systems such as splitflow and high-flow systems.
To evaluate the chromatographic performance as a result of miniaturization, for example, plate height (H), also termed height equivalent to a theoretical plate (HETP), is an important system characteristic. The quantity is calculated by the following expression with minimal H describing an ideal system.
Equation 1.1
L is the length of the column, N is the number of theoretical plates which is a measurement of the chromatographic efficiency, Wi is the width of chromatographic peak i, and tRi is the retention time of peak i. Plate height can also be expressed by the sum of the major band broadening effects, or hindrances in separation resulting in dilution of analyte, in the following equation:
5
where eddy diffusion (HED), longitudinal diffusion (HLD), and resistance to mass transfer (HRMT) are summed.17 Eddy diffusion, also multipath flow, is caused by non-uniform flow velocity from heterogeneous packing of the stationary phase. Longitudinal diffusion occurs when molecules randomly diffuse in all directions along the column, though in the context of LC, HLD contributes little to band broadening. Mass transfer effects are attributable to the rates at which analyte is absorbed and desorbed. Non-equilibrium mass transfer, such as slow kinetics of analyte transfer between the mobile and stationary phases, and stagnant mobile phase mass transfer effect impart band broadening.
As a function of the mobile phase linear velocity (u), Eq. 1.2 can be expressed as the van Deemter equation:
Equation 1.3
6
reduction of column inner diameter and bed volume improve chromatographic performance offering increased separation efficiencies.23-25 The A term in Eq. 1.3 decreases and several likely effects describe this behavior. Less stationary phase is required for smaller bore columns, and therefore, there is less opportunity for irregularities in packing (i.e., better homogeneously packed columns offer a relatively constant packing density). A difference in packing density, or the “wall effect”, causes different mobile phase velocities to occur and dispersion as analyte spends different amounts of time in differently packed regions of the stationary phase.26 Also, decreased A may be attributable to analyte more efficiently sampling or radially diffusing through the cross section of the packed column. This, results in less time required for the interaction and less time for eddy diffusion to occur. The other two terms in Eq. 1.3 are much less changed by chromatographic miniaturization. C
weakly contributes to the minimal H, and it is suggested that packing density is reduced in smaller bore columns due to less particles fitting in the column, and the distance between particles may increase and cause resistance to mass transfer in the mobile phase.25
van Deemter Plot Mass Transfer (Cµ) Eddy Diffusion (A)
Longitudinal Diffusion (B/µ)
u (mm/s)
HET
P
(
m
m
)
0 0
Optimal Velocity Min. H
Figure 1.2 Theoretical van Deemter plot. The major
7
The increased chromatographic performance due to a decreased column inner diameter requires decreased flow-rates (i.e., 300-500 nL/min), and thus, a reduced flow volume. These flow-rates have advantage in generation of smaller ESI droplets, and accordingly a higher surface area to volume ratio affording high ionization efficiency and less ion suppression (ESI mechanism described vide infra). Analyte species situated at the droplet surface are more readily desorbed during travel to the orifice of the MS and facilitate greater ionization efficiency.27 Furthermore, reduced flow rates afford reduced solvent and sample consumption.
Historically, flow splitting was required to achieve nanoliter/minute flow-rates and was controlled by crudely monitoring the backpressure on the system (see Figure 1.3). Lacking direct control of
flow-rates, interferences (e.g., carryover, degraded stationary phase) within the analytical column will cause variation in retention time reproducibility. Consider the following equation:
Equation 1.4
in which Ftotal is the total measured flow-rate of the system, FA is the flow-rate which is subjected to the splitter, and FB is the flow-rate that traverses the chromatographic column interacting with analyte for separation. In the scenario vide supra, interferences in the analytical column increase the backpressure resulting in a lower
FB, and then FA inherently increases since FTotal remains unchanged in Eq. 1.4. FB
FTotal FA
Flow Splitter (Backpressure monitored)
Column Flow
Pump
Figure 1.3 A simplistic schematic of flow
8
Lower and inconsistent FB over a large-scale study leads to systematic error in retention times, and therefore, hindering use of retention time for additional assessment of analyte identity. The variation in retention time reproducibility using a splitflow platform is demonstrated in an investigation of replicate injections of the ≤10 kDa fraction of nine pooled serum samples from stage III and IV diagnosed ovarian cancer patients on a nanoLC-dual ESI Fourier transform ion cyclotron reasonance (FTICR) MS with splitflow.28 The 95% confidence interval of the mean (CIM95%) retention time of 497 species present in at least four of the five replicates ranged ±0.22 to ±1.46 minutes using approximately a 60 minute gradient.28
Upon advancing LC separations, splitless flow is directly measured by flow meters on each mobile phase attributing to consistent peak shape and reproducible retention time and sample separation. Figure 1.4 is a representative LC pressure
Figure 1.4 Representative nanoLC pressure profile trace over a 135 minute LC-MS/MS run. Flow
meters at each mobile phase monitor the flow and relay signal to a pressure controller. Qa and Qb represent the flow rate of mobile phase A and B, respectively, and QTotal is the sum. In real time this system responds to changes in the flow and rapidly modifies the pressure (Pc) for a precise gradient flow. The percentage of mobile phase B is represented by the dashed line (%B).
0 500 1000 1500 2000 2500
0 15 30 45 60 75 90 105 120 135
Qa(nL/min) Qb(nL/min) QTotal(nL/min) Pc(PSI) %B Time (min) P re ss u re (P S I) 0 50 100 M o b ile P h
ase B (
%
9
trace from a splitless flow system. Here, the absolute flow-rates are directly monitored throughout the gradient elution as well as the total pressure of the system. This provides absolute measurements with the capabilities to compensate if an irregularity or increased backpressure should arise. Investigation of retention time reproducibility in a splitless nanoLC-FTICR MS platform demonstrated less drifting and decreased CIM95%. The identification of nineteen myoglobin tryptic peptides in 3 of 24 replicate injections the CIM95% ranged ±6.3 to ±11.6 seconds and those peptides present in all 24 injections had a maximum CIM95% of ±6.7 seconds. Similar reproducibility was described for the ultrafiltrates from serum and plasma advanced stage ovarian cancer patients samples, 393 species present in 3 of 24 replicate serum injections demonstrated a maximum CIM95% of ±22.0 seconds and 312 species in plasma demonstrated a maximum CIM95% of ±18.5 seconds, again employing a 60 minute gradient.29 Clearly, splitless flow nanoLC affords unprecedented retention time reproducibility and it continues to improve since these early studies.
10
features including effectively dead volume free connections, increased reproducibility between columns, facile temperature controlled integration, and easy switching between experiments. An investigation evaluating chip-based LC and capillary column nanoLC revealed that the former afforded slightly enhanced efficiency.32 More reproducible and homogenously machined frits of the chip-LC columns were attributable to this chromatographic performance.32 Chip-based LC continues to mature and evolve through integration of novel stationary phases and advanced instrumentation.33
11
several buffer systems.37 Over the past decade MuDPiT has been less frequently employed for analysis, and more effective approaches have been developed, such as filter-aided sample preparation (FASP).38
1.2.2 One-Dimensional Gel Electrophoresis
While LC is an extremely important and powerful technique to reduce the complexity of proteomic samples, additional methods have been incorporated into the LC-MS/MS experimental workflow for sample fractionation such as gel-based approaches. In 1996, Shevchenko et al., introduced a robust method for sequencing proteins, and further improved the extremely popular approach.39, 40 First the proteome sample is exploited to one-dimensional (1-D) sodium dodecyl sulfate polyacrylamide gel electrophoresis (SDS-PAGE) to fractionate by molecular weight, and then an in-gel digestion is performed prior to interrogation by LC-MS/MS.39, 40 SDS-PAGE is by no means a novel technique for protein fractionation as it has been integrated into a variety of experimental designs since its development in 1967.41
12
regards to larger proteins. The rate of migration is influenced by the amount of acrylamide used to prepare the gel which determines the size of the pores through which the proteins are sieved (i.e., a greater acrylamide percentage lends to narrower pore size, less migration of larger species, and better resolution of smaller species). Once the proteins are electrophoretically separated, the polyacrylamide gel is stained for protein band detection (e.g., visualization, fluorescent), bands are excised, and an in-gel digestion is carried out as described by Shevchenko.39, 40 Following extraction of peptides from the gel bands, the proteome samples are interrogated by LC-MS/MS.
1.3 Electrospray Ionization
13
Figure 1.5 The ESI mechanism prior to detection by MS. The red species on the outer edge of the
Taylor cone and precursor droplet represent hydrophobic peptides and the yellow species amassed in the center of the droplet represent hydrophilic peptides. A precursor droplet is emitted off the Taylor cone and constantly decreases in size through collisions and evaporation. Upon arriving at the Rayleigh limit, the droplet experiences Coulombic fission into progeny droplets (a). The production of
a gas-phase ion may be described in two ways. The charged-residue model by Dole (b) describes a
cycle of solvent evaporation and Coulombic fission events affording a single analyte droplet which evaporates forming a gas-phase ion. The ion evaporation model by Iribarne and Thomson demonstrated in (c) does not require an ultimate charged analyte, but a force ejecting a gas-phase
ion from the droplet surface. For simplicity, the illustration shows gas-phase ions generated prior to reaching the MS inlet; however, this could also be formed in the inlet capillary while traveling towards the MS.
droplets decrease in size due to solvent evaporation and as a result of collisions with neutral species (e.g., N2, O2). This causes the charge density on the droplets to exceed the surface tension (see Figure 1.5a). Accordingly, this approach to the Rayleigh limit initiates disintegration by Coulombic fission of precursor to progeny droplets.46
Two models describe the transformation of charged ESI droplets into gas-phase ions required for MS measurements. As demonstrated in Figure 1.5b, Dole’s charged-residue model defines cycles of solvent evaporation and Coulombic fission
Coulombic Explosion Solvent Evaporation + + +
MS Inlet & Capillary + + + + + + + + + + + Progeny Droplets + + + + + + “Product” Precursor Droplet
Charged Residue Model
+
+ +
+
+
Ion Evaporation Model
+ + + +
b
c
MP Gradient Oxidation2H2O(l) O2(g) + 4H+(aq) +4e
-+ + + + + + + + + + + + + + + + + + -Precursor Droplet Taylor Cone Droplet Evaporation Coulombic Fission Rayleigh Limit Surface Tension < Coulombic Repulsion
Emitter Tip + + + + + + + + + ++ ++ + + + + + + + + + + + + + ++ + +
14
rendering an ultimate charged droplet which contains a single analyte molecule.47 Residual solvent continues to evaporates leaving the charge to reside on the analyte.47 The ion evaporation model presented by Iribarne and Thomson (see Figure 1.5c) describes a similar cascade of evaporation and Coulombic fission events leading to droplets with decreasing radii and increasing charge density. These conditions produce an environment in which the electrostatic field at the droplet surface provides the force necessary to drive the solute ion from the droplet in production of a gas-phase ion.44, 48
The activated process by which an analyte ion evaporates or is desorbed from the droplet surface and produces signal depends upon several factors. Fenn describes that varying the initial analyte concentration demonstrated a linear response with signal until arriving at the saturation value.44, 49, 50 Other aspects such as hydrocarbon chain length, charge-state distribution, geometry and molecular conformation of analyte species, and droplet evaporation rate demonstrate recognized variability in signal from the electrospray process.44 Though Fenn highlights the aforementioned, previous studies in the Muddiman laboratory demonstrate that overall, hydrophobicity exists as the foremost cause of electrospray response.51 It is apparent that the electrospray response is resultant of a variety of factors, those of analyte characteristics, as well as LC parameters described by more recent investigations vide infra.
15
at nanoflow-rates.52, 53 As the mobile phase composition is changing throughout a gradient elution LC-MS experiment, the surface tension of the droplet on the emitter tip is constantly decreasing as a function of increased organic composition in RP LC. A fixed voltage applied for LC-MS with changing solvent composition consequently alters the ESI, and accordingly, the sensitivity and precision of the measurement.52 Although not well understood or evaluated, the lower the flow-rate, the greater the detection efficiency.53, 54 Furthermore, flow-rates less than 100 nl/min afford greater sensitivity, and contrary to what is more commonly thought, pulsating ESI (lower voltage range) provides greater efficiency in MS signal than the cone-jet regime (higher voltage range).53 There is still much to understand and appreciate in the mechanisms of nano-ESI.
1.4 Mass Spectrometry
16
instruments with multiple mass analyzers in series (i.e., Triple Quadrupole MS (QqQ)) affording several stages of mass filtering for selectivity and sensitivity in measurements.
1.4.1 Fourier Transform Mass Spectrometry Principles and Related Hybrid
Platforms
FTMS is a very high resolving power MS technique, and currently the hybrid LTQ-FTICR MS and the hybrid LTQ-Orbitrap MS are employed for modern proteomic detection. FTICR MS first described and spectra obtained in 197456, 57 and later, the Orbitrap mass analyzer developed by Makarov in 2000,58, 59 afford high MMA (i.e., low to sub-ppm)60, 61 and resolving power over a wide mass range, and ultimately, highly confident analyte identification. LTQ-FTMS is capable of performing in a variety of modes suitable for global, discovery proteomic investigations. Data-dependent acquisition (DDA) is most frequently used and the LTQ-FTMS executes interrogation by first performing a broadband survey scan in the ICR cell or Orbitrap (see Figure 1.6). However, before the ions can be measured, they are initially guided and tightly focused into the LTQ.62
17
Figure 1.6 The sequence of events in FT-based MS platform, the LTQ-Orbitrap is demonstrated here
with an initial collection of ambient ions transferred to the C-trap to then be added to the sample ions for real-time recalibration with lock mass.62 In an FTICR MS, there is no collection of ions in a C-trap or lock mass calibration. A broadband survey scan begins and continues for a time period, according to the mass resolving power, followed by fast Fourier transform (FFT) processing while MS/MS is completed in the ion trap. This cycle of DDA includes a user defined ion population for the broadband precursor scan and 8 tandem MS events displayed here.
unstable ions will be ejected from the trap, thus also affording mass filtering of a selected m/z range.62
In addition, the ion population is defined by automatic gain control (AGC) and ion injection time. AGC is imposed to acquire an equivalent charge density experimentally as during external calibration. If the defined AGC is not reached, the user defined maximum ion injection time controls the ion population and terminates the event. Consequently, a lesser charge density and lower signal intensity is amassed. Inconsistent charge density in the mass analyzer, either too high or too low, results in decreased measurement sensitivity and MMA effecting protein identification.64, 65 Resultant of accumulating too many ions, space-charge effects, or the repulsion between molecules of like charge, are realized. Generally, in complex biological samples, ions rapidly fill the ion trap reaching the user defined AGC before the end of the specified maximum ion injection time.
LT
Q-Or
b
itr
a
p
8
M
S
2
Ion Trap C-Trap Orbitrap Processor
1e6
Broadband Scan
FFT
1
0 2 3
Time (s)
Ion Injection
Time (8e3) Scan TimeElapsed MS21 MS22 MS23 MS24 MS25 MS26 MS27 MS28
18
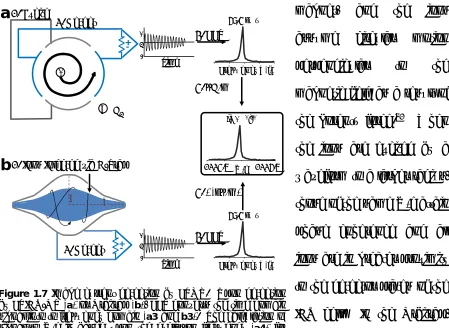
This accumulation of ions or ion packet is further focused and injected into the ICR cell (FTICR MS) or into the curved linear trap (C-trap) and then injected into the Orbitrap (Orbitrap MS) for the broadband survey scan as exhibited in Figure 1.6. The C-trap in the Orbitrap platform is a curved, RF-only quadrupole which accumulates, stores, and cools ions for subsequent injection into the Orbitrap. As demonstrated in Figure 1.7a, the ICR cell is located inside a superconducting
magnet, and the ions assume circular motion perpendicular to the magnetic field as a result of the Lorentz force.61 When the ions are excited by a waveform to a larger radius, those of the same m/z attain phase coherence and all ions are in greater proximity to the detector plates of the ICR cell. In the Orbitrap, electrostatic attraction and centrifugal force imposes ion oscillation around the inner spindle and along the Z-plane (see Figure 1.7b), and no additional excitation is necessary following ion packet injection. Induced current from the ion packet oscillation is detected as the
X B 0 1. Excite 2. Detect + 0 + 0 -+ 0 -Time Time + -58.4 kHz Frequency X(f)
1224.6 m/z 1225.6 [M+H+]1+
4. qB/m 3. FFT + + -+ 0 -+ 0 -Time Time 58.4 kHz Frequency X(f)
4. √(kq/m)
3. FFT 2. Detect
1. Ions Injected via C-Trap +
Z X
b
a
Figure 1.7 Image current detection by FTMS. Upon detection
by FTICR-MS (a) or Orbitrap (b), FFT converts the time domain
signal into to frequency domain (a3 and b3). The calculation of
19
ion packets pass the detection plates (see Figure 1.7a2 and b2), and signal is recorded as a complex waveform, or the sum of all the characteristic frequencies of the measured species at a particular instant. The magnitude of the image current as a function of time and oscillating radius (I(t,r)) for each mass analyzer is proportional to the charge (q) and number of ions (N), and is given by
, cos Equation 1.5
, sin Equation 1.6
For FTICR-MS, the average post-excite radius (r), cyclotron frequency (ωc), and distance between the detector plates (d) remain constant for an ICR cell geometry and species (Eq. 1.5).66 In Orbitrap measurements, frequency of the axial oscillations (ω), axial amplitude (∆z), and the monotonically decreasing average radius (λ(r)) remain constant for the Orbitrap geometry and measured species (Eq. 1.6).59
Upon image current detection as a function of time, fast Fourier transform (FFT) is used to process the time domain transient into the frequency domain.67 Ion oscillation in the ICR cell is based on the cyclotron frequency (ωc)61, whereas axial frequency (ω) is proportional to the oscillation in the Orbitrap mass analyzer independent of initial kinetic energy.59, 60 As such, the frequency domain is converted into m/z space and thus mass spectrum output is given by
Equation 1.7
20
wherein q is the charge, β the strength of the magnetic field in FTICR (Eq. 1.7), m
the mass, and k is a constant associated with electrode shape and the applied potential for the Orbitrap (Eq. 1.8).68
21
1.4.2 Time-of-Flight Mass Spectrometry Principles and Related Hybrid Platforms
While the first time-of-flight (TOF) instrument was proposed in 1946 by Stephens69 and the first working TOF described by Cameron and Eggers in 194870, it was not until later that TOF grew in popularity due to improvements in resolving power, ion optics, and more powerful data processing technologies, for example.71 Inherent in its title, TOF MS interrogates ions and determines m/z based on the time ions spend in flight. Similar to FTMS-based platforms, TOF is a pulsed-based mass analyzer and able to record all ions in parallel for simultaneous detection. An ion packet is accelerated and dispersed by providing the ions with the same kinetic energy and allowing them to travel a fixed distance in which the arrival times are a function of m/z. The velocity is inversely proportional to the square root of m/z.70
A hybrid TOF platform, quadrupole/orthogonal-acceleration (QqTOF), a mass resolving quadrupole prior to an RF-only hexapole collision cell with a TOF MS for detection, was first described in 1996 affording high resolving power and high MMA MS and MS/MS measurements (see Figure 1.8).72, 73 A quadrupole consists of four cylindrical electrodes assembled in a radial fashion. Opposing rods are of the same polarity and adjacent rods are of opposite polarity. The quadrupole operates similarly to a quadrupole ion trap using RF fields to control ions trajectories; however, the utility of the quadrupole is to form ion beams of a particular m/z range (e.g.,wide, narrow) which are transmitted through into the coupled mass analyzer.
22
and sensitivity of the instrument platform in both precursor and product ion modes. Q0 serves as an ion guide in RF-only mode which provides collision damping and focuses the ESI ions at atmospheric pressure into the subsequent quadrupole, Q1. Depending on the interrogation mode, MS or MS/MS, Q1 operates in RF-only mode or mass filter mode, respectively, to allow only the precursor(s) of interest into the collision cell. Also depending on the interrogation mode, Q2 operates in RF-only mode for precursor detection or as a collision cell where CID occurs for product ion mode. Following the events in the quadrupoles, ions are accelerated, focused, and pushed orthogonally into the TOF flight tube and detected.72
While initial direction and velocity of ions in the TOF mass analyzer may limit signal sensitivity, it is common to realize mass resolving power near 10,000FWHM and MMA <5ppm can be achieved.74 Recently, further improvements to the QqTOF, such as advanced ion guide technology75, increased resolving power for both MS and MS/MS exceeding 25,000FWHM, and ion mobility technologies76, have enhanced measurement sensitivity and speed of data acquisition. Also, better and more
Collision Cell
q2 Q1
Precursor Ions Sample Introduction
& Ionization
TOF Flight
Tube Ion Pulser
Detector
Figure 1.8 Simplistic representation of QqTOF. Q1 is mass
filter followed by a collision cell (q2), in which the ions are subjected to CID. Fragment ions exit q2 and are subjected to high voltage pulse in the ion pulser which pushes ions orthogonally through a slit into the flight tube. For a given kinetic energy (of an ion), an ion with a lesser mass will travel faster than that with a greater mass, and therefore, the m/z
23
powerful electronics for ion detection has increased the dynamic range of modern TOF mass analyzers.
1.4.3 Triple Quadrupole Mass Spectrometry Principles
The QqQ MS is the most frequently used instrument for quantification in proteomic analysis, and is similar to a QqTOF; however, replacing the TOF mass analyzer with a final quadrupole. Analogous to the QqTOF, Q0 functions in RF-only mode focusing ions, Q1 and Q3 are mass filtering quadrupoles, whereas Q2 is a high transmission focusing device and RF-only.77, 78 Affording moderate resolution and scan rate, a QqQ offers a very high duty cycle and thus high sensitivity detection. Several types of experiments may be performed for selective, and thus sensitive, measurements as theoretically no ions of interest are lost because the MS is not scanning a large range, but fixed at a user defined m/z value at a specific resolution.
24
only the ions of interest
through the quadrupoles, and chemical background or
noise is eliminated from
the measurement. As an example in highlighting the value of SRM versus SIM, the chicken proteome database (IPI ver. 3.80) was in silico digested with trypsin and up to 2 missed cleavages were allowed. The m/z windows for Q1 and Q3 were set to unit resolution for the TSQ Vantage QqQ (Thermo Scientific) when operated in EZ Mode for scheduled SRM experiments. Precursor m/z = 684.3149 (2+ charge-state
ion for the peptide AADGTWQDFATGK) was considered with charge-states up to 4+ in regards to the previously generated in silico tryptic peptides. In Table 1.1 it is displayed that when no product ion is defined for the precursor ion of interest, which is identical to performing a SIM experiment (see Figure 1.9b), 12,182 tryptic peptides matched the input precursor m/z. Defining transitions (precursor-product ion pairs) this value significantly decreases. Depending on the product ion selected for one
Figure 1.9 Two modes of operation for triple quadrupole MS
analysis. SRM mode affords detection of defined transitions (a),
while SIM mode does not induce dissociation in q2, but monitors one or several selected m/z values.
Product Ions # Peptides
SIM Scan 12182
y8 2069
y7 1260
y3 2131
y2 2204
y3, y8 373
y2, y3 769
y3,y7 282
y2,y8 412
y7,y8 259
y2,y7 274
y2, y3,y7 117
y2, y3,y8 149
y2,y7,y8 55
y3,y7,y8 45
y2,y3,y7,y8 22
Table 1.1 Numbers of in
silico tryptic peptides
mapping to the precursor mass and transitions. No product ion was defined for the first example (SIM Scan).
Select m/z RF Only (CID) Select m/z
Q1 q2 Q3
Select m/z RF Only
Q1 q2 Q3
25
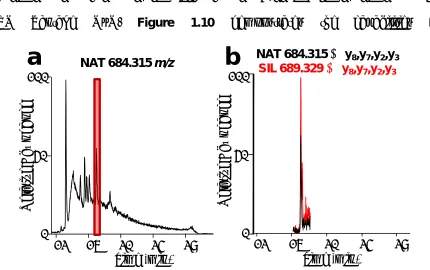
monitored transition, y8, y7, y3, or y2, 1260-2204 peptides matched the input precursor and one product ion. Including more transitions in the experiment and in different combinations, the numbers of matching peptides decrease to 22 in this example. Upon consideration of the peptide retention time and co-elution with a stable-isotope labeled (SIL) peptide, a unique species can be discerned in SRM experiments from a complex biological sample. Executing this experiment on the TSQ Vantage QqQ, Figure 1.10 demonstrates the capabilities of
Figure 1.10 Extracted ion chromatograms from digested non-depleted chicken plasma comparing
SIM mode (a) to SRM mode using retention time scheduling in a two minute window (b) of peptide
AADGTWQDFATGK. NAT refers to the endogenous peptide in the sample and SIL refers to the internal standard.
each operational mode. It was confirmed that the peptide of interest (m/z = 684.315) elutes at approximately 17 min. In SIM mode (Figure 1.10a) there is clearly background noise throughout the gradient elution, while in SRM mode (Figure
R
e
la
tiv
e
A
b
u
n
dance
NAT 684.315 y8,y7,y2,y3
SIL 689.329 y8,y7,y2,y3
Time (min) 0
50 100
R
e
la
tive A
b
u
n
danc
e
NAT 684.315 m/z
12 16 20 24 28
a
b
Time (min)
12 16 20 24 28
26
1.10b), there is one peak of the endogenous species co-eluting with a synthetic SIL peptide of the same sequence and having the same physio-chemical properties.
1.5 Mass Spectrometry Based Quantification for Proteomic Analysis
In addition to protein identification by LC-MS/MS, profiling changes of these gene products affords insight into molecular changes of the cell state. Measurements of relative (measure of percentage or fold-change in comparison of one condition to another) and absolute (number of moles or mass of material of specific analyte in a defined volume) quantification can be realized through LC-MS-based investigations. Variations between samples may be attributable to differential protein expression, and these pathological or non-pathological deviations can be measured with either label-free approaches or labeling strategies. The scientific challenge at hand will influence which technique will be most advantageous and amendable to the proteome system of interest.79 Here, in our laboratory, label-free spectral counting has been a vital method for relative protein quantification in global proteomic experiments, while labeling methods such as isotope dilution mass spectrometry (IDMS) incorporating a stable isotope labeled (SIL) internal standard is used for targeted studies deducing absolute protein quantification.
1.5.1 Label-free Spectral Counting for Relative Protein Quantification
27
reagent into one cell state while a “heavy” label or isotopic reagent is added to the other.80, 81 Generally, the protein samples are combined in a specified ratio (i.e., 1:1), digested, and simultaneously interrogated by LC-MS/MS. Peptides existing in both samples, in a comparison of two samples for instance, and measured by MS will be separated on the mass spectrum by a mass difference due to the labeling (a few to several Daltons between identical species). The ratios of heavy to light abundances provide quantification of protein expression between samples. Several of the contemporary approaches are listed as follows. Chemical derivatization methods include isotope-coded affinity tags (iCAT)82, 83 comparing area under the curve between analogous heavy and light peptides, and isobaric tag for relative and absolute quantification (iTRAQ)84 and tandem mass tags (TMT)85 affording quantification by abundance of the reporter mass tag in MS/MS. Biological incorporation methods such as metabolic labeling with 15N, stable isotopic amino acids in cell culture (SILAC)86, 87, and Super SILAC88, 89 exploit the ratio of peak intensities for relative quantification. Also, incorporation of 18O through enzymatic cleavage has been demonstrated comparing peak intensities of analogous species for relative quantification.90
28
interpretation, and no strict limit on experimental conditions for comparison, are realized. Two strategies generally employed for label-free relative quantification include exploiting the ion signal intensity28, 93, 94 or peak area95, 96 mapping to a protein from the broadband survey scan and the number of identified MS/MS spectra assigned to a protein, termed spectral counts (SpC) (see Figure 1.11).
Figure 1.11 Demonstration of label-free spectral counting for relative quantification of proteins. Each
MS/MS peptide assignment to a protein is the number of SpC for that gene product. The more abundant the protein the greater the number of peptides, and accordingly, a greater number of SpC to be assigned.
SpC has been established as a practical and straightforward method for label-free quantification. Yates and coworkers demonstrated that a linear correlation exists between SpC and relative protein abundance over two orders of magnitude.97 Additionally, correlation with SpC was demonstrated with isotopic labeling approaches98 and peak area intensity.99 It has been revealed that SpC is less accurate when compared to isotope labeling techniques due to variations in experimental procedure.100 However, it was recently shown that increasing numbers of spectral counts mapping to a protein afford increasing sensitivity relative to SILAC.101 Also, proteins measured having greater SpC exhibit less analytical
nanoLC-MS2
# of MS2mapping to protein = # SpC = 4
Reduce Alkylate
Digest
m/z m/z
m/z m/z
29
variation than those with lower numbers of SpC.101-103 While SILAC is designated as a greater approach overall due to its sensitivity to detect change in proteome expression, it may not be amendable to the sample of interest (e.g., Homo sapiens, model systems that do not readily uptake stable isotopes) and SpC achieves relative quantification regardless of the model system.101
Label-free relative quantification is an immerging strategy, and it does have certain limitations which advocate for further inspection. Digestion completeness, peptide separation and ionization efficiency, randomness of DDA, and dynamic exclusion settings may induce bias into quantification measurements.97, 104 To reduce variance between experiments, several forms of normalization have been proposed for SpC, and thus afford reliable relative quantification and comparison between experiments. Recently, Gokce et al., evaluated three normalization techniques which include normalized spectral abundance factor (NSAF)105, total spectral count normalization (TSpC)106, and normalization to selected proteins (NSP).107 NSAF accounts for protein length and variations between runs, TSpC normalizes based on the replicate with the greatest number of SpC, and NSP exploits an endogenous or exogenous protein(s) and normalizes to any change in SpC of the protein(s) between replicates. It was observed that TSpC and NSAF normalization afforded slopes near unity comparing the same proteins in different data sets all from the same initial sample.107 Additionally, it was demonstrated that the accuracy in quantification relies on the number of SpC observed as mentioned
30
considering the same constraints in cut-off values and significance levels for proteins with varying SpC, thus, the absolute number of SpC influences the probability of distinguishing change.107
1.5.2 PC-IDMS for Absolute Protein Quantification
The isotope dilution (ID) concept has greatly influenced the field of proteomics and MS in measuring absolute protein quantification. The ID methodology in MS involves the addition of a known amount of isotope-labeled standard into the sample of interest in which the standard behaves analogous in chromatographic performance, but the two species are differentiated by m/z.108 For quantification of a targeted protein, the protein cleavage (PC) IDMS strategy initially described by Desiderio and coworkers and later by Barr et al., affords an absolute measurement of protein concentration (see Figure 1.12).109, 110 Later Gygi and co-workers performed the technique and gave it the name AQUA.111-115 In principle, a unique peptide cleaved from a protein of interest can provide a measure of concentration for the protein of interest attributed to the presence of one cleaved peptide per protein in the sample, thus 1:1 molar ratio.
31
reduces the number of peptides to be individually synthesized, purified and quantified prior to absolute quantification.117, 118 Bias exists in absolute quantification measurement from proposing that the selected peptide concentration is representative of the protein concentration, particularly if only one peptide is employed for protein quantification, and Garin and coworkers achieved a more robust absolute quantification incorporating a full-length in
vitro-synthesized SIL protein of interest.119 This
ideal design, Protein Standard Absolute Quantification (PSAQ), overcomes limitations of SIL peptide use in absolute quantification (e.g., equivalent digestion efficiency of analogous peptides, greater sequence coverage and statistical review).119
PC-IDMS is readily analyzed by QqQ MS in SRM mode described vide supra, wherein only signal from a specified fragment ion from a predetermined precursor ion, or multiple fragment ions from a predetermined precursor ion are detected. This approach employs rapid gradients, thus high-throughput, and focused analysis of only the peptides of interest with limited chemical background as described earlier. The combination of retention time, peptide mass, and fragment mass affords an
Reduce Alkylate Digest
Protein: Peptide (1:1) SIL Peptide
•Unique •Known Amount
LC-MS
m/z
NAT SIL
A
b
und
a
n
ce
Figure 1.12 The workflow
32
incredibly specific measurement that is capable of achieving a quantification range of 4-5 orders of magnitude.120
PC-IDMS-SRM was first performed directly in serum, a complex and dynamic biological proteome described vide supra opposed to an immune-affinity purified sample, for the absolute quantification of the biomarker prostate-specific antigen (PSA).121 More recently, PC-IDMS-SRM was performed for absolutely quantifying C-reactive protein (CRP) in 110 benign tumor and epithelial ovarian cancer (EOC) stages I-IV patient serum.122 It was demonstrated again that it is possible to quantify a biomarker in plasma with limited fractionation (i.e., LC-MS/MS), and as the disease progressed the levels of CRP increased.122 Furthermore, the identical serum samples were analyzed by a typical clinical method, an enzyme-linked immunosorbent assay (ELISA), and strong correlation existed between the measurements; however, PC-IDMS-SRM CRP levels were approximately 1 order of magnitude larger.122 Although this disparity, which was described by the difference in methodology reference ranges, the correlating data of both techniques validate the increase of CRP with the progression of EOC stage.122
The success of the PSA and CRP biomarker investigations described vide
supra, as well as all studies of absolute quantification with PC-IDMS-SRM are highly
33
been generated, these data form a spectral library by which to initiate signature peptide selection filters. Without a spectral library, the protein of interest is subjected to an in silico digest based on the preferred protease for experimentation and the resulting peptides are then filtered based on the following guidelines. The signature peptide must be unique to the sample matrix and a reasonable size (i.e., 8-25 amino acids) to ensure sensitive MS detection. If a spectral library is available, any peptides detected with missed cleavages or PTMs should be eliminated. A preliminary list of candidate signature peptides is generated and further sorted for consideration of reactive residues, single nucleotide polymorphisms (SNPs), PTMs, MS/MS analysis from spectral libraries, and feasible synthesis. One or several peptides may be selected for PC-IDMS-SRM from this final list of candidate signature peptides.
1.6 Synopsis of Completed Research
34
Figure 1.13 Similar to Figure 1.1, here illustrates the proteomic workflow and the investigations
described throughout the following chapters of this document. A solid framework of the biological problem at hand and contributions to the various approaches and strategies of analysis persist in the enhancement of proteome measurements. Those items highlighted in yellow represent the various developments, utilizations, modifications, integrations, evaluations, and improvements prevailed during the investigations described in this dissertation.
was utilized for all research presented here apart from the final chapter in which new LC technology was available for the investigation.
Exploration into the proteomes of model bacterial systems,
Caldicellulosiruptor saccharolyticus, Thermotoga maritima, and a co-culture of the
two microbial communities, is described in Chapter 3 and Chapter 4. This two-part investigation affords extra-cellular sample preparation approaches employing label- free SpC as a measurement of sample recovery and comparison of intracellular proteomic profiles between individual and co-cultured bacteria. Aspiring to identify a
Mass Analysis •LTQ-FTICR •LTQ-Orbitrap •QqTOF •QqQ Detection Bioinformatics •Qualitative •Quantitative •Relative (SpC) •Absolute (SRM) Sample Introduction & Ionization
Atmospheric Pressure High Vacuum
Sample Introduction •nanoLC with vented column •cHiPLC Ion Source •ESI
Mass Analysis Detection
[M+2H+]2+ 977.4844 Da 977.0 979.0 m/z m/z Proteome Prep •1D Gel •Precipitation •Extraction •FASP •Digestion 1D Gel
Addressing Sophisticated Biological Questions • Characterize Microbial Communities
• Ovarian Cancer Biomarkers in the Chicken Model
35
greater number of proteins gaining more proteome depth, the results compelled research to discern the effectiveness of the instrument platform.
Efforts to efficiently and empirically demonstrate improvement in proteome coverage on FTMS-based instrumentation through modification of several instrument parameters is entailed in Chapter 5. Here, fractional and full factorial experimental designs are integrated into a proteomics workflow and utilized to screen for significant factors and improvement is gained in proteome coverage on
Saccharomyces cervisiae, the most studied proteome by LC-MS/MS. Expanding on
this analysis to achieve even greater proteome coverage, Chapter 6, describes the evaluation of a different MS instrument platform examining the identical S. cervisiae
trypsinized sample. Operating with different MS technology, the TripleTOF 5600 (AB SCIEX) affords increased proteome coverage and is complementary to the previous investigation.
36 1.7 References
(1) Kenyon, G. L.; DeMarini, D. M.; Fuchs, E.; Galas, D. J.; Kirsch, J. F.; Leyh, T. S.; Moos, W. H.; Petsko, G. A.; Ringe, D.; Rubin, G. M.; Sheahan, L. C. Defining the mandate of proteomics in post-genomics era: Workshop report.
Mol. Cell. Proteomics. 2002, 1, 763-780.
(2) de Hoog, C. L.; Mann, M. Proteomics. Annu. Rev. Genomics. Hum. Genet. 2004, 5, 267-293.
(3) Jones, H. B. On a New Substance Occurring in the Urine of a Patient with Mollities Ossium. Philos. Trans. R. Soc. London. 1848, 138, 55-62.
(4) Kyle, R. A. Henry Bence Jones - Physician, chemist, scientist and biographer: A man for all seasons. Brit. J. Haemathol., 2001, 115, 13-18.
(5) Kyle, R. A. Multiple-Myeloma - How Did It Begin. Mayo Clin. Proc., 1994, 69, 680-683.
(6) Polanski, M.; Anderson, N. L. A List of Candidate Cancer Biomarkers for Targeted Proteomics. Biomarker Insights. 2006, 1, 1-48.