DOI: 10.1534/genetics.110.126177
Gene Expression Differences Among Primates Are Associated With Changes
in a Histone Epigenetic Modification
Carolyn E. Cain,
1Ran Blekhman,
2John C. Marioni
3and Yoav Gilad
1Department of Human Genetics, University of Chicago, Chicago, Illinois 60637
Manuscript received December 22, 2010 Accepted for publication February 8, 2011
ABSTRACT
Changes in gene regulation are thought to play an important role in speciation and adaptation, especially in primates. However, we still know relatively little about the mechanisms underlying regulatory evolution. In particular, the extent to which epigenetic modifications underlie gene expression differ-ences between primates is not yet known. Our study focuses on an epigenetic histone modification, H3K4me3, which is thought to promote transcription. To investigate the contribution of H3K4me3 to regulatory differences between species, we collected gene expression data and identified H3K4me3-associated genomic regions in lymphoblastoid cell lines (LCLs) from humans, chimpanzees, and rhesus macaques, using three cell lines from each species. We found strong evidence for conservation of H3K4me3 localization in primates. Moreover, regardless of species, H3K4me3 is consistently enriched near annotated transcription start sites (TSS), and highly expressed genes are more likely than lowly expressed genes to have the histone modification near their TSS. Interestingly, we observed an enrichment of interspecies differences in H3K4me3 at the TSS of genes that are differentially expressed between species. We estimate that as much as 7% of gene expression differences between the LCLs of humans, chimpanzees, and rhesus macaques may be explained, at least in part, by changes in the status of H3K4me3 histone modifications. Our results suggest a modest, yet important role for epigenetic changes in gene expression differences between primates.
C
OMPARATIVE studies of gene expression have identified a large number of differentially ex-pressed genes among primate species (Enard et al. 2002; Ca´ ceres et al. 2003; Karaman et al. 2003; Khaitovich et al. 2004, 2005; Gilad et al. 2006; Blekhman et al. 2008, 2009, 2010; Babbitt et al. 2010a). In a number of cases, these studies also pointed to possible connections between interspecies differ-ences in gene regulation and differdiffer-ences in ultimate physiological or morphological phenotypes (Rockmanet al. 2005; Loisel et al. 2006; Pollard et al. 2006; Prabhakar et al. 2008; Warner et al. 2009; Babbitt
et al. 2010b). However, we still know little about the relative importance of different regulatory mechanisms to interspecies differences in gene expression levels
(Chabot et al. 2007; Blekhman et al. 2009). In particular, little is known about the relative contribu-tion of changes in epigenetic modificacontribu-tions to regula-tory variation in primates.
Comparative studies of one class of epigenetic marker, DNA methylation, suggest that interprimate differences in epigenetic modifications may be abun-dant. For example, Gama-Sosaet al.(1983) found that relative global methylation levels across tissues gener-ally differ between human and three other primate species (with the exception of hypermethylation in the brain and the thymus, which was observed in all stud-ied species). Focusing on individual loci, Enard et al. (2004) compared methylation profiles of 36 genes in livers, brains, and lymphocytes from humans and chimpanzees and found significant interspecies meth-ylation level differences in 22 of the 36 genes, in at least one tissue.
A somewhat different picture may be emerging from comparative studies of a different class of epigenetic markers, histone modifications; however, to our knowl-edge, no comparisons of histone modifications in primates have yet been published. An early comparative study of 15 genomic regions associated with histone acetylation in humans found evidence for conservation of the histone acetylation status of 10 of the orthologous regions in mouse (Rohet al.2007). On a larger scale, characterization of several types of histone modifica-Supporting information is available online athttp://www.genetics.org/
cgi/content/full/genetics.110.126177/DC1.
Available freely online through the author-supported open access option.
The RNAseq and ChIPseq data are available at the Gene Expression Omnibus (GEO) database (http://www.ncbi.nlm.nih.gov/geo/) under series accession no. GSE24111.
1Corresponding authors:Department of Human Genetics, University of
Chicago, 920 E. 58th St., CLSC 317, Chicago, IL 60637. E-mail: [email protected] and [email protected]
2Present address: Department of Molecular Biology and Genetics,
Cornell University, Ithaca, NY 14853 and Department of Neurology and Neuroscience, Weill Cornell Medical College, New York, NY 10065.
3Present address:EMBL-EBI, Wellcome Trust Genome Campus,
Hinx-ton, Cambridge CB10 1SD, United Kingdom.
tions on human chromosomes 21 and 22, and the syntenic chromosomes in mouse, indicated that the genomic locations of these epigenetic markers at orthologous loci are generally strongly conserved, even in the absence of sequence conservation (Bernstein
et al. 2005; Wilson et al. 2008). Interestingly, the conservation of histone modification patterns was high-est in genomic regions proximal to annotated ortholo-gous genes.
With few exceptions, however (e.g., with respect to DNA methylation; Farcas et al. 2009), comparative studies in primates have not explored the extent to which epigenetic differences between species underlie interspecies differences in gene regulation. To take first steps toward this goal, we compared gene expression levels and histone modification data in samples from humans and two of our closest extant evolutionary re-latives, chimpanzees (Pan troglodytes) and rhesus mac-aques (Macaca mulatta).
To facilitate inferences of causality in our data, we chose to focus on the trimethylation of lysine 4 of histone H3 (H3K4me3), because its role in gene regulation is relatively well understood. Specifically, the observation that RNA polymerase II (polII) coloc-alizes with genomic regions characterized by H3K4me3 led to the hypothesis that polII is one of the factors that help recruit the methyltransferases that establish H3K4me3 marks (Gerber and Shilatifard 2003; Hampseyand Reinberg2003; Nget al.2003; Heintzman
et al.2007; Ruthenburget al.2007). Once established, H3K4me3 facilitates the recruitment of the BPTF sub-unit of the nucleosome-remodeling factor (NURF), which promotes chromatin accessibility (Li et al. 2006; Wysockaet al.2006; Ruthenburget al.2007). Additionally, H3K4me3 blocks binding of the NuRD nucleosome-remodeling and deacetylase compressor complex, which decreases chromatin accessibility (Nishioka et al. 2002; Zegerman et al. 2002). The H3K4me3 modifications, therefore, are thought to re-sult in more accessible chromatin and to facilitate active transcription. General support for this mechanism comes from the observation that H3K4me3 is enriched near the transcription start sites (TSS) of active genes. Moreover, highly expressed genes are more likely than lowly expressed genes to be associated with H3K4me3 modifications (Santos-Rosaet al.2002; Schneideret al. 2004; Schu¨ beler et al. 2004; Pokholok et al. 2005; Karlicet al.2010).
In addition, several functional studies have found that disruption of the histone methyltransferases that cata-lyze H3K4me3 leads to a decrease in transcription levels. For example, Nislowet al.(1997) showed that knock-ing out the yeastSET1gene, whose protein methylates H3K4, leads to lower gene expression levels of a subset of target genes. Similarly, Wanget al. (2009) demon-strated that disrupting the methyltransferase domain of Mll1in mouse embryonic fibroblasts leads to decreased
levels of H3K4me3 and concomitant lower expression levels of a large number of genes. Using a different system, Nishioka et al. (2002) showed that when the human methyltransferase SETD7 is recruited to re-porter constructs, it specifically methylates H3K4 and promotes higher reporter gene expression levels.
Thus, a large body of work has established a causal link between H3K4me3 and gene regulation. In what follows, we use this link to query the proportion of genome-wide gene expression differences between closely related primate species that may be explained by corre-sponding differences in H3K4me3.
MATERIALS AND METHODS
Samples, study design, and cell culture:Three lymphoblas-toid cell lines (LCLs) were used from each primate species: human, chimpanzee, and rhesus macaque. LCLs were ob-tained from Coriell (http://www.coriell.org/), New Iberia Research Center (University of Louisiana at Lafayette), and New England Primate Research Center (NEPRC, Harvard Medical School) and were all derived from male individuals. Details on all samples can be found inTable S1. Regardless of species, cells were maintained at identical conditions of 37°
with 5% CO2 in RPMI media with 15% FBS, supplemented
with 2 mm l-glutamate, 100 IU/ml penicillin, and 100mg/ml
streptomycin.
Chromatin immunoprecipitation: To determine localiza-tion of H3K4me3, we used ChIPseq (seesupporting informa-tion, File S1 for details on the ChIP protocol). Each ChIP sample, and a pooled input control from each species, was sequenced in one lane of an Illumina GAII flow cell. Sequenced reads were mapped to the human (hg18, March 2006), chimpanzee (panTro2, March 2006), or rhesus ma-caque (rheMac2, January 2006) genomes, as appropriate, using MAQ (Li et al. 2008) version 0.6.8. After excluding
reads with a MAQ quality score,10, we used MACS (Zhang
et al.2008) with aP-value cutoff of 0.0005 (Table S2) to identify peaks of H3K4me3-associated genomic regions and to esti-mate a false discovery rate (FDR) for each peak on the basis of the input sequence data from each species. In principle, at this point we could begin to compare H3K4me3 across individuals and species by investigating whether each modified site is observed in all, or in a subset, of the three species. However, a naı¨ve comparison of the lists of genomic regions associated with H3K4me3 modifications across species ignores the fact that evidence for an H3K4me3 peak in one species provides information about the likelihood of an H3K4me3 peak in closely related species. To take this into account, we classified H3K4me3-associated genomic regions by using a two-step FDR cutoff.
Specifically, we first used a stringent FDR cutoff of 2% to classify H3K4me31regions in each individual. Subsequently,
these regions were mapped to the genomes of the other two species with the BLAST-like alignment tool (BLAT) to de-termine orthology (seeFile S1), and the FDR threshold for observing peaks at the orthologous sites in all other samples was relaxed to 5%. The choice of specific thresholds was based on the overall distribution of FDR values (seeFigure S2). A species was considered positive for H3K4me3 at a given genomic region if at least one individual from the species was positive for H3K4me3 at that region.
(seeFile S1andTable S4). Ensembl ensGene TSS coordinates
were downloaded for human (hg18) from Galaxy (http://
main.g2.bx.psu.edu/) and were mapped to the other two genomes (panTro2 and rheMac2) with both LiftOver (http:// hgdownload.cse.ucsc.edu/admin/exe/) and BLAT (http:// genome.ucsc.edu/), resulting in 35,232 unique TSS from 25,160 genes. TSS were considered H3K4me31
for a sample if a H3K4me3-associated region was present within 1 kb of the
TSS, and a gene was considered H3K4me31
in a species if at least one of its TSS in at least one individual was classified
H3K4me31
.
RNA sequencing and analysis of differences in gene expression levels:RNA was extracted from each LCL sample using a Qiagen RNeasy mini kit. We confirmed high quality of the RNA using Agilent’s 2100 Bioanalyzer (RIN$9.3 for all samples). Samples for RNA sequencing were prepared as previously described (Marioniet al.2008). Each sample was
sequenced in one lane of an Illumina GAII flow cell, and reads were mapped to the human (hg18), chimpanzee (panTro2), or rhesus macaque (rheMac2) genomes, as appropriate, with MAQ (Liet al.2008) version 0.6.8. We then mapped the reads
to a set of previously annotated 150,107 orthologous exons from 20,689 genes in the three species (Blekhmanet al.2010),
excluding reads with MAQ mapping quality scores ,10.
Estimates of gene expression levels were obtained by summing the number of reads mapping to all exons of a gene. Gene expression was analyzed with an approach similar to that used previously (Marioniet al. 2008; Blekhmanet al. 2010) (see
File S1for more details).
Comparing expression profiles and H3K4me3-associated regions: Of the 14,526 genes with expression data and the 25,160 genes with orthologous TSS data, 12,559 genes over-lapped (File S2). We estimated the proportion of genes whose interspecies differences in gene expression levels might be explained by corresponding differences in H3K4me3 pres-ence at TSS, using various thresholds of statistical significance to classify genes as differentially expressed. We performed this analysis for gene expression differences across all ranges and by restricting our analysis to gene expression levels within and across the range in which H3K4me3 also varies. We also performed this analysis using subsampled ChIPseq data in which equal numbers of sequencing reads across samples were used to classify H3K4me3-associated regions in each sample.
We examined enrichment of GO annotations (The Gene Ontology Consortium (Ashburneret al.2000), via the Web
tool GeneTrail (http://genetrail.bioinf.uni-sb.de/) (Backes
et al.2007)) for the genes whose interspecies differences in gene expression levels could potentially be explained by differences in H3K4me3, using differentially expressed genes between species with H3K4me3 presence in any species as a background. An FDR correction was applied to the resulting
P-values (Table S5,Table S6, andTable S7).
RESULTS
To investigate the relationship between changes in H3K4me3 status and differences in gene expression levels between humans and nonhuman primates, we collected gene expression data and identified genomic regions associated with the H3K4me3 modification in lymphoblastoid cell lines (LCLs) from humans, chim-panzees, and rhesus macaques.
Genome-wide profiles of H3K4me3: We used chro-matin immunoprecipitation followed by massively par-allel sequencing (ChIPseq) to identify genomic regions
associated with the H3K4me3 modification in LCLs from three individuals from each of the three species. Specifically, following ChIP with an antibody against H3K4me3, we sequenced enriched chromatin from each LCL with an Illumina Genome Analyzer II (GAII), using one lane of a flow cell per sample. As a control, we sequenced three pools of input chromatin, one from each species (seematerials and methods,File S1, and Figure S1 for a description of sample processing, the ChIPseq protocol, and examples of positive control regions).
We obtained, on average, 17.8m(60.7m) reads per sequenced lane (Table S3). We used MAQ (Li et al. 2008) to align the sequence reads to their respec-tive reference genomes (human, hg18; chimpanzee, panTro2; or rhesus macaque, rheMac2), filtered reads on the basis of mapping quality (see materials and methods), and used MACS (Zhang et al. 2008) to identify, in each sample, genomic regions with peaks of aligned sequencing reads, which correspond to regions associated with the H3K4me3 modification. To facilitate a comparison of H3K4me3 across species, we identified the orthologous sequences of all H3K4me3-associated regions in the genomes of human, chimpanzee, and rhesus macaque (initially, without applying an FDR cutoff; seematerials and methodsandFile S1).
To minimize the number of falsely identified in-terspecies differences, we applied two statistical cutoffs to classify genomic regions as associated with H3K4me3. Specifically, conditional on observing an H3K4me3-associated region with high confidence (namely, using a stringent cutoff) in one individual, we assumed that a H3K4me3 modification was more likely to occur in the same region in other individuals as well, and accordingly relaxed the statistical cutoff for the classification of such secondary observations (seematerials and methods, File S1, andFigure S2for more details). Essentially, we used information across samples to increase the power to detect H3K4me3 peaks in any sample. We then merged overlapping H3K4me3-associated genomic regions across individuals (regardless of species) to define boundaries for H3K4me3-associatedmetaregions. We per-formed this step to account for possible ambiguity in the classification of the exact boundaries of the peaks. For all subsequent analyses, we considered the H3K4me3-associated metaregions (which are referred to throughout as H3K4me3-associated regions). Using this approach, we classified 19,105 genomic regions as associated with H3K4me3 modification in at least one individual, with an average of 12,394 H3K4me3 peaks per individual, with relatively little variation across individuals or species (SEM¼188;Table S3).
H3K4me3 in any individual, 57.7% were associated with H3K4me3 in at least one individual from each of the three species (Figure S4). As expected, we observed a higher overlap between individuals from the same species (77.76 0.4%) than between individuals from different species (65.5 6 0.6%). Moreover, consistent with the known phylogeny of the three species, the overlap in H3K4me3-associated regions is higher be-tween human and chimpanzee individuals (69.5 6 0.3%) than between rhesus macaque and either human (63.9 6 0.4%) or chimpanzee individuals (63.2 6 0.3%). These properties of the data are robust with respect to a broad range of statistical cutoffs used to classify genomic regions as associated with H3K4me3 modification (Figure S3andFigure S4).
H3K4me3 near transcription start sites: We next in-vestigated whether the previously established (Santos -Rosaet al.2002; Schneideret al.2004; Schu¨ beleret al. 2004; Pokholok et al.2005) enrichment of H3K4me3 near TSS is observed in our data. To do so, we identified a set of TSS most likely to be orthologous across the three species (seematerials and methods). Indeed, we found that H3K4me3-associated regions are en-riched near annotated TSS in all three species (Figure 1). Our data also recapitulate the previously observed slight asymmetry in the distribution of H3K4me3 near TSS (e.g., Barskiet al.2007). On average, 61.261.5% of
all H3K4me3 peaks were found within 1 kb of a TSS, regardless of species. The enrichment of H3K4me3 near TSS is also robust with respect to a wide range of statistical cutoffs (Figure S5). The H3K4me3 modifica-tions within 1 kb of TSS are more likely to be conserved across species than those that are farther from TSS (Figure S3). These observations are consistent with a conserved role for H3K4me3 in mediating transcription initiation.
Our subsequent analyses focused on the subset of H3K4me3-associated regions that fall near TSS. Specif-ically, for each individual, we classified each TSS as either H3K4me31
or H3K4me3, on the basis of the
presence of H3K4me3 within 1 kb of the TSS. To further minimize falsely identified interspecies differences, we classified a TSS as H3K4me31
for the entire species whenever we detected H3K4me3 near the TSS in at least one individual.
We then proceeded to classify genes as H3K4me31
when at least one of their annotated TSS was H3K4me31,
on the basis of the criteria specified above. Using this approach, we classified 9026 of the 25,160 interro-gated orthologous genes as H3K4me31 in all three
species and 163, 209, and 339 genes as H3K4me31
only in humans, chimpanzees, or rhesus macaques, respec-tively (Figure 2).
Relationship between variation in gene expression levels and H3K4me3:To study interspecies differences in H3K4me3 in the context of gene expression differ-ences between species, we extracted and sequenced RNA from the same nine cell lines, using one lane of a GAII flow cell for each sample (see materials and methods and File S1 for a detailed description of sample processing and quality control analysis). We Figure1.—H3K4me3 modifications are enriched near TSS
in all three species. Plotted are histograms of the distance from the middle of H3K4me3-associated regions to the near-est TSS in (A) humans (B) chimpanzees, and (C) rhesus mac-aques. Only H3K4me3-associated regions within 2.5 kb of annotated TSS are shown(62.861.3% of the total number of regions).
Figure2.—Overlap of genes classified as H3K4me31across
species. A gene was considered H3K4me31
in a species when at least one individual had the histone modification. The
number of total H3K4me31
focused on sequence reads that mapped to a previously annotated set of 150,107 orthologous exons (from 20,689 genes) in the three species (Blekhman et al. 2010). At these orthologous exons, overall patterns of interspecies variation in gene expression levels re-capitulated the known phylogeny of the three species (Figure S7).
To identify genes whose expression levels differ between species, we analyzed the RNA sequencing data by using a Poisson mixed model including a fixed effect for each species and a random effect to account for variation between individuals from the same species (seeFile S1for more details). Using this approach, we classified 2199, 5420, and 5702 genes as differentially expressed between humans and chimpanzees, humans and rhesus macaques, and chimpanzees and rhesus macaques, respectively, at an FDR of 5%.
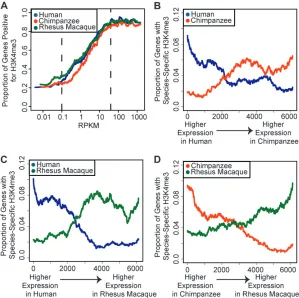
As observed previously (Santos-Rosa et al. 2002; Schneideret al.2004; Schu¨ beleret al.2004; Pokholok
et al.2005), highly expressed genes are more likely to have the H3K4me3 modification at their TSS. This pattern was particularly striking across the distribution of moderately expressed genes (Figure 3A). For highly and lowly expressed genes outside of this range, the proportion of H3K4me31
genes remains roughly constant.
We therefore examined the relationship between H3K4me3 and differences in gene expression levels between species, focusing specifically on the range of expression levels that were correlated with H3K4me3
presence at the TSS. Within and across this range, genes detected as differentially expressed between species were more likely to be classified as H3K4me31
in the species in which the gene was expressed at a higher level, and as H3K4me3in the species in which the gene
was expressed at a lower level (Figures 3, B–D; see Figure 4 for examples). This pattern provides strong evidence for a mechanism that relates interspecies differences in H3K4me3 status to differences in gene expression levels between species. Indeed, overall (across all expression ranges), genes whose expression levels, as well as their H3K4me3 status, differ across species were three to five times more likely to be classified as H3K4me31in the
species in which the gene was expressed at a higher level (sign testP,1014; Figure 5A andFigure S9).
We explored the extent to which interspecies differ-ences in gene expression levels might be explained, at least in part, by corresponding differences in H3K4me3 presence at the TSS. Because the results of such an analysis would differ on the basis of the choice of statistical cutoffs for the classification of genes as differentially expressed, we used a range of cutoffs. Importantly, more stringent statistical cutoffs resulted in higher estimates of the proportion of interspecies gene expression differences that can potentially be explained by differences in H3K4me3 status between the species (Figure 5B). Similarly, higher fold expres-sion level differences across species were also associated with a higher proportion of differences in H3K4me3 status (Figure S9). If we conservatively interpret the Figure3.—H3K4me3 modifications are
corre-lated with gene expression levels. (A) The
pro-portion of H3K4me31 genes is plotted for
sliding windows (n¼500) of genes ordered by increasing expression levels in human (blue), chimpanzee (red), and rhesus macaque (green). Expression level (x-axis) is plotted as reads per kilobase of mappable exon, per million mapped reads (RPKM). Dotted lines bracket the range of expression values for which H3K4me3 levels also varied. (B–D) The proportion of genes that are
H3K4me31
in one species but H3K4me3 in
the other is plotted for sliding windows (n ¼
1000) of genes ranked by the difference in ex-pression levels between (B) human and chim-panzee, (C) human and rhesus macaque, or (D) chimpanzee and rhesus macaque. For exam-ple, in B, data points in blue correspond to the proportion of genes that are H3K4me31in
hu-man but H3K4me3in chimpanzee, among the
overall genome-wide level of pairwise interspecies differ-ences in H3K4me3 status as background (with no functional significance), we estimate that for a range of typically used FDR cutoffs (1–10%), interspecies
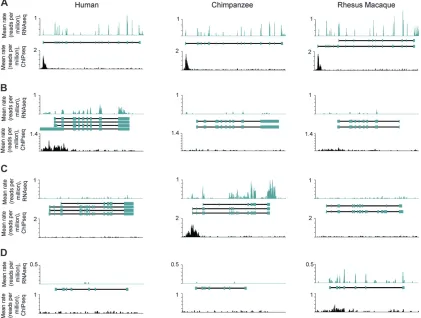
differences in H3K4me3 presence at TSS could explain as little as 2.4% (205/2978 at FDR ¼ 10%, with a background correction of 4.5%; Figure 5B) and as much as 6.8% (62/549 at FDR ¼ 1%, with the same Figure4.—Examples of patterns of H3K4me3 peaks and gene expression levels across species. In each plot, thex-axis is distance
along a genomic region containing a gene. The relative locations of Ensembl annotated exons are shown as blue boxes in the middle, with TSS to the left. They-axes are the species-averaged rates at which each base was sequenced, scaled by a factor of 106, for H3K4me3 ChIPseq (top plots within each panel), and RNAseq (bottom plots within each panel) data from human (left), chimpanzee (middle), and rhesus macaque (right) samples. Shown are examples of (A) no difference in gene expression levels and no difference in H3K4me3 marks across species (RBM28), (B) species-specific higher gene expression level and lineage-specific H3K4me3 mark in human (ELF3), (C) chimpanzee (SSH3L), or (D) rhesus macaque (LCN15).
Figure5.—The association between
background correction) of gene expression differences between human and chimpanzee. Similarly, we estimate that interspecies differences in H3K4me3 could explain from 1.8% (411/5403 with a background correction of 5.8%) to 3.8% (251/2616) of gene expression differ-ences between human and rhesus macaque, and from 1.4% (402/6004 with a background correction of 5.3%) to 3.0% (243/2933) of gene expression differences between chimpanzee and rhesus macaque (Figure 5B and seeFigure S9for a similar analysis using only genes whose expression levels fall within or across the range where H3K4me3 also varies).
We further classified differences in H3K4me3 status between humans and chimpanzees as ancestral or derived in each lineage, on the basis of the assumption that the H3K4me3 status of rhesus macaques repre-sents the ancestral state. Interestingly, we found that when differences in gene expression levels between humans and chimpanzees could be explained by corresponding interspecies differences in H3K4me3 status, we could often predict, on the basis of the ancestral H3K4me3 status, the relative gene expres-sion levels in rhesus macaques (for example, in 121/ 146 or 83% of cases, when interspecies gene expres-sion differences were classified at FDR,0.05; sign test P,1015).
Analysis of functional enrichments:We examined the functional annotations (based on Gene Ontology; Ashburneret al.2000) of the genes whose interspecies differences in gene expression levels could potentially be explained by differences in H3K4me3 status (com-pared to a background of differentially expressed genes between species, which are associated with H3K4me3 in any of the species). Among notable observations (see Table S5,Table S6, and Table S7for complete lists of results), we found enrichments of genes involved in developmental processes (FDR , 104) and genes related to the plasma membrane (FDR,106), among genes that were differentially expressed, possibly due to changes in H3K4me3 status, in all three pairwise species comparisons. Among genes whose regulation is inferred to be affected by interspecies changes in H3K4me3 we also found a significant enrichment of genes encoding for proteins with receptor activity (FDR , 0.002) and system development (FDR,103). These results were consistent regardless of the species pairwise compar-isons we made, indicating that common biological functions may be regulated by changes to epigenetic mechanism in primates. These observations are inter-esting in light of the established role of epigenetic markers in development in general (Kouzarides2007) and specifically in B cell development (Busslinger 2004), and the importance of lymphocyte membrane-bound receptors in immune function (Alberts et al. 2002), a phenotype on which there has been strong selective pressures in primates (Barreiroand Quintana -Murci2010).
DISCUSSION
Comparative studies of regulatory mechanisms in primates are challenging because of the practical and ethical constraints on genetic experimentation in apes and because of the limited availability of tissue samples (especially from chimpanzees). The difficulty in obtain-ing primate tissue samples often renders comparative studies somewhat difficult to interpret, for example because the cellular composition cannot be controlled across samples from different species (Blekhmanet al. 2008, 2009). Here, we chose to work with LCLs, an abundant source of material, which allows us to work on the same cell type in all three primate species.
The usefulness of LCLs for studies of gene regulatory mechanisms has been strongly established. Indeed, nearly all genome-wide surveys of functional regulatory variation in humans have been conducted in LCLs. Cell lines offer convenience and replicability and are often the only resource available for functional studies in humans and nonhuman apes. However, while conve-nient, work with LCLs is often criticized because the Epstein–Barr virus transformation is associated with a number of specific artifacts. For example, cell lines often carry chromosomal abnormalities (Redon et al. 2006), have certain altered patterns of gene expression and DNA methylation (Hannulaet al. 2001; Carter
et al. 2002), and may have batch effects related to preparation and/or growth rates (Akey et al. 2007; Choy et al.2008), which could be more pronounced for LCLs from different species.
Reassuringly, recent observations indicate that func-tional studies in cell lines uncover a substantial amount of genetic variation that affects gene expression levels in primary tissues. Studies in LCLs have resulted in numer-ous important insights into mechanisms of gene regula-tion (Monkset al.2004; Morleyet al.2004; Cheunget al. 2005; Stranger et al. 2005, 2007; Dixon et al. 2007; Frazeret al.2007; Moffattet al.2007; Veyrieraset al. 2008; Geet al.2009). In addition, regulatory architecture found in LCLs is often replicated in primary tissues (Bullaugheyet al.2009; Dimaset al.2009; Verlaanet al. 2009; Zeller et al. 2010), with the most recent study estimating that70% ofcisexpression quantitative trait loci (eQTL) identified in LCLs can be replicated in primary skin tissue (Dinget al.2010).
while LCLs are not a perfect model for comparative studies of gene regulatory mechanisms, on balance, cell lines are a useful system (and at times, the only available system) for such studies.
Interspecies differences in H3K4me3: In our com-parative study of primate LCLs, we found an enrichment of H3K4me3 near TSS in all three species, consistent with previous observations in more distantly related species,e.g., in mouse (Bernsteinet al.2005), chicken (Schneideret al. 2004), Drosophila (Schu¨ beleret al. 2004), Arabidopsis (Zhang et al. 2009), and yeast (Santos-Rosaet al. 2002; Pokholoket al. 2005). This remarkably conserved pattern strongly implies that the functional mechanism by which H3K4me3 relates to gene regulation (Liet al.2006; Wysockaet al. 2006) is shared across species. We further observed that the relationship between H3K4me3 and gene expression is strongest for moderate expression levels. This property of the data suggests that H3K4me3 may play an important role in promoting transcription initiation to moderate levels, while other mechanisms (for example, binding of enhancer or repressor elements) are likely required to achieve finer regulation. Interestingly, consistent with previous reports (Bernstein et al. 2005; Wilson et al. 2008), we found no correlation between interspecies differences in H3K4me3 status and sequence divergence at the corresponding genomic regions, either proximal or distal to TSS (Figure S10).
Overall, we estimated that up to 7% (10% if we restrict our analysis to the informative expression level range, Figure S9) of interspecies differences in gene expres-sion levels might be explained, at least in part, by differences in H3K4me3 status across species. We note that the inference of causality relies exclusively on the previously proposed mechanism by which H3K4me3 promotes accessible chromatin and facilitates active transcription (Nishioka et al. 2002; Li et al. 2006; Wysockaet al.2006; Ruthenburget al.2007).
That said, the notion that corresponding interspecies differences in H3K4me3 status and gene expression levels are causally related is supported by our data. Indeed, we observed that interspecies differences in H3K4me3 status can be used to predict gene expression differences between species more effectively than the converse (Figure 5A and Figure S9). In addition, we found that lineage-specific gains or loses of H3K4me3 are associated with lineage-specific changes in gene expression levels much more often than expected by chance alone.
Robustness of the results with respect to the classification approach:We classified a gene as positive for H3K4me3 in each species when at least one in-dividual of that species was positive for H3K4me3. This approach was motivated by the choice of a highly stringent criterion with which we classified genomic regions as associated with H3K4me3, as well as by the understanding that ChIPseq is inherently a low-power
technique, such that false negatives (but not false positives) are expected to be frequent. Nevertheless, we are unable to exclude the possibility that the observed within-species variation in H3K4me3 modifi-cations reflects polymorphisms rather than false neg-atives or positives. It is important, therefore, to ensure that our conclusions are robust with respect to the choice of how to classify a ‘‘species’’ trait.
To do so, we reanalyzed the data by (1) classifying a species’ H3K4me3 status at each genomic region by a ‘‘majority rule,’’ and (2) by only considering H3K4me3-associated regions for which all three individuals within each species agree with respect to their H3K4me3 status. The application of the first approach resulted in the exclusion of 3670 (19%) of the regions that were classified as H3K4me31in the original analysis,
suggest-ing that typically, sites were classified as H3K4me31in
more than one individual per species. Of the remaining 15,435 H3K4me31
regions, 59% were shared across all three species (compared with 58% in the original analysis; Figure S4). The percentage of genes with significant interspecies differences in expression levels (at FDR of 1–10%) that also shows corresponding differences in H3K4me3 status (in the expected di-rection) is slightly higher than that observed in the original analysis (Figure S9; for comparisons between humans and chimpanzees, 3.1–7.3%; humans and rhesus macaques, 2.4–4.6%; and chimpanzees and rhesus macaques, 1.5–3.9%).
In turn, the application of the second approach resulted in the exclusions of more than half (56%) the regions that were classified as H3K4me31in the original
analysis. This is a very strict classification approach, which reflects the unlikely possibility that the false positive rates associated with our ChIPseq experiment are very high and the false negative rates extremely low. Naturally, since we exclude any region in which all three individuals of a species do not agree, the remaining H3K4me3-associated regions showed a higher overlap between species com-pared with the original analysis. Specifically, 8442 regions were classified as positive for H3K4me3 in all three individuals of any species, of which 81% were shared across all three species (Figure S4). Importantly, however, the percentage of genes with significant interspecies differences in expression levels that also show corre-sponding differences in H3K4me3 status is similar to that observed in the original analysis (Figure S9; for compar-isons between humans and chimpanzees, 1.6–4.6%; humans and rhesus macaques, 1.2–2.8%; and chimpan-zees and rhesus macaques, 0.9–1.9%).
Our original analysis, therefore, is generally conserva-tive with respect to the estimates of the proportion of interspecies gene expression differences that might be explained by corresponding differences in H3K4me3 between the species. More generally, our qualitative results are robust with respect to the specific choice on how to classify a gene as H3K4me31
SUMMARY
Our results suggest that changes in H3K4me3 likely contribute modestly to differences in gene expression levels between primates. We confirmed that these qualitative results of our comparative genomic study do not rely on specific arbitrary choices of statistical cutoffs (Figure S3, Figure S4, Figure S5, Figure S6, Figure S8, Figure S9, and Figure S10). That said, it is reasonable to assume that we are somewhat under-estimating the number of interspecies differences in H3K4me3 status, because we consistently chose ap-proaches that will minimize falsely identified differ-ences between species. In addition, it is important to note that while we can identify large interspecies differ-ences in H3K4me3 status using our data (effectively, focusing on qualitative differences), we would need higher quality data (higher than most ChIPseq datasets to date) to infer more subtle quantitative differences.
Our study joins similar efforts (Odom et al. 2007; Wilsonet al.2008; McManuset al.2010) in taking first steps toward understanding the basis for gene expres-sion differences between species. By collecting compar-ative data on other regulatory mechanisms, as well as by extending our analysis to consider quantitative inter-species differences in dynamic regulatory interactions, we hope to ultimately develop a better understanding of the relative contributions of the different mechanisms to regulatory differences across primates.
We thank L. Barreiro and all members of the Gilad lab for discussions and/or for comments on the manuscript. We thank the New England Primate Research Center and the New Iberia Research Center (University of Louisiana at Lafayette) for the primate LCLs. The University of Louisiana at Lafayette New Iberia Research Center is funded by National Institutes of Health/National Center for Research Resources (NIH/NCRR) grants RR015087, RR014491, and RR016483, and the Genetics Core of the New England Primate Research Center by NIH/NCRR grant RR00168. This work was supported by National Institute of General Medical Sciences grant GM084996 to Y.G.
LITERATURE CITED
Akey, J. M., S. Biswas, J. T. Leekand J. D. Storey, 2007 On the
de-sign and analysis of gene expression studies in human popula-tions. Nat. Genet.39:807–808, author reply 808–809.
Alberts, B., A. Johnson, J. Lewis, M. Raff, K. Roberts et al.,
2002 Molecular Biology of the Cell.Garland Science, New York. Ashburner, M., C. A. Ball, J. A. Blake, D. Botstein, H. Butler
et al., 2000 Gene ontology: tool for the unification of biology. The Gene Ontology Consortium. Nat. Genet.25:25–29. Babbitt, C. C., O. Fedrigo, A. D. Pfefferle, A. P. Boyle, J. E. Horvath
et al., 2010a Both noncoding and protein-coding RNAs contribute to gene expression evolution in the primate brain. Genome Biol. Evol.2:67–79.
Babbitt, C. C., J. S. Silverman, R. Haygood, J. M. Reininga, M. V.
Rockmanet al., 2010b Multiple functional variants in cis
mod-ulate PDYN expression. Mol. Biol. Evol.27:465–479.
Backes, C., A. Keller, J. Kuentzer, B. Kneissl, N. Comtesseet al.,
2007 GeneTrail–advanced gene set enrichment analysis. Nu-cleic Acids Res.35:W186–W192.
Barreiro, L. B., and L. Quintana-Murci, 2010 From evolutionary
genetics to human immunology: how selection shapes host de-fence genes. Nat. Rev. Genet.11:17–30.
Barski, A., S. Cuddapah, K. Cui, T. Y. Roh, D. E. Schoneset al.,
2007 High-resolution profiling of histone methylations in the human genome. Cell129:823–837.
Bernstein, B. E., M. Kamal, K. Lindblad-Toh, S. Bekiranov, D. K.
Baileyet al., 2005 Genomic maps and comparative analysis of
histone modifications in human and mouse. Cell120:169–181. Blekhman, R., A. Oshlack, A. E. Chabot, G. K. Smythand Y. Gilad,
2008 Gene regulation in primates evolves under tissue-specific selection pressures. PLoS Genet.4:e1000271.
Blekhman, R., A. Oshlackand Y. Gilad, 2009 Segmental
duplica-tions contribute to gene expression differences between humans and chimpanzees. Genetics182:627–630.
Blekhman, R., J. Marioni, P. Zumbo, M. Stephensand Y. Gilad,
2010 Sex-specific and lineage-specific alternative splicing in primates. Genome Res.20:180–189.
Bullaughey, K., C. I. Chavarria, G. Coop and Y. Gilad,
2009 Expression quantitative trait loci detected in cell lines are often present in primary tissues. Hum. Mol. Genet. 18: 4296–4303.
Busslinger, M., 2004 Transcriptional control of early B cell
devel-opment. Annu. Rev. Immunol.22:55–79.
Ca´ ceres, M., J. Lachuer, M. A. Zapala, J. C. Redmond, L. Kudoet al.,
2003 Elevated gene expression levels distinguish human from non-human primate brains. Proc. Natl. Acad. Sci. USA 100: 13030–13035.
Carter, K. L., E. Cahir-McFarland and E. Kieff, 2002
Epstein-Barr virus-induced changes in B-lymphocyte gene expression. J. Virol.76:10427–10436.
Chabot, A., R. A. Shrit, R. Blekhmanand Y. Gilad, 2007 Using
reporter gene assays to identifycisregulatory differences between humans and chimpanzees. Genetics176:2069–2076.
Cheung, V. G., R. S. Spielman, K. G. Ewens, T. M. Weber, M. Morley
et al., 2005 Mapping determinants of human gene expression by regional and genome-wide association. Nature 437: 1365– 1369.
Choy, E., R. Yelensky, S. Bonakdar, R. M. Plenge, R. Saxenaet al.,
2008 Genetic analysis of human traits in vitro: drug response and gene expression in lymphoblastoid cell lines. PLoS Genet. 4:e1000287.
Dimas, A. S., S. Deutsch, B. E. Stranger, S. B. Montgomery, C.
Borelet al., 2009 Common regulatory variation impacts gene
expression in a cell type-dependent manner. Science 325: 1246–1250.
Ding, J., J. E. Gudjonsson, L. Liang, P. E. Stuart, Y. Li et al.,
2010 Gene expression in skin and lymphoblastoid cells: refined statistical method reveals extensive overlap in cis-eQTL signals. Am. J. Hum. Genet.87:779–789.
Dixon, A. L., L. Liang, M. F. Moffatt, W. Chen, S. Heathet al.,
2007 A genome-wide association study of global gene expres-sion. Nat. Genet.39:1202–1207.
Enard, W., P. Khaitovich, J. Klose, S. Zollner, F. Heissiget al.,
2002 Intra- and interspecific variation in primate gene expres-sion patterns. Science296:340–343.
Enard, W., A. Fassbender, F. Model, P. Adorjan, S. Paaboet al.,
2004 Differences in DNA methylation patterns between hu-mans and chimpanzees. Curr. Biol.14:R148–R149.
Farcas, R., E. Schneider, K. Frauenknecht, I. Kondova, R. Bontrop
et al., 2009 Differences in DNA methylation patterns and expres-sion of the CCRK gene in human and nonhuman primate cortices. Mol. Biol. Evol.26:1379–1389.
Frazer, K. A., D. G. Ballinger, D. R. Cox, D. A. Hinds, L. L. Stuve
et al., 2007 A second generation human haplotype map of over 3.1 million SNPs. Nature449:851–861.
Gama-Sosa, M. A., R. M. Midgett, V. A. Slagel, S. Githens, K. C.
Kuoet al., 1983 Tissue-specific differences in DNA methylation
in various mammals. Biochim. Biophys. Acta740:212–219. Ge, B., D. K. Pokholok, T. Kwan, E. Grundberg, L. Morcoset al.,
2009 Global patterns of cis variation in human cells revealed by high-density allelic expression analysis. Nat. Genet.41:1216–1222. Gerber, M., and A. Shilatifard, 2003 Transcriptional elongation
by RNA polymerase II and histone methylation. J. Biol. Chem. 278:26303–26306.
Gilad, Y., A. Oshlack, G. K. Smyth, T. P. Speedand K. P. White,
Hampsey, M., and D. Reinberg, 2003 Tails of intrigue:
phosphory-lation of RNA polymerase II mediates histone methyphosphory-lation. Cell 113:429–432.
Hannula, K., M. Lipsanen-Nyman, S. W. Scherer, C. Holmberg,
P. Hoglundet al., 2001 Maternal and paternal chromosomes
7 show differential methylation of many genes in lymphoblast DNA. Genomics73:1–9.
Heintzman, N. D., R. K. Stuart, G. Hon, Y. Fu, C. W. Chinget al.,
2007 Distinct and predictive chromatin signatures of transcrip-tional promoters and enhancers in the human genome. Nat. Genet.39:311–318.
Karaman, M. W., M. L. Houck, L. G. Chemnick, S. Nagpal,
D. Chawannakulet al., 2003 Comparative analysis of
gene-expression patterns in human and African great ape cultured fibroblasts. Genome Res.13:1619–1630.
Karlic, R., H. R. Chung, J. Lasserre, K. Vlahovicekand M. Vingron,
2010 Histone modification levels are predictive for gene expres-sion. Proc. Natl. Acad. Sci. USA107:2926–2931.
Khaitovich, P., B. Muetzel, X. She, M. Lachmann, I. Hellmann
et al., 2004 Regional patterns of gene expression in human and chimpanzee brains. Genome Res.14:1462–1473.
Khaitovich, P., I. Hellmann, W. Enard, K. Nowick, M. Leinweber
et al., 2005 Parallel patterns of evolution in the genomes and transcriptomes of humans and chimpanzees. Science 309: 1850–1854.
Khaitovich, P., W. Enard, M. Lachmann and S. Paabo,
2006 Evolution of primate gene expression. Nat. Rev. Genet. 7:693–702.
Kouzarides, T., 2007 Chromatin modifications and their function.
Cell128:693–705.
Li, H., S. Ilin, W. Wang, E. M. Duncan, J. Wysocka et al.,
2006 Molecular basis for site-specific read-out of histone H3K4me3 by the BPTF PHD finger of NURF. Nature442:91–95. Li, H., J. Ruanand R. Durbin, 2008 Mapping short DNA
sequenc-ing reads and callsequenc-ing variants ussequenc-ing mappsequenc-ing quality scores. Genome Res.18:1851–1858.
Loisel, D. A., M. V. Rockman, G. A. Wray, J. Altmannand S. C.
Alberts, 2006 Ancient polymorphism and functional variation
in the primate MHC-DQA1 59cis-regulatory region. Proc. Natl. Acad. Sci. USA103:16331–16336.
Marioni, J. C., C. E. Mason, S. M. Mane, M. Stephensand Y. Gilad,
2008 RNA-seq: an assessment of technical reproducibility and comparison with gene expression arrays. Genome Res. 18: 1509–1517.
McManus, C. J., J. D. Coolon, M. O. Duff, J. Eipper-Mains, B. R.
Graveleyet al., 2010 Regulatory divergence in Drosophila
re-vealed by mRNA-seq. Genome Res.20:816–825.
Moffatt, M. F., M. Kabesch, L. Liang, A. L. Dixon, D. Strachan
et al., 2007 Genetic variants regulating ORMDL3 expression contribute to the risk of childhood asthma. Nature448:470–473. Monks, S. A., A. Leonardson, H. Zhu, P. Cundiff, P. Pietrusiak
et al., 2004 Genetic inheritance of gene expression in human cell lines. Am. J. Hum. Genet.75:1094–1105.
Morley, M., C. M. Molony, T. M. Weber, J. L. Devlin, K. G. Ewens
et al., 2004 Genetic analysis of genome-wide variation in human gene expression. Nature430:743–747.
Ng, H. H., F. Robert, R. A. Youngand K. Struhl, 2003 Targeted
recruitment of Set1 histone methylase by elongating Pol II pro-vides a localized mark and memory of recent transcriptional ac-tivity. Mol. Cell11:709–719.
Nishioka, K., S. Chuikov, K. Sarma, H. Erdjument-Bromage, C. D.
Alliset al., 2002 Set9, a novel histone H3 methyltransferase
that facilitates transcription by precluding histone tail modifica-tions required for heterochromatin formation. Genes Dev.16: 479–489.
Nislow, C., E. Rayand L. Pillus, 1997 A yeast member of the
tri-thorax family, functions in transcriptional silencing and diverse cellular processes. Mol. Biol. Cell8:2421–2436.
Odom, D. T., R. D. Dowell, E. S. Jacobsen, W. Gordon, T. W.
Danfordet al., 2007 Tissue-specific transcriptional regulation
has diverged significantly between human and mouse. Nat. Genet.39:730–732.
Pokholok, D. K., C. T. Harbison, S. Levine, M. Cole, N. M.
Hannettet al., 2005 Genome-wide map of nucleosome
acety-lation and methyacety-lation in yeast. Cell122:517–527.
Pollard, K. S., S. R. Salama, N. Lambert, M. A. Lambot, S. Coppens
et al., 2006 An RNA gene expressed during cortical develop-ment evolved rapidly in humans. Nature443:167–172. Prabhakar, S., A. Visel, J. A. Akiyama, M. Shoukry, K. D. Lewis
et al., 2008 Human-specific gain of function in a developmental enhancer. Science321:1346–1350.
Redon, R., S. Ishikawa, K. R. Fitch, L. Feuk, G. H. Perryet al.,
2006 Global variation in copy number in the human genome. Nature444:444–454.
Rockman, M. V., M. W. Hahn, N. Soranzo, F. Zimprich, D. B.
Goldsteinet al., 2005 Ancient and recent positive selection
transformed opioid cis-regulation in humans. PLoS Biol. 3: e387.
Roh, T. Y., G. Wei, C. M. Farrelland K. Zhao, 2007 Genome-wide
prediction of conserved and nonconserved enhancers by histone acetylation patterns. Genome Res.17:74–81.
Ruthenburg, A. J., C. D. Allisand J. Wysocka, 2007 Methylation
of lysine 4 on histone H3: intricacy of writing and reading a single epigenetic mark. Mol. Cell25:15–30.
Santos-Rosa, H., R. Schneider, A. J. Bannister, J. Sherriff, B. E.
Bernstein et al., 2002 Active genes are tri-methylated at K4
of histone H3. Nature419:407–411.
Schneider, R., A. J. Bannister, F. A. Myers, A. W. Thorne, C.
Crane-Robinsonet al., 2004 Histone H3 lysine 4 methylation
patterns in higher eukaryotic genes. Nat. Cell Biol.6:73–77. Schu¨ beler, D., D. M. MacAlpine, D. Scalzo, C. Wirbelauer, C.
Kooperberget al., 2004 The histone modification pattern of
active genes revealed through genome-wide chromatin analysis of a higher eukaryote. Genes Dev.18:1263–1271.
Stranger, B. E., M. S. Forrest, A. G. Clark, M. J. Minichiello,
S. Deutschet al., 2005 Genome-wide associations of gene
ex-pression variation in humans. PLoS Genet.1:e78.
Stranger, B. E., A. C. Nica, M. S. Forrest, A. Dimas, C. P. Birdet al.,
2007 Population genomics of human gene expression. Nat. Genet.39:1217–1224.
Verlaan, D. J., B. Ge, E. Grundberg, R. Hoberman, K. C. Lamet al.,
2009 Targeted screening of cis-regulatory variation in human haplotypes. Genome Res.19:118–127.
Veyrieras, J. B., S. Kudaravalli, S. Y. Kim, E. T. Dermitzakis,
Y. Giladet al., 2008 High-resolution mapping of
expression-QTLs yields insight into human gene regulation. PLoS Genet. 4:e1000214.
Wang, P., C. Lin, E. R. Smith, H. Guo, B. W. Sanderson et al.,
2009 Global analysis of H3K4 methylation defines MLL family member targets and points to a role for MLL1-mediated H3K4 methylation in the regulation of transcriptional initiation by RNA polymerase II. Mol. Cell. Biol.29:6074–6085.
Warner, L. R., C. C. Babbitt, A. E. Primus, T. F. Severson,
R. Haygoodet al., 2009 Functional consequences of genetic
variation in primates on tyrosine hydroxylase (TH) expression in vitro. Brain Res.1288:1–8.
Wilson, M. D., N. L. Barbosa-Morais, D. Schmidt, C. M. Conboy,
L. Vaneset al., 2008 Species-specific transcription in mice
car-rying human chromosome 21. Science322:434–438.
Wysocka, J., T. Swigut, H. Xiao, T. A. Milne, S. Y. Kwonet al.,
2006 A PHD finger of NURF couples histone H3 lysine 4 trime-thylation with chromatin remodelling. Nature442:86–90. Zegerman, P., B. Canas, D. Pappin and T. Kouzarides,
2002 Histone H3 lysine 4 methylation disrupts binding of nu-cleosome remodeling and deacetylase (NuRD) repressor com-plex. J. Biol. Chem.277:11621–11624.
Zeller, T., P. Wild, S. Szymczak, M. Rotival, A. Schillertet al.,
2010 Genetics and beyond–the transcriptome of human mono-cytes and disease susceptibility. PLoS One5:e10693.
Zhang, X., Y. V. Bernatavichute, S. Cokus, M. Pellegriniand S. E.
Jacobsen, 2009 Genome-wide analysis of mono-, di- and
trime-thylation of histone H3 lysine 4 in Arabidopsis thaliana. Genome Biol.10:R62.
Zhang, Y., T. Liu, C. A. Meyer, J. Eeckhoute, D. S. Johnsonet al.,
2008 Model-based analysis of ChIP-Seq (MACS). Genome Biol. 9:R137.