Power Quality Improvement of Fuel Cell
Integrated With Grid System
Sunil Toppo 1, Dr. Jyoti shrivastava2
PG Student, Department of Electrical Engineering, SHIATS-DU Naini, Allahabad, India1
Assistant Professor, Department of Electrical Engineering, SHIATS-Deemed University, Allahabad India.2
ABSTRACT:-This paper discusses some crucial energetic, environmental and sustainability issues and the role of fuel cell. The fuel cells are none but they are a no-conventional energy resource which enhances the overload capabilities of existing power system and makes old power system comparatively efficient technologies as one of the potential solutions to these issues. The commercialization plans in various industrialized countries for these technologies have started by identifying the most likely early markets for fuel cells as power producing devices from micro- to macro-applications, and set realistic near-term and mid-term goals for selected market penetration. The plans outline the major barriers to achieving those goals. This paper proposes a simulink model of integrated system. These systems are fuel cell and conventional generating station. The performance of integrated system improved by using the FACTS devices.
KEYWORDS: Fuel Cell,STATCOM, Energy, Integrated System .
I.INTRODUCTION
isolated from the main grid, in case of faults in the upstream network. Thus, Microgrids can provide network support in times of stress by relieving congestions and aiding restoration after faults. From the customer point of view, Microgrids provide thermal and electricity needs, and in addition enhance reliability, reduce emissions, improve power quality by supporting voltage and reducing voltage dips, and potentially lower costs of energy supply.
II. FUELCELL
Although fuel cells have been around since 1839, it took 120 years until NASA demonstrated some of their potential applications in providing power during space flight. As a result of these successes, in the 1960s, industry began to recognize the commercial potential of fuel cells, but encountered technical barriers and high investment costs— fuel cells were not economically competitive with existing energy technologies. Since 1984, the Office of Transportation Technologies at the U.S. Department of Energy has been supporting research and development of fuel cell technology , and as a result, hundreds of Companies around the world are now working towards making fuel cell technology pay off. Just as in the commercialization of the electric light bulb nearly one hundred years ago, today’s companies are being driven by technical, economic, and social forces such as high performance characteristics, reliability, durability, low cost, and environmental benefits.
Fig.1Clean Energy Patent Growth Index
A fuel cell is like a battery in that it generates electricity from an electrochemical reaction. Both batteries and fuel cells convert chemical energy into electrical energy and also, as a by-product of this process, into heat. However, a battery holds a closed store of energy within it and once this is depleted the battery must be discarded, or recharged by using an external supply of electricity to drive the electrochemical reaction in the reverse direction.
Fig.2 Fuel Cell Patents Geographic Distribution 2002-2012
III. CIRCUIT DESCRIPTION FUELCELL
The system consists of a SOFC which is connected to a three-phase infinite bus through an IGBT inverter. The inverter uses hysteresis switching and controls active power by manipulation of direct-axis current while holding reactive power at 0VAr.The three phase output of inverter is fed to the existing power system to develop a grid.
A Distribution Static Synchronous Compensator (D-STATCOM) is used to regulate voltage on a 25-kV distribution network. Two feeders (21 km and 2 km) transmit power to loads connected at buses B2 and B3. A shunt capacitor is used for power factor correction at bus B2. The 600-V load connected to bus B3 through a 25kV/600V transformer represents a plant absorbing continuously changing currents, similar to an arc furnace, thus producing voltage flicker. The variable load current magnitude is modulated at a frequency of 5 Hz so that its apparent power varies approximately between 1 MVA and 5.2 MVA, while keeping a 0.9 lagging power factor. This load variation will allow you to observe the ability of the D-STATCOM to mitigate voltage flicker.
The D-STATCOM regulates bus B3 voltage by absorbing or generating reactive power. This reactive power transfer is done through the leakage reactance of the coupling transformer by generating a secondary voltage in phase with the primary voltage (network side). This voltage is provided by a voltage-sourced PWM inverter. When the secondary voltage is lower than the bus voltage, the D-STATCOM acts like an inductance absorbing reactive power. When the secondary voltage is higher than the bus voltage, the D-STATCOM acts like a capacitor generating reactive power.
The D-STATCOM consists of the following components:
a 25kV/1.25kV coupling transformer which ensures coupling between the PWM inverter and the network. a voltage-sourced PWM inverter consisting of two IGBT bridges. This twin inverter configuration produces fewer harmonic than a single bridge, resulting in smaller filters and improved dynamic response. In this case, the inverter modulation frequency is 28*60=1.68 kHz so that the first harmonics will be around 3.36 kHz. LC damped filters connected at the inverter output. Resistances connected in series with capacitors provide a quality factor of 40 at 60 Hz. a 10000-microfarad capacitor acting as a DC voltage source for the inverter a voltage regulator that controls voltage at bus B3 a PWM pulse generator using a modulation frequency of 1.68 kHz anti-aliasing filters used for voltage and current acquisition.
The D-STATCOM controller consists of several functional blocks:
a Phase Locked Loop (PLL). The PLL is synchronized to the fundamental of the transformer primary voltages. two measurement systems. Vmeas and Imeas blocks compute the d-axis and q-axis components of the voltages and currents by executing an abc-dq transformation in the synchronous reference determined by sin(wt) and cos(wt) provided by the PLL.
an inner current regulation loop. This loop consists of two proportional-integral (PI) controllers that control the d-axis and q-axis currents. The controllers outputs are the Vd and Vq voltages that the PWM inverter has to generate. The Vd and Vq voltages are converted into phase voltages Va, Vb, Vc which are used to synthesize the PWM voltages.
The Iq reference comes from the outer voltage regulation loop (in automatic mode) or from a reference imposed by Qref (in manual mode). The Id reference comes from the DC-link voltage regulator. an outer voltage regulation loop.
In automatic mode (regulated voltage), a PI controller maintains the primary voltage equal to the reference value defined in the control system dialog box. a DC voltage controller which keeps the DC link voltage constant to its nominal value (Vdc=2.4 kV).
= 1 2
Where V1 and V2 = Line to Line voltage
X= reactance of interconnection transformer and filters.
= 1 ℎ 2
In steady state operation, the voltage V2 generated by the VSC is in phase with V1 (δ=0), so that only reactive power is flowing (P=0). If V2 is lower than V1, Q is flowing from V1 to V2 (STATCOM is absorbing reactive power). On the reverse, if V2 is higher than V1, Q is flowing from V2 to V1 (STATCOM is generating reactive power). The amount of reactive power is given by
= 1( 1− 2)
A capacitor connected on the DC side of the VSC acts as a DC voltage source. In steady state the voltage V2 has to be phase shifted slightly behind V1 in order to compensate for transformer and VSC losses and to keep the capacitor charged.
IV. BLOCK DIAGRAM OF STANDALONE SYSTEM
Fig.4 block diagram of fuel cell
There are many types of fuel cells, but they all consist of an anode, a cathode and an electrolyte that allows charges to move between the two sides of the fuel cell. Electrons are drawn from the anode to the cathode through an external circuit, producing direct current electricity. As the main difference among fuel cell types is the electrolyte, fuel cells are classified by the type of electrolyte they use followed by the difference in startup time ranging from 1 second for proton exchange membrane fuel cells (PEM fuel cells, or PEMFC) to 10 minutes for solid oxide fuel cells (SOFC).
V. RESULT AND DISCUSSION
Fig.5 fuel cell three phase output voltage
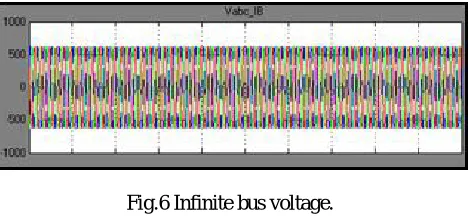
Figure 6 shows the infinite bus voltage. The fuel cell generating plant is integrated with conventional power grid system.
Fig.6 Infinite bus voltage.
The figure 7 shows fully regulated and compensated output at load end from figre it is concluded power qulity improved.
Fig.7Load side three phase AC voltage.
The above waveform represents three phase ac voltage waveform at the consumer end. It is the final output of integrated system which consists of fuel cell and convention a power plant. The power quality is improved by using D-statcom.
By using D-STATCOM the THD is reduced 76% and we get a regulated output.
VI. CONCLUSION
from above results it can be concluded that a fuel cell and conventional generating station can be integrated successfully and the performance and power quality can be improved by using FACT device like D-STATCOM.
REFERENCES
1. T.Veziroglu, “Hydrogen Energy System: A Permanent Solution to Global Problems”, Clean Energy Research Institute, USA, 2004.
2. D.Mayer, R.Metkemeijer, S. Busquet, P.Caselitz, J.Bard, and et al, Photovoltaic/Electrolyser/fuel cell hybrid system the Tomorrow Power Station for Remote Areas, 17th EPVSEC, Munich Germany, pp.2529-2530, 2001.
4. A.R.Balkin, “Modelling A 500W Polymer Electrolyzer Membrane Fuel Cell”, Bs.D, University of Technology, Facaulty of Engineering, Sydney, 2002.
5. F.Barbir, T.Gomez, “Efficiency and Economics of Proton Exchange Membrane (PEM) Fuel Cells”, Int. J. Hydrogen Energy, Vol.22, No.10/11, pp.1027-1037, 1997.
6. [6] G.Hoogers, Fuel Cell Technology handbook, CRC Press LLC, 2003.
7. ASME 8th International Fuel Cell Science, Engineering & Technology Conference, 2010.
8. S.Busquet, R.Metkemeyer and D.Mayer: “Development of a Clean Stand-alone Power System Integrating PV, Fuel Cell and Electrolyser”, Proc. Of the Photovoltaic Hybrid Power Systems Conference, Aix en Provence, 2000.