DOI: 10.1534/genetics.107.074518
Meta-analysis of Polyploid Cotton QTL Shows Unequal Contributions
of Subgenomes to a Complex Network of Genes and Gene
Clusters Implicated in Lint Fiber Development
Junkang Rong,* F. Alex Feltus,* Vijay N. Waghmare,
†Gary J. Pierce,* Peng W. Chee,
‡Xavier Draye,
§Yehoshua Saranga,** Robert J. Wright,
††Thea A. Wilkins,
††O. Lloyd May,
‡C. Wayne Smith,
‡‡John R. Gannaway,
§§Jonathan F. Wendel*** and Andrew H. Paterson*
,1*Plant Genome Mapping Laboratory and‡Coastal Plains Experiment Station, University of Georgia, Athens, Georgia 30602,
†
Division of Crop Improvement, Central Institute for Cotton Research, Nagpur, India,§Universite´ catholique de Louvain Place Croix du Sud 2/11–1348, Louvain-la-Neuve, Belgium,**The RH Smith Institute of Plant Science and
Genetics in Agriculture, The Hebrew University of Jerusalem, Rehovot 76100, Israel,††Department of Plant and Soil Science, Texas Tech University, Lubbock, Texas 79409,‡‡Department of Soil and
Crop Science, Texas A&M University, College Station, Texas 77843,§§Texas A&M Research and Extension Center, Lubbock, Texas 79401,***Department of Ecology, Evolution,
and Organismal Biology, Iowa State University, Ames, Iowa 50011
Manuscript received April 17, 2007 Accepted for publication May 31, 2007
ABSTRACT
QTL mapping experiments yield heterogeneous results due to the use of different genotypes, environments, and sampling variation. Compilation of QTL mapping results yields a more complete picture of the genetic control of a trait and reveals patterns in organization of trait variation. A total of 432 QTL mapped in one diploid and 10 tetraploid interspecific cotton populations were aligned using a reference map and depicted in a CMap resource. Early demonstrations that genes from the non-fiber-producing diploid ancestor contribute to tetraploid lint fiber genetics gain further support from multiple populations and environments and advanced-generation studies detecting QTL of small phenotypic effect. Both tetraploid subgenomes contribute QTL at largely non-homeologous locations, suggesting divergent selection acting on many corresponding genes before and/or after polyploid formation. QTL correspondence across studies was only modest, suggesting that additional QTL for the target traits remain to be discovered. Crosses between closely-related genotypes differing by single-gene mutants yield profoundly different QTL landscapes, suggesting that fiber variation involves a complex network of interacting genes. Members of the lint fiber development network appear clustered, with cluster members showing heterogeneous phenotypic effects. Meta-analysis linked to synteny-based and expression-based information provides clues about specific genes and families involved in QTL networks.
M
OST naturally occurring genetic variation in populations reflects polymorphic alleles that individually have relatively small effects but collectively result in continuous variation among members of the population. Through genetic mapping, the number and location of loci associated with complex trait variation, i.e., quantitative trait loci or QTL, can be estimated and used to infer the genetic basis of traits that differ between varieties and/or species (Paterson et al. 1988). DNAmarkers linked to QTL can also be used as diagnostic tools in the selection of desirable genotypes (marker-assisted selection) and as a starting point for cloning of QTL. For these reasons, vast numbers of QTL
represent-ing a myriad of traits have been mapped in agronom-ically important crops, and also in botanical models and animals. A handful of genes underlying QTL have been cloned (e.g., Frary et al. 2000) based largely on fine
mapping (Patersonet al.1990).
A recurring complication in the use of QTL data is that different parental combinations and/or experi-ments conducted in different environexperi-ments often result in identification of partly or wholly nonoverlapping sets of QTL. The majority of such differences in the QTL landscape are presumed to be due to environment sen-sitivity of genes. The use of stringent statistical thresh-olds to infer QTL while controlling experiment-wise error rates (Lander and Botstein 1989; Churchill
and Doerge1994) implies that only a small fraction of
these nonoverlapping QTL can be attributed to false-positive results. Small QTL with opposite phenotypic
1Corresponding author:Plant Genome Mapping Laboratory, University of
Georgia, 111 Riverbend Rd., Rm. 228, Athens, GA 30602. E-mail: [email protected]
effects might occasionally be closely linked in coupling in early-generation populations, and separated only in advanced-generation populations after additional recombination.
Comparison of multiple QTL mapping experiments by alignment to a common reference map offers a more complete picture of the genetic control of a trait than can be obtained in any one study. One such trait, the genetic control of variation in growth and development of seed-borne epidermal ‘‘lint’’ fibers, is a natural pri-ority in cotton genome analysis. All 50 Gossypium spe-cies have seed-borne epidermal trichomes, often referred to as ‘‘fuzz’’ fibers. ‘‘A’’ genome diploid cottons are dis-tinct from their sister ‘‘F’’ and ‘‘B’’ genomes in that both wild and cultivated forms have longer lint fibers with secondary thickening, which are spinnable; this feature can thus be inferred to have evolved after the divergence of the A, B, and F genomes from a common ancestor 5–7 MYA (Wendel 1989). Some view lint as distinct
from fuzz fibers based on the secondary thickening, while others view the two as extremes in a continuum. However, all agree that economically important lint fi-bers are much longer, reaching lengths of20 mm in cultivated A-genome diploidsGossypium herbaceum and G. arboreum. Wild tetraploid cottons have fibers resem-bling those of wild diploids; however, domestication and scientific improvement of AD tetraploids G. hirsutum andG. barbadense(from different tetraploid clades) have increased fiber length to as much asmm or more, and also improved other aspects of fiber quality (strength, fineness, and elongation) as well as higher yield, even in environments to which both have been adapted by scientific plant breeding ( Jianget al.1998).
Accurate measurement of cotton fiber quality re-quires complex instrumentation and therefore has been a high-priority trait for which to establish diagnostic DNA markers, in view of the fact that cotton provides 45% of the raw material for the$500 billion/year worldwide textile industry. Cotton fiber quality is a complex characteristic with many components affecting both the efficacy of processing by textile spinning machinery and the comfort attributes associated with cotton fabrics. To date, .200 QTL related to various aspects of fiber quality have been mapped using differ-ent kinds of populations including F2( Jianget al.1998;
Patersonet al.2003; Meiet al.2004; Linet al.2005; Shen
et al.2005; Udallet al.2006), advanced backcross (Chee
et al.2005a,b; Drayeet al.2005; Lacapeet al.2005), and
cytogenetic stocks (Sahaet al.2004).
Meta-analysis of cotton fiber QTL promises to con-tribute to our understanding of fundamental questions and to expedite crop improvement. Gossypium is an especially good model in which to advance understand-ing of the consequences of polyploidy in that both derived tetraploids and their ancestral diploids (or at least very close relatives) are known and remain extant, yet the polyploidization event is sufficiently old½1–2
million years (Senchina et al. 2003) for adaptive
evolution to have occurred. One particularly exciting opportunity is to shed light on why tetraploid cottons consistently have higher yield and quality than the modern descendants of their diploid progenitors, even in environments to which both have been adapted by scientific plant breeding ( Jianget al.1998).
Research into the genetic control of cotton fiber development may also benefit from progress in under-standing the growth and development of hair-bearing epidermal cells (trichomes) in Arabidopsis. Indeed, Gossypium and Arabidopsis are thought to have shared common ancestry 83–86 MYA (Benton 1993), and
cotton may be the best crop outside of the Brassicales in which to employ translational genomics from Arabidopsis.
Using a high-density reference genetic map which consists of 3475 loci in total, herein we report the alignment of 432 QTL involving cotton fiber quality ( Jiang et al. 1998; Paterson et al. 2003; Chee et al.
2005a,b; Draye et al. 2005), yield ( Jiang et al. 1998;
Saranga et al. 2001, 2004; Rong et al. 2005b), leaf
morphology ( Jianget al.2000; Waghmareet al.2005),
flower morphology, resistance to bacteria (Wrightet al.
1998), trichome distribution and density (Wrightet al.
1999), and other traits that were mapped in 11 pop-ulations. All QTL were also projected onto a consensus map, which was inferred to resemble the DNA marker arrangement of the hypothetical ancestor of the two subgenomes of tetraploid cotton (Rong et al.2005a).
The consensus map has improved our ability to deduce cotton-Arabidopsis synteny relationships and thus fos-ters study of correspondence between the cotton QTL and fiber or trichome-related Arabidopsis genes. To encourage further utilization and on-line community access to these data, a CMap resource was developed and can be accessed at our website.
MATERIALS AND METHODS
Populations:QTL and mutant data used in this study were published previously except for those from populations segregating forn2andimmutants (see below), as described in Table 1.
QTL mapping of n2 and im populations: Two new F2 populations derived from crosses betweenG. barbadense var. Pima S-7 andG. hirsutumcv. Texas Marker-1 (TM-1) isogenic lines withn2andimmutants, respectively, were mapped.
DNA markers were selected from a high-density reference map (Ronget al.2004). Procedures for linkage analysis were
reported previously (Rong et al. 2004). Composite interval
mapping (Zeng 1994) was performed using Windows QTL
Cartographer (Wang et al. 2005) (http://statgen.ncsu.edu/
qtlcart/WQTLCart.htm). A stringent LR threshold of 13.8 (equivalent to LOD score 3.0) was used to declare significant QTL to keep the experiment-wise likelihood of even one false positive below 5% in the large genome of cotton ( Jianget al.
1998). Effects and percent of phenotypic variance (PV) explained by single QTL (R2) were estimated with Windows QTL Cartographer 2.0 at likelihood peaks.
Integration of QTL from different populations: For convenience of description, three names were used for dif-ferent types of genetic maps: individual map, reference map (Ronget al.2004), and consensus map (Ronget al.2005a).
Individual maps were the original QTL maps summarized in Table 1. To align QTL from different individual maps, the reference map was used, from which subsets of informative markers were drawn to make the individual maps. Finally, some analyses also used a ‘‘consensus map’’ that depicts the marker arrangement along the genome of a hypothetical common ancestor that gave rise to the diploid progenitors of polyploid cotton, inferred as described elsewhere (Ronget al.
2005a). Most of the QTL locations in reference and consensus maps were determined by BioMERCARTOR (Version 2)
(Arcadeet al.2004). QTL in regions where the marker order
was different between the individual map and reference map were plotted based on the location of the marker nearest to the likelihood peak on the reference map. The individual maps were made over several years, during which changes in the reference map occurred; marker and chromosome nomen-clature was all synchronized with that of the current reference map (Ronget al.2004). Redundant probes, identified as
de-tailed elsewhere (Ronget al.2005a), were removed.
Nomen-clature of QTL in the reference map was standardized to the system reported (Cheeet al.2005a,b; Drayeet al.2005), that is,
trait name first, then the name of the chromosome on which the QTL was located, followed by a number indicating the loci on this chromosome. If two QTL were reported by Cheeet al.
(2005a,b) and Drayeet al.(2005) on a chromosome,
addi-tional QTL for the same trait mapped in the same chromo-some of other individual maps will be given a number with two digits to represent their relative locations. For example, because two QTL for fiber length were mapped on linkage group D08 by Chee et al.(2005b) and named FLD08.1 and
FLD08.2 respectively, another QTL mapped on the same chromosome was named FLD08.15 representing the relative location of its likelihood peak between FLD08.1 and FLD08.2. The original name for each QTL used in each map, and the name in CMap of each trait as well as their category and source were summarized in supplemental Table 9 (http:// www.genetics.org/supplemental/).
CMap display of genetic maps: CMap v0.16 was down-loaded from the Generic Components for Model Organism Database project (GMOD; http://www.gmod.org). Genetic mapping data were prepared in spreadsheets and imported into CMap.
RESULTS
A CMap visualization tool for meta-analysis: To
streamline comparisons of QTL and other genomic data among chromosomes, subgenomes, populations, and syntenic locations in Arabidopsis, we developed a cotton CMap resource (publicly available at http://www.
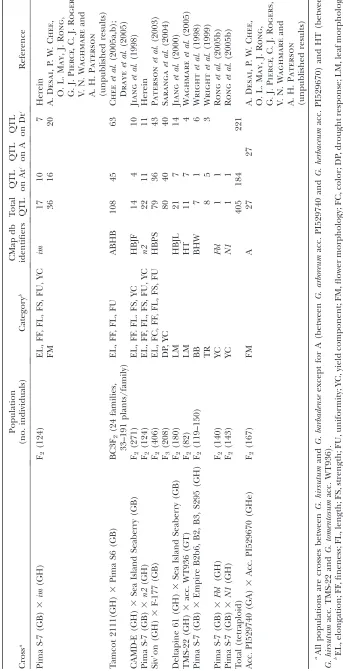
plantgenome.uga.edu/cmap). Using BioMERCARTOR (Arcadeet al.2004), a total of 432 QTL from 11
indi-vidual maps (Table 1) were aligned to the reference map (Ronget al.2004) and to the consensus map
represent-ing inferred gene (marker) arrangements along the chromosomes of a common ancestor of the A and D genomes (Ronget al. 2005a). Among them, 224 QTL
from five populations were related to fiber quality, 64 from four populations were related to yield compo-nents, 63 from two populations (one tetraploid and one diploid A genome) were related to flower morphology, 33 from one population were related to drought re-sponse, 32 from two populations were related to leaf morphology, 8 from four populations were related to trichome density, 7 from four populations were related to bacterial blight resistance, and 1 from one population was related to earliness. Available from the CMap re-source are individual QTL maps, the reference map, and the consensus map, plus relationships of cotton chromosomes to inferred gene orders for a hypothetical common ancestor of cotton and Arabidopsis (Rong
et al. 2005a) based on correspondence inferred using CSII (Levine2002) and FISH (Calabreseet al.2003).
In an example of the visualizations possible with this resource (Figure 1), a QTL on one chromosome (Chr. 16) of an individual population (n2) is aligned to the corresponding ‘‘chromosome’’ of the consensus map, also indicating corresponding regions of Arabidopsis and showing all QTL known from all populations for the region shown. Thus, the CMap resource expedites the comparison of QTL between different homeologous chromosomes as well as between cotton QTL and Arabidopsis orthologs in the syntenic regions.
Cotton fiber QTL are enriched in the D subgenome:
More QTL were detected in the tetraploid D (hereafter Dt) than in the tetraploid A (hereafter At) subgenome, specifically 221vs. 184 (Table 1). Of special interest were QTL related to lint fiber quality characteristics, in that the At progenitor produces spinnable fiber but the Dt progenitor does not. We focused this analysis on fiber quality characteristics because of their relatively high heritability (May and Wofford 2000) and economic
importance. QTL for fiber yield components from a small number of studies are also in the CMap database, but in view of the complexity and low heritability of this trait we considered that more extensive testing would be needed before a meaningful meta-analysis could be performed on these.
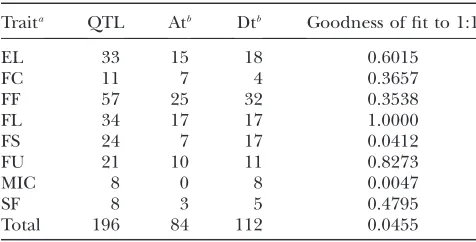
and short fiber content (SF) (Table 3). All traits except FC and FL have more QTL on Dt than on At, but the major contributors to the subgenome bias are FS and MIC, for which the Dt subgenome contains significantly more QTL than does the At subgenome (P¼0.041,P¼ 0.005, respectively; Table 3). FF is controlled by the largest number of loci (57), followed by FL and EL (34,
33). SF and FC are controlled by the fewest loci, 8 and 11 respectively.
Cotton fiber QTL are clustered: QTL were
non-randomly distributed across chromosomes and chro-mosomal regions (supplemental Table 1 at http://www. genetics.org/supplemental/). Chromosome length (from the genetic map, in centimorgans) had a significant
Figure1.—A CMap display of the comparison between an individual map and a consensus map. The left map is chromosome
16 from then2population including one QTL (MIC) shown on the left side of the map. The right map is consensus chromosomes C4, reconstructed from the At and Dt maps as described (Ronget al.2005a). To the immediate right of this map, blocks of inferred
synteny with Arabidopsis are shown. D (or Ds) number indicates correspondence to the accordingly numbered Arabidopsis
a-duplicated segment (Bowerset al.2003), and the number after the dot indicates the span of this particular segment of
cor-respondence in thea-duplicated segment (which can be visualized at our CMAP website; also see Ronget al.2005a for further
details). To the right of blocks of inferred synteny, QTL likelihood intervals are plotted, labeled as described in the text. Where appropriate, parenthetical information indicates experimental treatments (for example, ww, well-watered, and bt, both treat-ments: Patersonet al.2003), or alternate name of the trait if different in prior publications are presented in parenthesis after
relationship with the number of total QTL and fiber QTL in the Dt subgenome (r¼0.62,P,0.01; andr¼ 0.51, P , 0.05, respectively), but not in the At (r ¼ 0.11,r¼0.15). As a result, although the Dt genome as a whole carries more QTL for fiber quality than does the At genome, the distributions of QTL between dif-ferent pairs of homeologs varied widely. Seven Dt chro-mosomes or linkage groups (Chr. 14, 17, 20, 22, 23; LG D03 and D08) had more fiber-related QTL than their homeologous partners, with the largest difference between linkage group D08 (21 QTL) and Chr. 4/5 (8 QTL). Five At chromosomes or linkage groups (Chr. 1, 6, 7; LG A01 and A03) have more fiber QTL than their homeologous counterparts, with the largest difference between Chr. 06 (the shortest At chromosome, 9 QTL), and Chr. 25 (4 QTL).
When each chromosome was divided into bins of 20 cM and the center of the QTL likelihood interval used as the QTL location, fiber-related QTL were found to be clustered in some chromosomal regions (Fig-ure 2; supplemental Table 2 at http://www.genetics.org/ supplemental/). Based on the total of 235 bins across the cotton genome and 196 fiber QTL, the Poisson
prob-ability distribution function indicated that the presence of three or more QTL in a bin was significantly (P , 0.05) higher than the random expectation. A total of 87 (44.5%) QTL were located in 24 such bins (supplemen-tal Table 2). The three bins with the largest numbers of fiber QTL (5 or 6) were on Chr. 17 and linkage group D08 (2 bins). In no cases were statistically significant QTL clusters found in corresponding regions of home-ologous chromosomes. These clusters are further eluci-dated below as examples of how integration of positional, comparative, expression, and functional data might nar-row the lists of candidate genes that may represent the QTL.
Homology and homeology:Integration of QTL from
different populations into a common map facilitates exploration of their allelic and homeologous relation-ships, albeit at a level of resolution limited by compar-ative marker densities, variation in recombination rates in different crosses, variation in gene densities across the genome, and other factors. QTL for the same trait from different crosses, that had a likelihood peak within the same 20-cM bin, were considered potential alleles (albeit requiring further study to confirm). Considering the different fiber-related traits individually, with only a maximum of 57 QTL per trait (FF), the occurrence of even 2 QTL in the same bin was statistically unlikely to occur by chance (at P , 0.05). A total of four such clusters were found, each comprising 2 QTL for FF (three cases) and EL (one case) (supplemental Table 3 at http://www.genetics.org/supplemental/). The 8 QTL compose 4.1% of the total. All of these clustered QTL were located in fiber QTL-rich bins identified above (bin 5 of Chr. 02, bin 2 of Chr. 12, bin 6 of Chr. 15 and bin 8 of D08), although these bins collectively compose only 3.6% of the genome. The two EL QTL in bin 8 of D08 were detected in the same population (ELD08.3 and ELD08.4). However, the members of the three pairs of FF QTL, respectively, were detected in different experiments.
Likewise, QTL for the same trait were considered to be potentially homeologous if their likelihood peaks fell within pairs of bins inferred to be homeologous based TABLE 2
Chi-square test of fiber-related QTL distributed on At and Dt subgenome in three non-mutant populations
Populationa QTL Atb Dtb
Goodness of
fit to 1:1 Reference
CAMD-E (GH)3Sea Island Seaberry (GB) 9 3 6 0.317 Jianget al. (1998)c
Siv9on (GH)3F-177 (GB) 79 36 43 0.431 Patersonet al. (2003)
Tamcot 2111 (GH)3Pima S6 (GB) 108 45 63 0.083 Cheeet al. (2005a,b);
Drayeet al. (2005)
Total 196 84 112 0.045
a
GH,G. hirsutum; GB,G. barbadense b
At, Dt: Tetraploid chromosomes derived from A-genome and D-genome diploid progenitors, respectively. c
Four QTL for yield components and one for earliness not included, as discussed in text.
TABLE 3
Chi-square test of the QTL distribution between tetraploid At and Dt subgenomes for different fiber traits
Traita QTL Atb Dtb Goodness of fit to 1:1
EL 33 15 18 0.6015
FC 11 7 4 0.3657
FF 57 25 32 0.3538
FL 34 17 17 1.0000
FS 24 7 17 0.0412
FU 21 10 11 0.8273
MIC 8 0 8 0.0047
SF 8 3 5 0.4795
Total 196 84 112 0.0455
a
EL, elongation; FC, color; FF, fineness; FL, length; FS, strength; FU, uniformity; MIC, micronaire; SF, short fiber content.
b
on nonrandom alignments of duplicated DNA markers (Ronget al.2004). Based on these criteria, a total of 41
(20.9%) QTL from six fiber traits were found to be po-tentially homeologous (supplemental Table 4 at http:// www.genetics.org/supplemental/). Fiber fineness was unusual in that 24 (42.1%) of 57 QTL were potentially homeologous. Figure 3 displays a middle region of consensus chromosome C12 with two potentially home-ologous loci for EL that were originally mapped on Chr. 05 by Paterson (EL05.1) (Patersonet al.2003) and Chr. 22
by Chee (EL22.3) (Cheeet al.2005a). This is an example
of homeologous loci for a fiber related trait detected in different experiments.
Impact of mutants in fiber development on the QTL
landscape:We postulated that the QTL landscape might
be altered by nonlinear interactions among unlinked genes in the fiber-development program. Most QTL mapping, however, has only modest power to resolve such epistasis. As a test case we explored how different discrete single-gene mutations alter the spectrum of QTL explaining variation in a trait. Specifically, we compared the QTL maps resulting from crosses of one common parent, Pima S7, to two closely-related genetic stocks containing different discrete mutations impli-cated in lint fiber development.
n2 is a recessive mutant expressing completely or partially naked seed, previously assigned to Chr. 26 using aneuploid stocks (Percyand Kohel1999), but recently
suggested based on DNA markers to map to its homeo-log, Chr. 12 (Ronget al.2005b). A total of 242 probes
detecting 370 loci mapped to 41 linkage groups cover-ing 3116.2 cM of the n2 population, at an average spacing of 8.42 cM.
im is a recessive mutant causing immature fiber, characterized by reduced secondary cell wall develop-ment and fiber weight reduction of 40% or more (Kohel and McMichael 1990), assigned to Chr. 03
based on aneuploid stocks (Kohelet al.2002). A total of
233 probes detecting 363 loci mapped to 37 linkage groups in theimpopulation, at an average spacing of 9.6 cM. Bothn2andimmaps have similar marker orders and recombination distances, and are available in the CMap database.
Nine traits, including two lint yield components, seed weight, and six fiber quality components, were mea-sured (see materials and methods). While all traits
varied over a considerable range, no significant differ-ence between then2andimmapping populations was found for any measured trait (supplemental Table 5 at http://www.genetics.org/supplemental/).
A total of 22 QTL were detected on 14 chromosomes in then2population (supplemental Table 6a at http:// www.genetics.org/supplemental/). More than half of the QTL were on only 4 chromosomes, with 4 on Chr. 12, 3 on its homeolog (Chr. 26), 3 on Chr. 17 and 2 on linkage group D08. Ten other chromosomes each contained single QTL (supplemental Table 6a). Two QTL for lint index each explain a remarkably high percentage of phenotypic variation (66.5%), with other QTL ranging from 10.4% to 25.3% of PV explained.
In theimpopulation, only 17 QTL were detected for the same traits measured inn2. One fiber strength QTL was detected in both populations (FS02.1 and FS02.2) in bin 5 of Chr. 02. The other 16 QTL were all located on different chromosomes than theirn2 counterparts (supplemental Table 6b at http://www.genetics.org/
Figure 2.—Number and distribution of
ge-netic markers and fiber-related QTL in 20-cM bins along chromosomes 1 and 2 of a reference genetic map (Ronget al.2004). Open bars
Figure3.—Genetic map and Arabidopsis syntenic regions of a segment of cotton consensus chromosome C12 (from 54.1 to
73.1 cM) showing the locations of fiber-related QTL, Arabidopsis orthologs of cotton fiber-related cDNAs, and Arabidopsis genes functioning in trichome development. Vertical bars on the left side of C12 represent the locations of QTL for fiber elongation
(Patersonet al.2003), fiber length (Cheeet al.2005b), and mass of seed cotton (log transformed) ( Jianget al.1998). Solid lines
supplemental/). For example, no QTL were detected in theim population on Chr. 12, 17, and 26, which each had 3–4 QTL inn2. Chr. 02 and A02, which show 1 or 0 QTL in then2population, had 4 and 3 QTL in theim population, respectively. One large-effect QTL (explain-ing 46.7% of phenotypic variation) was detected on linkage group D02 for FUD02.1(HVui) in the im population, but no corresponding QTL was found in n2. Likewise, the strong QTL for lint index in then2 population showed no corresponding effects in theim population, although a relatively weak QTL was de-tected for this trait on Chr. 14 ofim. While the two study populations were only of sufficient size to detect the largest-effect segregating QTL, the use of stringent sig-nificance thresholds supports the validity of the QTL that were claimed, and even these relatively large-effect QTL did not correspond in the two populations. Since these two populations involved very similar genetic backgrounds tested in the same environment, the non-overlapping QTL detected suggest that the differing qualitative mutations cause different pathways and/or networks to be limiting factors of fiber quality.
Although only one correspondence (FS02.1 and FS02.2) was found in fiber QTL between then2andim populations, considerable correspondence was found between then2orimfiber QTL and those detected in the three non-mutant populations introduced above. Seven QTL found in the mutant populations map to bins containing QTL for the same fiber traits from other populations, increasing the number of nonrandom QTL clusters from 4 (based only on the three non-mutant populations) to 12 (including the QTL from the mutant populations) (supplemental Table 3 at http:// www.genetics.org/supplemental/). Clusters had 2 QTL each, for EL (three clusters), FF (three), FL (two), FS (three), and SF (one) and composed 10.9% (24 of 224) of all fiber QTL. This correspondence to QTL from other larger populations provides further support for the validity of at least a subset of the inferred QTL.
The QTL for different fiber characters located on the same chromosome were generally clustered both inn2 andim. For example, 3 QTL on Chr. 26 ofn2were all in bin 5. Four QTL on Chr. 02 ofimwere centered in bins 4 and 5 and 2 more in bin 2 of A02. Many of the QTL, scattered on different bins of Chr. 12 inn2, or different chromosomes, were clustered with QTL detected in the elite populations. In total, inclusion of mutant popula-tion data increased QTL clusters to 27 bins of 105 QTL vs. 24 bins of 87 QTL based on the elite populations alone, with 6 bins containing 5–7 fiber QTL on Chr. 1, 2, 16, 17, and D08 (2 bins). As found in the three non-mutant populations, no statistically significant QTL clusters occurred in corresponding regions of the homeologous chromosomes.
Relationships between QTL and fiber-related
cDNAs/genes: A consensus map that depicts the
in-ferred marker arrangement along the genome of the
common ancestor that gave rise to the diploid progen-itors of tetraploid cotton (Ronget al.2005a) sets the
stage for exploring relationships between cotton QTL and genes from taxa such as Arabidopsis that diverged from cotton prior to polyploid formation. All QTL from the reference map were plotted to corresponding loca-tions on the consensus map. In parallel, we determined the locations in the Arabidopsis genome of a total of 203 candidate genes representing up to the four best matches (at E , 1010) for each of 78 cDNAs/genes known from prior published work to be preferentially expressed during cotton lint fiber growth and develop-ment (suppledevelop-mental Table 7 at http://www.genetics.org/ supplemental/, which includes their protein family af-filiation, GenBank accession number, expression pat-tern if known, and citations of published descriptions) and 28 Arabidopsis genes known to be critical for tri-chome and/or fiber development (supplemental Table 8). The Arabidopsis orthologs were plotted to their lo-cations in an inferred ancestral gene order that miti-gates the effects of a whole-genome duplication in Arabidopsis since its divergence from cotton (i.e., a -duplicated segments). Established syntenic relationships between cotton and Arabidopsis (Ronget al.2005a) were
used to determine correspondence between the QTL and candidate genes. QTL locations were plotted based on the midpoint of the QTL likelihood interval.
We found evidence of a general association between concentrations of candidate genes and cotton fiber-related QTL. Based on synteny inferred using CrimeStat II (Rong et al. 2005a), a significant correlation (r ¼
0.260, N ¼167, P ¼0.0003) was found between QTL number in cotton and candidate gene number in Arabi-dopsis. When we considered only the smaller number (largely a subset) of regions of synteny inferred using FISH (Rong et al.2005a), the correlation was weaker
(r¼0.072,N¼189) and fell short of significance (P¼ 0.164). In both CSII and FISH-based models, the cor-relations between numbers of fiber QTL and all (not just candidate) Arabidopsis genes in the syntenic re-gions detected by CrimestatII or FISH were not signif-icant, suggesting that the relationship is specific to the population of candidate genes. Figure 3 presents an example in which four fiber-related QTL on a region of consensus chromosome C12 ranging from 54.1 to 73.1 cM showed synteny with Arabidopsis a 4, 10, and 14 duplicated segments. At least six Arabidopsis sequences in this region matched two fiber-related cDNAs (CesA1 andGhExp1) and one Arabidopsis trichome gene (TTG2). Numbers and names of all Arabidopsis orthologs in the syntenic regions can be found in CMap.
DISCUSSION
growth and development in polyploid cotton: Tetra-ploid cottons have higher lint fiber yield and quality than the modern descendants of their diploid progen-itors, even in environments to which both have been adapted by plant breeding ( Jianget al.1998). While the
genetic potential for lint fiber development appears to have been transmitted to tetraploid cottons by their A genome progenitor, early demonstrations that Dt-subgenome loci have been recruited to contribute fur-ther to lint fiber genetics in tetraploids ( Jianget al.1998)
gain further support from the more extensive data now available from larger numbers of QTL in additional independent populations that include a higher degree of replication across environments (Patersonet al.2003),
and advanced-generation studies able to detect QTL of smaller phenotypic effect (Chee et al. 2005a,b; Draye
et al.2005; Lacapeet al.2005). This finding implicates the
Dt-genome (from the non-fiber-producing ancestor) in evolution of the transgressive fiber quality and yield of polyploid cottons relative to their diploid progenitors.
A wealth of research has revealed that gene copies from genome duplications (polyploidizations) experi-ence different fates during their evolution including gene loss, subfunctionalization, and neofunctionaliza-tion (Lynchand Force2000; Rastogiand Liberles
2005). This raises the possibility that differential evolu-tion of homeologous fiber-related genes duplicated by polyploid formation (Cronn et al. 1999) is partly
re-sponsible for modern cotton fiber quality. Randomly chosen genes show similar evolutionary rates in the two genomes before and after polyploid formation. How-ever, lack of knowledge of the gene network involved in lint fiber morphogenesis has precluded study of its spe-cific constituents; perhaps the Dt alleles of key lint fiber-related genes have evolved more quickly. In other words, selection may have played a different role in genetic changes of homeologous genes in At and Dt genomes, respectively, after reunion of these two ge-nomes1–2 MYA.
Meta-analysis reveals a complex QTL landscape:
Although the sets of QTL found for the same fiber-related trait in different experiments showed nonran-dom correspondence, we were surprised that corre-spondence was only observed for10% of the total QTL set. Comparison in the same environment of two new mapping populations which shared one identical par-ent, Pima S-7, and had closely related alternative parents that differed in carrying specific fiber mutants (n2and im, respectively) showed virtually no common QTL. However, the validity of many QTL in each of these populations is supported by their correspondence to QTL found in other populations. This suggests that lint fiber development may involve a complex gene network in which perturbations at one point have widespread consequences. The discrete mutants studied may im-pose particularly large perturbations; if small differ-ences in QTL alleles among populations also cause the
same phenomenon, then the generally low level of correspondence among QTL found in different pop-ulations might be explained.
These findings have several implications. In terms of basic genetics, the heterogeneity in QTL revealed by the different experiments reiterates the need for study of a broad sampling of germplasm, in a wide range of envi-ronments, to gain a representative picture of the true genetic complexity of a trait in a particular taxon. From an applied standpoint, the data highlight the need to validate QTL specifically in each genetic background in which they are to be deployed (for example, in main-stream breeding).
Members of the lint fiber development network appear clustered, but cluster members show
heteroge-neous phenotypic effects:Several lines of evidence
sug-gest nonrandom distribution of genes implicated in lint fiber development. First, 105 (46.9%) lint fiber-related QTL were concentrated in 27 bins composing 12.1% of the genome. Further, the corresponding regions of the Arabidopsis genome also contain nonrandom concen-trations of genes that are implicated in fiber/trichome development based on either expression patterns or functional information.
Most of these clusters show heterogeneous pheno-typic consequences. In only a small subset of cases (12) did more than one QTL affect the same phenotype. Moreover, in many cases the genes were detected in different experimental populations, precluding pleiot-ropy as a general explanation (although it may contrib-ute in some cases).
A tantalizing hypothesis is that concentrations of cot-ton lint fiber QTL may represent groups of coordinately regulated genes and/or groups of small gene families that have undergone proximal duplication followed by sub- or neofunctionalization. Progress in physical map-ping of several members of the Gossypium genus may permit this hypothesis to be tested in the near future.
Meta-analysis linked to synteny-based and expression-based information provides clues about specific genes
and families involved in QTL networks:Integration of
QTL from individual maps using a common reference map will be helpful to infer possible positional relation-ships to QTL locations on other maps that share some DNA markers with our reference map (Lacape et al.
2003, 2005; Shenet al.2005; Hanet al.2006). For
exam-ple, a QTL governing fiber elongation (ELO) (Lacape
et al.2005) near marker G1058 in Chr. 22 corresponds closely to a QTL for the same trait (EL22.1) on the reference map, suggesting that these two QTL may be the same. Similarly, if new QTL were plotted in maps that share common markers with this high-density map, it can quickly be determined if they might correspond to previously identified QTL.
information in further study and cloning of fiber genes. Burgeoning information about differential expression patterns of cotton genes, together with extensive knowl-edge of the molecular control of epidermal trichome development in Arabidopsis, provide valuable clues about possible cotton genes in the fiber development network. The locations of cotton fiber QTL, and in-formation about synteny between cotton and Arabidop-sis, make it possible to begin to search for intersections among these various data types that point to specific genes as candidates worthy of further functional testing to determine if they are directly responsible for genetic variation in cotton fiber development.
For example, the collective data in clusters of QTL suggest numerous candidate genes and possible ap-proaches for advancing progress toward identification of the causal gene(s), as follows:
The cluster with five fiber QTL in Chr. 17 was in a region ranging from 2.4 to 11.4 cM on bin 1. These QTL each are based on different measurements of fiber quality, and reported in two different studies ½FS17.1 and FC17.1 (Patersonet al.2003) and FL17.1, FU17.1,
and MIC17.1 (Cheeet al.2005a,b; Drayeet al.2005).
The region harboring these QTL showed synteny (identified by both CrimestatII and FISH) with Arabi-dopsis duplications a03 and a21. Gene At4g18780 in
a21 is CelA1 (E ¼ 0) and two Arabidopsis genes (At1g12560 and At1g62980) in a03 are members of the expansin gene family (best matching AtEXP7,E, 1E-154 and AtEXP18, E , 6E-156) involved in Arabi-dopsis trichome development.
In linkage group D08, 11 of 22 fiber QTL were clustered in bins 3 and 8. QTL in bin 3 are ELD08.2, FLD08.1(HVsl2.5,HVuhm,Lw), FUD08.1(HVui), SFD08.1 (HVsfc, SFCn), FSD08.2(STR), and FFD08.2, and dis-tributed from 40.3 to 53.1 cM, a marker-sparse segment. Except for FSD08.2 (STR) reported by ( Jiang et al.
1998), all others were detected in advanced backcross populations (Cheeet al.2005a,b; Drayeet al.2005). No
QTL were found in the homeologous region on Chr. 05. These QTL were located in a region (D05.153) showing synteny with a segment of Arabidopsis duplication a5 where four candidate genes were found including pa-ralogs (At1g80350 and At1g80360,E¼8E-118 and 1.4E-56, respectively) offra2, and homologs (At1g15690 and At1g79840,E¼4.8E-97 and 0) of proton-translocating pyrophosphatase (Ppase) and a homeobox protein (GhHox1). Another 5 fiber-related QTL on D08 were located in a region of bin 8 from 140.3 to 157.4 cM. All five QTL were found in advanced backcross populations (Cheeet al.2005a,b; Drayeet al.2005), including three
fiber length loci, FLD08.2 (HVsl2.5, HVuhm, Lw), FUD08.2 (HVui), and SFD08.2 (HVsfc), and two fiber elongation loci, ELD08.3 and ELD08.4. The region showed synteny with part ofa07 (D07.160) and one of the Arabidopsis genes, At4g09820, is the paralog of EGL3 (E,1.5E-38).
We thank numerous colleagues for valuable assistance and sugges-tions, and the United States–Israel Binational Agricultural Research and Development Fund (US-2506-94R to A.H.P. and Y.S.), the BOYSCAST program of the Department of Science and Technology, India (to V.N.W.), United States Department of Agriculture National Research Initiative (02-01412 to A.H.P.), the National Science Foun-dation Plant Genome Research Program (DBI-9872630, DBI-0211700 to A.H.P. and J.F.W.), the Fonds National belge pour la Recherche Scientifique (research associate grant to X.D.), the Texas and Georgia Agricultural Experiment Stations, Texas Higher Education Coordi-nating Board, Cotton Incorporated, and United States Department of Agriculture–Initiative for Future Agriculture and Food Systems (00-52100-9685 to A.H.P., P.W.C., J.R.G., O.L.M., C.W.S.) for financial support.
LITERATURE CITED
Arcade, A., A. Labourdette, M. Falque, B. Mangin, F. Chardon et al., 2004 BioMercator: integrating genetic maps and QTL
to-wards discovery of candidate genes. Bioinformatics 20:2324–
2326.
Benton, M. J., 1993 The Fossil Record, Ed. 2. Chapman & Hall,
New York.
Bowers, J. E., B. A. Chapman, J. Rong and A. H. Paterson,
2003 Unravelling angiosperm genome evolution by
phyloge-netic analysis of chromosomal duplication events. Nature422:
433–438.
Calabrese, P. P., S. Chakravartyand T. J. Vision, 2003 Fast
iden-tification and statistical evaluation of segmental homologies in
comparative maps. Bioinformatics19(Suppl. 1): i74–i80.
Chee, P., X. Draye, C. Jiang, L. Decanini, T. Delmonte et al.,
2005a Molecular dissection of interspecific variation between
Gos-sypium hirsutumandG. barbadense(cotton) by a backcross-self
ap-proach: I. Fiber elongation. Theor. Appl. Genet.111:757–763.
Chee, P., X. Draye, C.-X. Jiang, L. Decanini, T. Delmonteet al.,
2005b Molecular dissection of phenotypic variation between
Gossypium hirsutum and Gossypium barbadense (cotton) by a backcross-self approach: III. Fiber length. Theor. Appl. Genet.
111:772–781.
Churchill, G. A., and R. W. Doerge, 1994 Empirical threshold
val-ues for quantitative triat mapping. Genetics138:963–971.
Cronn, R. C., R. L. Smalland J. F. Wendel, 1999 Duplicated genes
evolve independently after polyploid formation in cotton. Proc.
Natl. Acad. Sci. USA96:14406–14411.
Draye, X., P. Chee, C. Jiang, L. Decanini, T. Delmonte et al.,
2005 Molecular dissection of interspecific variation between
Gossypium hirsutumandG. barbadense(cotton) by a backcross-self
approach: II. Fiber fineness. Theor. Appl. Genet.111:764–771.
Frary, A., T. C. Nesbitt, A. Frary, S. Grandillo, E.v.d. Knaapet al.,
2000 fw2.2: A quantitative trait locus key to the evolution of
to-mato fruit size. Science289:85–88.
Han, Z., C. Wang, X. Song, W. Guo, J. Gouet al., 2006
Char-acteristics, development and mapping ofGossypium hirsutum
de-rived EST-SSRs in allotetraploid cotton. Theor. Appl. Genet.112:
430–439.
Jiang, C., R. J. Wright, S. S. Woo, T. A. DelMonte and A. H.
Paterson, 2000 QTL analysis of leaf morphology in tetraploid Gossypium(cotton). Theor. Appl. Genet.100:409–418.
Jiang, C. X., R. J. Wright, K. El-Zikand A. H. Paterson, 1998
Poly-ploid formation created unique avenues for response to selection inGossypium(cotton). Proc. Natl. Acad. Sci. USA95:4419–4424.
Kohel, R. J., and S. C. McMichael, 1990 Immature fiber mutant of
upland cotton. Crop Sci.30:419–421.
Kohel, R. J., D. M. Stellyand J. Yu, 2002 Tests of six cotton (
Gos-sypium hirsutumL.) mutants for association with aneuploids. J.
Hered.93:130–132.
Lacape, J.-M., T. B. Nguyen, S. Thibivilliers, B. Bojinov, B.
Courtoiset al., 2003 A combined RFLP-SSR-AFLP map of
tet-raploid cotton based on aGossypium hirsutum3Gossypium
barba-densebackcross population. Genome46:612–626.
Gossypium hirsutumxGossypium barbadensebackcross generations.
Crop Sci.45:123–140.
Lander, E. S., and D. Botstein, 1989 Mapping mendelian factors
underlying quantitative traits using RFLP linkage maps. Genetics
121:185–199.
Levine, N., 2002 CrimeStat: A spatial statistics program for the
anal-ysis of crime incident locations (v 2.0). Ned Levine & Associates, Houston, TX, and the National Institute of Justice, Washington, DC.
Lin, Z., D. He, X. Zhang, Y. Nie, X. Guoet al., 2005 Linkage map
construction and mapping QTL for cotton fibre quality using
SRAP, SSR and RAPD. Plant Breed.124:180–187.
Lynch, M., and A. Force, 2000 The probability of duplicate gene
preservation by subfunctionalization. Genetics154:459–473.
May, O. L., and T. J. Wofford, 2000 Breeding transformed cotton
expressing enhanced fiber strength. J. New Seeds2:1–13.
Mei, M., N. H. Syed, W. Gao, P. M. Thaxton, C. W. Smithet al.,
2004 Genetic mapping and QTL analysis of fiber-related traits
in cotton (Gossypium). Theor. Appl. Genet.108:280–291.
Paterson, A. H., E. S. Lander, J. D. Hewitt, S. Peterson, S. E.
Lincolnet al., 1988 Resolution of quantitative traits into
Men-delian factors by using a complete linkage map of restriction
frag-ment length polymorphisms. Nature335:721–726.
Paterson, A. H., J. W. DeVerna, B. Lanini and S. D. Tanksley,
1990 Fine mapping of quantitative trait loci using selected
over-lapping recombinant chromosomes, in an interspecies cross of
tomato. Genetics124:735–742.
Paterson, A. H., Y. Saranga, M. Menz, C. X. Jiangand R. J. Wright,
2003 QTL analysis of genotype x environment interactions
af-fecting cotton fiber quality. Theor. Appl. Genet.106:384–396.
Percy, R. G., and R. J. Kohel, 1999 Qualitative Genetics, pp. 319–
360 inCotton: Origin, History, Technology, and Production, edited by
C. W. Smithand J. T. Cothren. John Wiley & Sons, Hoboken, NJ.
Rastogi, S., and D. Liberles, 2005 Subfunctionalization of
dupli-cated genes as a transition state to neofunctionalization. BMC
Evol. Bio.5:28.
Rong, J., C. Abbey, J. E. Bowers, C. L. Brubaker, C. Changet al.,
2004 A 3347-locus genetic recombination map of
sequence-tagged sites reveals features of genome organization,
transmis-sion and evolution of cotton (Gossypium). Genetics166:389–417.
Rong, J., J. E. Bowers, S. R. Schulze, V. N. Waghmare, C. J. Rogers
et al., 2005a Comparative genomics ofGossypiumand
Arabidop-sis: Unraveling the consequences of both ancient and recent
polyploidy. Genome Res.15:1198–1210.
Rong, J., G. Pierce, V. Waghmare, C. Rogers, A. Desai et al.,
2005b Genetic mapping and comparative analysis of seven
mu-tants related to seed fiber development in cotton. Theor. Appl.
Genet.111:1137–1146.
Saha, S., J. Wu, J. N. Jenkins, J. J. C. McCarty, O. A. Gutierrezet al.,
2004 Effect of chromosome substitutions fromGossypium
barba-denseL. 3–79 intoG. hirsutumL. TM-1 on agronomic and fiber
traits. J. Cotton Sci.8:162–169.
Saranga, Y., M. Menz, C. X. Jiang, R. J. Wright, D. Yakiret al.,
2001 Genomic dissection of genotype x environment
interac-tions conferring adaptation of cotton to arid condiinterac-tions.
Ge-nome Res.11:1988–1995.
Saranga, Y., M. Menz, C. Jiang, R. Wright, D. Yakir et al.,
2004 Genetic and physiological dissection of adaptations
asso-ciated with cotton productivity under arid conditions. Plant, Cell
and Environ.27:263–277.
Senchina, D. S., I. Alvarez, R. C. Cronn, B. Liu, J. Ronget al.,
2003 Rate variation among nuclear genes and the age of
poly-ploidy inGossypium.Mol. Biol. Evol.20:633–643.
Shen, X., W. Guo, X. Zhu, Y. Yuan, J. Z. Yuet al., 2005 Molecular
mapping of QTLs for fiber qualities in three diverse lines in
up-land cotton using SSR markers. Mol. Breed.15:169–181.
Udall, J. A., J. M. Swanson, K. Haller, R. A. Rapp, M. E. Sparks
et al., 2006 A global assembly of cotton ESTs. Genome Res.
16:441–450.
Waghmare, V. N., J. Rong, C. J. Rogers, G. J. Pierce, J. F. Wendel et al., 2005 Genetic mapping of a cross betweenGossypium hir-sutum(cotton) and the Hawaiian endemic,Gossypium tomentosum.
Theor. Appl. Genet.111:665–676.
Wang, S., C. J. Bastenand Z. B. Zeng, 2005 Windows QTL
Cartog-rapher 2.5. Department of Statistics, North Carolina State Univer-sity, Raleigh, NC.
Wendel, J. F., 1989 New world tetraploid cottons contain old-world
cytoplasm. Proc. Natl. Acad. Sci. USA86:4132–4136.
Wright, R., P. Thaxton, K. El-Zikand A. H. Paterson, 1998
D-sub-genome bias of Xcm resistance genes in tetraploid Gossypium
(Cotton) suggests that polyploid formation has created novel
ave-nues for evolution. Genetics149:1987–1996.
Wright, R., P. Thaxton, A. H. Patersonand K. El-Zik, 1999
Mo-lecular mapping of genes affecting pubescence of cotton.
J. Heredity90:215–219.
Zeng, Z. B., 1994 Precision mapping of quantitative trait loci.
Genet-ics136:1457–1468.