Exploring factors related to changes in body
composition, insulin sensitivity and aerobic
capacity in response to a 12-week exercise
intervention in overweight and obese women
with and without polycystic ovary syndrome
David Scott1,2*, Cheryce L. Harrison3, Samantha Hutchison3,4, Barbora de Courten3,4‡, Nigel K. Stepto2,3,5‡
1 Department of Medicine, School of Clinical Sciences at Monash Health, Faculty of Medicine, Nursing and
Health Sciences, Monash University, Clayton, Victoria, Australia, 2 Department of Medicine – Western Campus and Australian Institute for Musculoskeletal Science, The University of Melbourne, St Albans, Victoria, Australia, 3 Monash Centre for Health Research and Implementation, School of Public Health and Preventive Medicine, Monash University, Clayton, Victoria, Australia, 4 Diabetes and Vascular Medicine Unit, Monash Health, Clayton, Victoria, Australia, 5 Institute of Sport Exercise and Active Living (ISEAL) Victoria University, Melbourne, Victoria, Australia
‡ These authors are equal senior authors on this work. *[email protected]
Abstract
Objective
To determine factors associated with differential changes in body fat, insulin resistance and aerobic capacity following a 12-week exercise intervention in overweight and obese women with and without polycystic ovary syndrome (PCOS).
Methods
16 overweight and obese women (9 PCOS; 7 without PCOS) completed a supervised pro-gressive 12-week exercise program. Primary outcomes included changes in indicators of insulin sensitivity (including glucose infusion rate relative to fat-free mass [GIR/FFM]), body composition, and aerobic capacity (VO2peak; 12 participants only). Comparisons were made between women with and without PCOS, and between participants who lost5% (classified as exercise responders) and<5% (non-responders) in body fat (assessed by dual-energy X-ray absorptiometry).
Results
Training decreased body fat percentage by (mean; 95% CI) -2.3%; -5.3, 0.7% in women with PCOS and by -6.4%; -10.9, -1.9% in women without PCOS (P = 0.08). Ten women (7 PCOS; 3 without PCOS) did not reduce body fat by5%. All participants improved VO2 peak (mean change 27%; 16–39%) but four (2 PCOS; 2 without PCOS) demonstrated decreases in GIR/FFM (mean change for whole cohort: 37%; 3–71%). Android-gynoid fat a1111111111 a1111111111 a1111111111 a1111111111 a1111111111 OPEN ACCESS
Citation: Scott D, Harrison CL, Hutchison S, de
Courten B, Stepto NK (2017) Exploring factors related to changes in body composition, insulin sensitivity and aerobic capacity in response to a 12-week exercise intervention in overweight and obese women with and without polycystic ovary
syndrome. PLoS ONE 12(8): e0182412.https://doi.
org/10.1371/journal.pone.0182412
Editor: Conrad P. Earnest, Texas A&M University,
UNITED STATES
Received: February 8, 2017
Accepted: July 7, 2017
Published: August 3, 2017
Copyright:©2017 Scott et al. This is an open access article distributed under the terms of the
Creative Commons Attribution License, which permits unrestricted use, distribution, and reproduction in any medium, provided the original author and source are credited.
Data Availability Statement: All relevant data are
within the paper and its Supporting Information files.
Funding: This study was supported by a National
ratio (0.58; 0.51, 0.66 vs 0.46; 0.40, 0.51; P<0.01) was significantly higher and GIR/FFM (6.69; 3.49, 9.90 vs 11.44; 9.15, 13.72 mg/kg/min; P = 0.01) was significantly lower in non-responders compared with non-responders at baseline, but non-non-responders had significant post-training decreases in android-gynoid ratio (-0.02; -0.04, -0.01; P = 0.03), and increases in VO2peak (7.24; 2.28, 12.21 mL/kg/min; P = 0.01) and GIR/FFM (1.44; 0.27, 2.61 mg/kg/ min; P = 0.02). In women with PCOS, pre-training VO2peak was significantly negatively cor-related with change in total body fat (r = -0.75; P = 0.02), and pre-training fasting glucose negatively correlated with changes in VO2peak (r = -0.76; P = 0.04), but positively corre-lated with changes in GIR (r = 0.67; P = 0.046).
Conclusion
A high proportion of overweight and obese women with PCOS had small reductions in body fat following a 12-week exercise intervention, but nevertheless significantly reduced relative central adiposity and improved aerobic capacity and insulin sensitivity.
Introduction
Polycystic ovary syndrome (PCOS) affects up to one in five reproductive-aged women in Aus-tralia and is associated with reproductive dysfunction, as well as metabolic consequences
including obesity, type 2 diabetes and cardiovascular disease [1]. Given the known benefits of
exercise targeting weight loss for preventing and reversing cardiometabolic conditions,
exer-cise is recommended as an important therapy for women with PCOS [2,3]. However, we
pre-viously reported that a 12-week moderate to vigorous intensity exercise program failed to normalise insulin sensitivity in overweight women with PCOS compared to overweight
women without PCOS [4]. Women with PCOS have also been observed to have significantly
smaller increases in growth hormone in response to exercise than controls [5].
Poor exercise responsiveness appears highly heritable [6] and may affect around 10% of
exercise participants in the general population [7]. However, modifiable factors, including
higher body fat and insulin resistance are common in women with PCOS [8,9], and may
increase risk for poor exercise responsiveness in this population. It has been reported that 15–
20% of individuals with type 2 diabetes [10], and as many as 40% of middle-aged individuals at
high risk of type 2 diabetes [11], experience minimal improvements in metabolic health
fol-lowing exercise. Furthermore, higher total body fat mass is associated with smaller improve-ments in physical function following an exercise intervention, irrespective of exercise
adherence in overweight and obese older adults [12]. It has been observed in overweight
post-menopausal women however that aerobic capacity significantly increases in response to
exer-cise even in those who do not reduce fat mass substantially [13]. Thus, although PCOS women
tend to have higher amounts of body fat [14], it is unclear whether this may also attenuate
exercise benefits and whether differences in body fat distribution are more important than overall body fat for exercise responsiveness.
The aims of this secondary analysis of a 12-week exercise intervention in overweight women with and without PCOS to determine factors associated with differential changes in body fat, insulin resistance and aerobic capacity following a 12-week exercise intervention in overweight and obese women with and without PCOS.
National Heart Foundation Fellowship (100864). The funders had no role in study design, data collection and analysis, decision to publish, or preparation of the manuscript.
Competing interests: The authors have declared
Material and methods
Study design and participants
This study was a secondary analysis of a 12-week exercise intervention for overweight and
obese (BMI>25 kg/m2) and inactive (<100 minutes per week of self-reported moderate and
vigorous physical activity) women. Participants constituted a subset of a cross-sectional study
of pre-menopausal women with and without PCOS [4,9,15] and were recruited through
com-munity advertisements. The Monash Health Research Advisory and Ethics Committee approved the study and participants gave written informed consent. All investigations were conducted according to the principles expressed in the Declaration of Helsinki. The trial was registered previously (ISRCTN84763265).
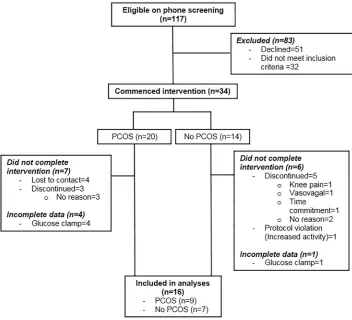
As described inFig 1, 117 women were initially screened of whom 34 (n = 20 with PCOS;
n = 14 without PCOS) were eligible and consented to the exercise intervention. Thirteen PCOS and eight non-PCOS women completed the study, and amongst these 16 (9 with PCOS and 7 without PCOS) had complete body composition and insulin sensitivity data for this sec-ondary analysis. Diagnosis of PCOS was undertaken by endocrinologists (S.K.H.) based on meeting NIH criteria with demonstrating irregular menstrual cycles (21 or 35 days) and clini-cal (hirsutism, acne) or biochemiclini-cal (elevation of at least one circulating ovarian androgen) hyperandrogenism. As these women were not assessed for polycystic ovaries on ultrasound,
they still meet the Rotterdam criteria but exact phenotype was unknown [16].
Fig 1. Consolidated Standards of Reporting Trials (CONSORT) flowchart describing progress through the study.
Hyperprolactinemia, thyroid dysfunction and specific adrenal disorders were excluded clini-cally and where indicated, biochemiclini-cally. All women without PCOS had regular menses and
no evidence of clinical or biochemical hyperandrogenism. Exclusion criteria were age<20 or
>40 years, lipid-lowering agents, smoking, diabetes, recent weight change of 5 kilograms or
more in the previous six months, actively trying to lose weight and pregnancy.
At screening, standard diet and lifestyle advice were delivered based on recommendations
provided by the National Heart Foundation of Australia (www.heartfoundation.com.au) [17].
Medications known to affect end-points, including insulin sensitisers, anti- androgens and hormonal contraceptives were ceased three-months prior to baseline. All data were collected in the follicular phase for women without PCOS in order to minimise potential impact of female reproductive hormones on study outcomes. However, as women with PCOS had irreg-ular menses they were measured at times convenient to participants.
Exercise intervention
Participants undertook 12 weeks of supervised, progressive, moderate and vigorous exercise
training on a motorised treadmill [4,15,18]. Participants attended three 45–60 min sessions
supervised by study staff each week, which sequentially alternated between moderate-intensity
(20–60 minutes of walking or jogging at 75–80% of maximal heart rate [HRmax]) and
high-intensity interval training (six to eight five-minute intervals at*95–100% HRmaxwith
two-minute passive recovery periods). Participants progressed to eight repetitions by week four and reduced recovery time to 1 minute by week eight. Target exercise heart rates were achieved
by altering speed and incline on the treadmill according to individual fitness [15]. Exercise
adherence was assessed by recording the number of sessions attended, and indicators of exer-cise compliance were recorded, including total duration of exerexer-cise, total distance covered and average heart rate assessed by heart rate monitors (Polar Electro Oy, Kempele, Finland).
Measurements
All measurements were obtained by study staff blinded to the PCOS status of participants. Body weight and height were assessed and body mass index (BMI) calculated as weight (kilo-grams) divided by height (metres) squared. Total body fat mass and fat-free mass, and android and gynoid, fat mass were estimated by a whole-body dual energy X-ray absorptiometry (DXA) scan (GE Lunar Prodigy, GE Lunar Corp, Madison WI, USA; operating system version
9). VO2peak was assessed during a graded exercise test (GXT) on a motorised treadmill
(Bio-dex RTM 500, New York, USA) treadmill until volitional fatigue. Expired gases were collected and analysed during the GXT using the MOXUS modular system (AEI Technologies, Pitts-burgh, PA, USA). The Moxus was calibrated prior to each test with known gases (16% O2; 4% CO2; BOC gases Australia) and volume (3L Hans Rudolph syringe).
The primary outcome was insulin sensitivity as measured by glucose infusion rate (mg/m2/
min) assessed by the euglycaemic–hyperinsulinaemic clamp technique as previously described
[15]. Clamp timing was standardised to 48 h after exercise and following a standardised
high-carbohydrate diet for 72 hours before an overnight fast. Insulin (Actrapid; Novo Nordisk,
Bagsvaerd, Denmark) was infused at 40 mU/m2min for 120 min, with plasma glucose
main-tained at*5 mmol/L using variable infusion rates of 25% glucose. Glucose infusion rate
(GIR) was calculated during steady state, achieved in the last 30 minutes of the clamp and expressed as glucose (mg) per kg of fat free mass per min (GIR/FFM). Stored blood samples (-80˚C) were batch analysed for plasma fasting glucose and insulin, homeostatic model
Statistical analyses
Prior to analyses, data were assessed for normality by Shapiro-Wilk tests stratified by PCOS status and fasting insulin and HOMA-IR were log transformed. Independent samples t-tests
compared changes in total body fat and VO2peak from pre- to post-training in women with
and without PCOS. Independent samples t-tests and paired t-tests compared pre- and
post-exercise values for body composition, VO2peak, and indicators of insulin resistance and
exer-cise compliance in women defined as exerexer-cise ‘responders’ (5% decrease in total body fat)
versus ‘non-responders’ (<5% decrease in total body fat) following training [13], and a
chi-square test compared proportions with and without PCOS. Pearson correlations stratified by PCOS status examined associations of pre-training participant characteristics with
post-train-ing changes in body composition, VO2peak and indicators of insulin resistance. All statistical
analyses were performed using SPSS version 23.0 (IBM, USA) and P-values<0.05 were
con-sidered statistically significant.
Results
Compared with the 18 participants who were excluded due to non-completion or missing data (Table 1), the 16 included participants were of similar age (mean; 95% CI) (32.1 years; 29.4, 34.8
vs 32.1 years; 28.9, 35.3; P = 0.99), BMI (34.9 kg/m2; 31.9, 37.9 vs 36.29 kg/m2; 32.9, 39.4;
P = 0.55), and GIR/FFM (9.39; 7.02, 11.76 mg/kg/min vs 8.47; 6.13, 10.81 mg/kg/min; P = 0.56). The majority of excluded participants were lost to contact (could not be contacted by phone or email; 4) or refused to continue (due to time commitment; 1, vasovagal episode; 1, knee sore-ness; 1, or no reason given; 5) in the exercise intervention by week six of the intervention. One participant who completed the intervention was excluded due to a protocol violation (com-menced significant sustained physical activity outside the intervention), and five had
incom-plete GIR/FFM data at baseline or follow-up (Fig 1). Amongst the included participants, four (3
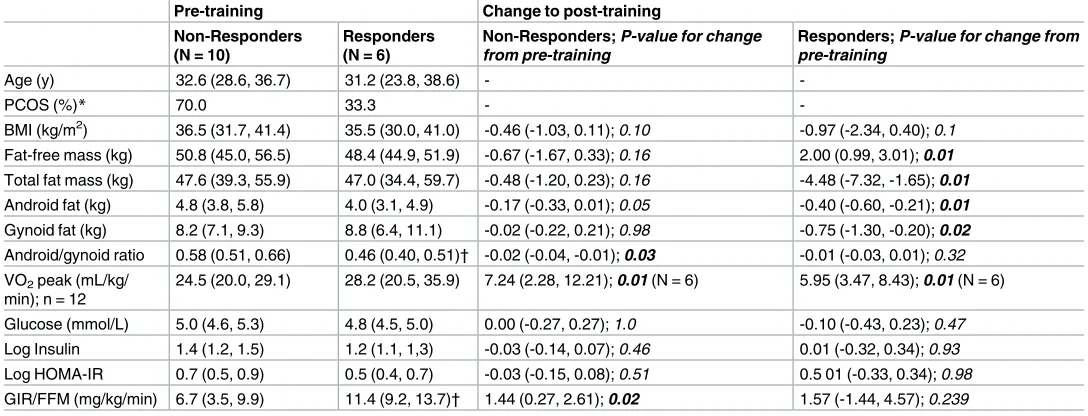
Table 1. Comparison of pre-training and post-training values for body composition and cardiometabolic parameters according to exercise responsiveness.
Pre-training Change to post-training
Non-Responders (N = 10)
Responders (N = 6)
Non-Responders; P-value for change from pre-training
Responders; P-value for change from pre-training
Age (y) 32.6 (28.6, 36.7) 31.2 (23.8, 38.6) -
-PCOS (%)* 70.0 33.3 -
-BMI (kg/m2) 36.5 (31.7, 41.4) 35.5 (30.0, 41.0) -0.46 (-1.03, 0.11); 0.10 -0.97 (-2.34, 0.40); 0.1
Fat-free mass (kg) 50.8 (45.0, 56.5) 48.4 (44.9, 51.9) -0.67 (-1.67, 0.33); 0.16 2.00 (0.99, 3.01); 0.01 Total fat mass (kg) 47.6 (39.3, 55.9) 47.0 (34.4, 59.7) -0.48 (-1.20, 0.23); 0.16 -4.48 (-7.32, -1.65); 0.01 Android fat (kg) 4.8 (3.8, 5.8) 4.0 (3.1, 4.9) -0.17 (-0.33, 0.01); 0.05 -0.40 (-0.60, -0.21); 0.01 Gynoid fat (kg) 8.2 (7.1, 9.3) 8.8 (6.4, 11.1) -0.02 (-0.22, 0.21); 0.98 -0.75 (-1.30, -0.20); 0.02 Android/gynoid ratio 0.58 (0.51, 0.66) 0.46 (0.40, 0.51)† -0.02 (-0.04, -0.01); 0.03 -0.01 (-0.03, 0.01); 0.32 VO2peak (mL/kg/
min); n = 12
24.5 (20.0, 29.1) 28.2 (20.5, 35.9) 7.24 (2.28, 12.21); 0.01 (N = 6) 5.95 (3.47, 8.43); 0.01 (N = 6)
Glucose (mmol/L) 5.0 (4.6, 5.3) 4.8 (4.5, 5.0) 0.00 (-0.27, 0.27); 1.0 -0.10 (-0.43, 0.23); 0.47 Log Insulin 1.4 (1.2, 1.5) 1.2 (1.1, 1,3) -0.03 (-0.14, 0.07); 0.46 0.01 (-0.32, 0.34); 0.93 Log HOMA-IR 0.7 (0.5, 0.9) 0.5 (0.4, 0.7) -0.03 (-0.15, 0.08); 0.51 0.5 01 (-0.33, 0.34); 0.98 GIR/FFM (mg/kg/min) 6.7 (3.5, 9.9) 11.4 (9.2, 13.7)† 1.44 (0.27, 2.61); 0.02 1.57 (-1.44, 4.57); 0.239
All data are mean (95% CI) unless otherwise specified. *Chi-square test
†
Significantly different from non-responders (P = 0.01).
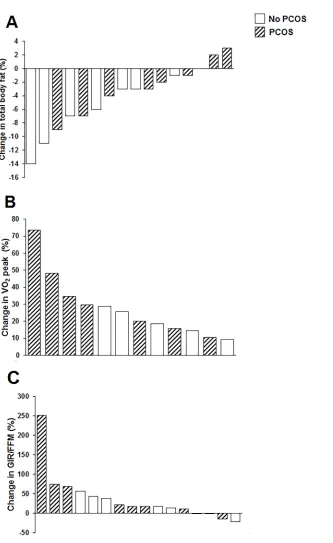
with PCOS, 1 without PCOS) did not have exercise tests either at baseline or follow-up and so
were excluded from analyses of change in VO2peak. As demonstrated by the body fat, VO2
peak and GIR/FFM changes reported inFig 2, there was a wide range of individual responses to
the exercise program. Ten (7 with PCOS and 3 without PCOS; P = 0.2) participants did not
Fig 2. Individual participant changes in total body fat (A), VO2peak (B) and GIR/FFM (C) from pre- to
post-training according to PCOS status.
reduce their body fat by5%, and were classified as non-responders. Training decreased body fat percentage by -2.3%; -5.3, 0.7% in women with PCOS and by -6.4%; -10.9, -1.9% in women without PCOS (P-value for difference between groups = 0.08). Participants with PCOS lost less gynoid fat compared with participants without PCOS (-0.02; -0.29, 0.24 kg vs -0.62; -1.14, -0.09
kg; P = 0.02). Conversely, all participants improved VO2peak (27%; 16–39%) with no
signifi-cant differences between women with PCOS and those without (P = 0.21). Four (2 with PCOS; 2 without PCOS) participants demonstrated no improvement in GIR/FFM (mean change for whole cohort: 37%; 3–71%) with no significant difference between groups (P = 0.39).
Baseline participant characteristics for exercise responders and non-responders defined
according to body fat changes are presented inTable 1. There were no differences in mean age
or PCOS status between groups. There were also no differences in total body fat, android and gynoid fat mass, however android-gynoid ratio was significantly higher in non-responders. Measures of insulin sensitivity were generally similar but GIR/FFM was significantly lower in
non-responders at baseline.Table 1also presents post-training values for body composition
and indicators of insulin sensitivity according to exercise responsiveness. Total body fat, android fat and gynoid fat were significantly decreased post-training in responders, although the decrease in android fat in non-responders was of borderline significance (P = 0.05). Non-responders had a significant decrease in android-gynoid ratio post-training. Both Non-responders
and non-responders demonstrated a significant increase in VO2peak, while only
non-responders had significant increases in insulin sensitivity as measured by GIR.
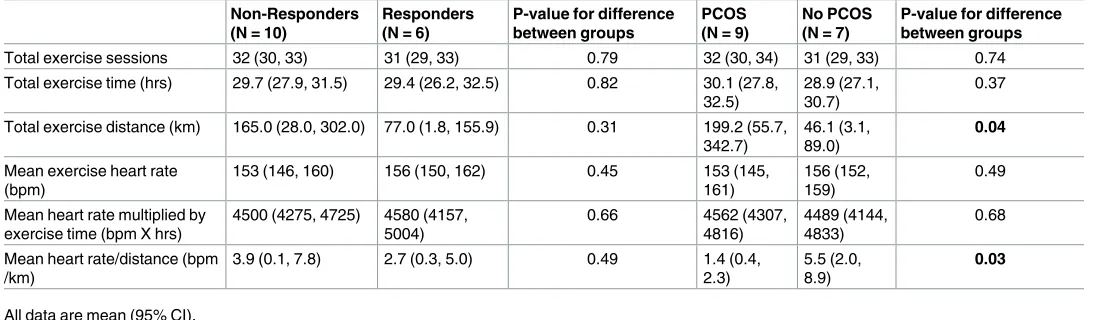
As demonstrated inTable 2, there were no differences between responders and
non-responders for exercise compliance or indicators of exercise workload. Women with PCOS covered significantly higher mean distance than women without PCOS for the duration of the intervention, however exercise workload (calculated as heart rate divided by distance covered (bpm/km), was significantly higher in women without PCOS.
Pearson correlations were performed to examine associations of baseline characteristics and exercise adherence/compliance in women with and without PCOS who completed the
intervention, and changes in body composition, VO2peak and indicators of insulin sensitivity
from pre- to post-training. In women without PCOS, age was significantly positively correlated with changes in fasting insulin in response to training (r = 0.76; P = 0.047) while higher total body fat (r = -0.82; P = 0.03) and gynoid fat (r = -0.82; P = 0.03) at baseline were negatively cor-related with changes in fasting glucose, and gynoid fat was also negatively corcor-related with
Table 2. Comparison of indicators of exercise adherence and compliance during the 12-week exercise intervention according to exercise respon-siveness and PCOS status.
Non-Responders (N = 10)
Responders (N = 6)
P-value for difference between groups
PCOS (N = 9)
No PCOS (N = 7)
P-value for difference between groups
Total exercise sessions 32 (30, 33) 31 (29, 33) 0.79 32 (30, 34) 31 (29, 33) 0.74 Total exercise time (hrs) 29.7 (27.9, 31.5) 29.4 (26.2, 32.5) 0.82 30.1 (27.8,
32.5)
28.9 (27.1, 30.7)
0.37
Total exercise distance (km) 165.0 (28.0, 302.0) 77.0 (1.8, 155.9) 0.31 199.2 (55.7, 342.7)
46.1 (3.1, 89.0)
0.04
Mean exercise heart rate (bpm)
153 (146, 160) 156 (150, 162) 0.45 153 (145, 161)
156 (152, 159)
0.49
Mean heart rate multiplied by exercise time (bpm X hrs)
4500 (4275, 4725) 4580 (4157, 5004)
0.66 4562 (4307, 4816)
4489 (4144, 4833)
0.68
Mean heart rate/distance (bpm /km)
3.9 (0.1, 7.8) 2.7 (0.3, 5.0) 0.49 1.4 (0.4, 2.3)
5.5 (2.0, 8.9)
0.03
All data are mean (95% CI).
change in gynoid fat (r = -0.77; P = 0.04). Baseline VO2peak was negatively correlated with
changes in android-gynoid fat ratio in women without PCOS (r = -0.97; P = 0.01). None of the baseline characteristics or exercise adherence/compliance indicators were associated with
change in VO2peak in women without PCOS (all P>0.05). Total number of exercise sessions
was negatively correlated with change in fasting glucose (-0.76; P = 0.049).
As demonstrated inFig 3A, baseline VO2peak was significantly negatively correlated with
change in total body fat in women with PCOS, but not those without PCOS (two without
PCOS had missing VO2peak data at baseline). Baseline VO2peak was also negatively
corre-lated with change in gynoid fat (r = -0.69; P = 0.04) in women with PCOS. Baseline total body (r = -0.67; P = 0.048) and gynoid (r = -0.73; P = 0.03) fat were negatively correlated with change in android-gynoid ratio. Conversely, baseline android fat (r = 0.70; P = 0.04) and
Fig 3. Pearson correlations for associations of baseline VO2 peak with change in body fat (A) and for baseline fasting glucose with change in GIR/FFM (B) according to PCOS status.
android-gynoid ratio (r = 0.72; P = 0.03) were positively correlated with change in gynoid fat.
Baseline fasting glucose was negatively correlated with change in VO2peak (r-0.76; P = 0.046)
but also negatively correlated with change in glucose (r = -0.76; P = 0.02), and positively
corre-lated with change in GIR/FFM (Fig 3B). The only association observed between exercise
adherence and compliance indicators and exercise responsiveness in women with PCOS was a
positive correlation between total exercise distance and change in VO2peak (0.82; P = 0.044).
Discussion
The primary findings of this secondary analysis of a 12-week intensified exercise intervention in overweight and obese women with and without PCOS was a substantial variation in insulin sensitivity, body fat and aerobic capacity changes in response to exercise, and although all
par-ticipants improved VO2peak (indicating improved fitness), approximately one–quarter did
not improve insulin sensitivity and two-thirds did not reduce body fat by5%. Although
pre-vious research has suggested that exercise non-responsiveness can be overcome by increasing
exercise dose [19], we found few associations between indicators of exercise compliance and
workload with study outcomes. Rather, high fasting glucose was associated with poorer
improvements in VO2peak, while lower baseline VO2peak, higher relative central adiposity
and lower insulin sensitivity at baseline were all associated with smaller fat losses. Nevertheless, despite smaller declines in total body fat, exercise non-responders significantly reduced rela-tive central adiposity and improved aerobic capacity and insulin sensitivity. These findings suggest that overweight and obese women with and without PCOS can obtain health benefits from short-term exercise interventions even in the absence of significant body fat losses.
Women who failed to significantly reduce body fat in this study had significantly higher baseline android-gynoid ratios and lower GIR/FFM pre-training than exercise responders, and these associations are likely to be inter-related. In a recent study of normal weight PCOS women, intra-, but not subcutaneous, abdominal fat was positively associated with fasting
insulin [20], supporting the concept that ectopic fat depots are more closely associated with
cardiometabolic health than subcutaneous depots [21]. A systematic review has demonstrated
that 15–20% of individuals with type 2 diabetes mellitus fail to improve metabolic health in
response to supervised exercise programs [10], suggesting that dysregulation of glucose
homeostasis (i.e high blood sugar levels, low insulin secretion and/or reduced insulin sensitiv-ity) may be associated with poor exercise responsiveness in terms of body composition changes. Individuals at high risk of developing type 2 diabetes who fail to improve insulin sen-sitivity in response to an exercise program have increased transforming growth factor (TGF)-β activity in skeletal muscle, suggesting inflammation may contribute to poorer improvements
on mitochondrial fuel oxidation and insulin sensitivity in this population [11]. Resistance to
the beneficial effects of exercise has been shown to be highly heritable, with heritability
esti-mates of almost 50% for VO2peak in responses to exercise training [6]. However, the findings
of the present study suggest adjunct therapies which improve insulin sensitivity and body com-position, such as caloric restriction, may enhance metabolic exercise responses in overweight and obese women.
Despite losing small amounts of body fat following the 12-week exercise intervention, non-responders demonstrated significant decreases in android-gynoid ratio. This highlights that women who lose small amounts of fat in response to exercise may still undergo a shift to a
more metabolically healthy body composition, and is supported by the finding that VO2peak
[13]. Also similar to our study, the previous study observed higher BMI to be a predictor of poor responsiveness, although they did not assess differences in body fat deposition.
Neverthe-less, the investigators reported that primary outcomes including muscle strength and VO2
peak increased similarly for responders and non-responders [13]. These findings indicate that
loss of body fat is not a limiting factor in improving aerobic capacity and insulin sensitivity in women in response to exercise, and highlight the need to focus on end-points other than body weight in interventions targeting overweight and obese individuals.
Several baseline characteristics were observed to be correlated with exercise-induced changes in body composition and indicators of insulin sensitivity in women with PCOS, yet these associations were somewhat controversial. For example, higher baseline total body and gynoid fat were associated with greater declines in android-gynoid ratio, but higher baseline android fat and android-gynoid ratio were associated with smaller declines in gynoid fat. These conflicting findings are consistent with the concept that not all individuals are similarly responsive to exercise training and potentially indicate that multi-component lifestyle modifi-cation programs may be most beneficial for women with PCOS. For example, a 16-week pro-gram of combined caloric restriction, behavioural modification, physical activity, and (for obese women) weight loss medication, resulted in weight loss of over 6% in women with
PCOS [22], which is greater than the 2% weight loss observed in our intervention involving
exercise only [4]. Nevertheless, our findings have demonstrated that insulin resistance and
aer-obic capacity can improve in response to exercise even when fat does not substantially decrease.
Higher baseline VO2peak was associated with greater declines in total and gynoid fat in
women with PCOS, which was somewhat surprising given improvements might be expected to be greater in those with the poorest cardiorespiratory fitness at baseline. Somewhat
contro-versially, higher baseline fasting glucose was associated with smaller increases in VO2peak but
also with greater declines in fasting glucose, and greater increases in insulin sensitivity. The
association of higher fasting glucose with smaller increases in VO2peak may be reflective of
the fact that higher levels of inflammatory markers and visceral fat are associated with lower
VO2peak in women with PCOS [23], but is unexpected given that insulin sensitivity appeared
to be more likely to improve in women with PCOS who had higher fasting glucose at baseline. This may demonstrate that improvements in insulin sensitivity in response to exercise in women with PCOS do not necessarily associate with significant improvements in aerobic capacity.
Only the number of exercise sessions attended and average heart rate achieved were predic-tors for improvements in insulin sensitivity in women without PCOS. On the other hand, total distance covered during the intervention was associated with improvements in aerobic capac-ity in women with PCOS. A previous six-month exercise intervention also demonstrated improvements in aerobic capacity in women with PCOS who were most compliant with
train-ing [24]. Interestingly, while we observed that women with PCOS covered significantly more
distance than those without PCOS in this intervention, the actual intensity or workload of exercise appeared to be significantly lower. Given that a previous study suggests that increasing
exercise dose can abolish non-responsiveness [19], these findings highlight the need to
maxi-mise lifestyle program compliance and retention in women with PCOS [25], and suggest that
during training, motivational strategies that ensure higher levels of exertion are likely to be beneficial.
did not identify any differences in characteristics of included and excluded participants. The sample size had only 79% power to detect a 10% difference in the primary outcome of insulin sensitivity between exercise responders and non-responders (based on body fat change) sug-gesting that it may have been inadequate to detect significant differences in other outcomes. However, we observed 90% adherence amongst those who completed the exercise intervention
with no significant differences between women with and without PCOS [4], or between
exer-cise responders and non-responders. Furthermore, participants who completed the interven-tion demonstrated 95% compliance to prescribed progressions in the exercise. We conducted a short-term exercise intervention and it is unclear whether interventions of longer duration would demonstrate similar associations between baseline characteristics and exercise non-responsiveness. Nevertheless, an analysis of six exercise interventions with a minimum dura-tion of four months reported substantial propordura-tions of metabolic non-responders in all stud-ies, suggesting increasing the duration of an exercise intervention is not sufficient to overcome
exercise non-responsiveness [7]. The strengths of our study include the gold-standard
assess-ments for body composition and insulin resistance, as well as objective assessassess-ments of exercise adherence and compliance.
Conclusions
Although a high proportion of overweight and obese women with PCOS had small reductions in total body fat following a 12-week exercise intervention, these exercise non-responders sig-nificantly reduced relative central adiposity and improved aerobic capacity and insulin sensi-tivity. Women with PCOS should be encouraged that participation in exercise, regardless of the effect on body composition, it can result in significant improvements in metabolic health.
Supporting information
S1 File. Study protocol. Description of the protocol for this study.
(PDF)
S2 File. TREND checklist. Transparent Reporting of Evaluations with Nonrandomized
Designs (TREND) Statement and Checklist for the current study. (PDF)
S3 File. Database. Pre- and post-training data for included study participants.
(XLSX)
Acknowledgments
We thank Prof Boyd Strauss and staff for providing body composition measures and analysis, and the study volunteers for their contribution to this research.
Author Contributions
Conceptualization: Barbora de Courten, Nigel K. Stepto.
Data curation: Cheryce L. Harrison, Samantha Hutchison.
Formal analysis: David Scott.
Funding acquisition: Barbora de Courten, Nigel K. Stepto.
Methodology: Cheryce L. Harrison, Samantha Hutchison.
Supervision: Barbora de Courten, Nigel K. Stepto.
Writing – original draft: David Scott.
Writing – review & editing: David Scott, Cheryce L. Harrison, Samantha Hutchison, Barbora
de Courten, Nigel K. Stepto.
References
1. Teede HJ, Misso ML, Deeks AA, Moran LJ, Stuckey B, Wong J, et al. Assessment and management of polycystic ovary syndrome: summary of an evidence-based guideline. Med J Aust. 2011; 195(6):S65. PMID:21929505
2. Moran LJ, Hutchison SK, Norman RJ, Teede HJ. Lifestyle changes in women with polycystic ovary syn-drome. Cochrane Database Syst Rev. 2011;(2).https://doi.org/10.1002/14651858.CD007506.pub2 3. Harrison CL, Lombard CB, Moran LJ, Teede HJ. Exercise therapy in polycystic ovary syndrome: a
sys-tematic review. Hum Reprod Update. 2011; 17(2):171–83.https://doi.org/10.1093/humupd/dmq045
PMID:20833639
4. Harrison CL, Stepto NK, Hutchison SK, Teede HJ. The impact of intensified exercise training on insulin resistance and fitness in overweight and obese women with and without polycystic ovary syndrome. Clin Endocrinol (Oxf). 2012; 76(3):351–7.
5. Jaatinen TA, Anttila L, Erkkola R, Koskinen P, Laippala P, Ruutiainen K, et al. Hormonal responses to physical exercise in patients with polycystic ovarian syndrome. Fertil Steril. 1993; 60(2):262–7. PMID:
8339821.
6. Bouchard C, An P, Rice T, Skinner JS, Wilmore JH, Gagnon J, et al. Familial aggregation of VO2 max response to exercise training: results from the HERITAGE Family Study. J Appl Physiol. 1999; 87 (3):1003–8. PMID:10484570
7. Bouchard C, Blair SN, Church TS, Earnest CP, Hagberg JM, Ha¨kkinen K, et al. Adverse metabolic response to regular exercise: is it a rare or common occurrence? PLoS ONE. 2012; 7(5):e37887.
https://doi.org/10.1371/journal.pone.0037887PMID:22666405
8. Cassar S, Misso ML, Hopkins WG, Shaw CS, Teede HJ, Stepto NK. Insulin resistance in polycystic ovary syndrome: a systematic review and meta-analysis of euglycaemic—hyperinsulinaemic clamp studies. Human Reproduction. 2016; 31(11):2619–31.https://doi.org/10.1093/humrep/dew243PMID:
27907900
9. Stepto NK, Cassar S, Joham AE, Hutchison SK, Harrison CL, Goldstein RF, et al. Women with polycys-tic ovary syndrome have intrinsic insulin resistance on euglycaemic—hyperinsulaemic clamp. Hum Reprod. 2013; 28(3):777–84.https://doi.org/10.1093/humrep/des463PMID:23315061
10. Stephens NA, Sparks LM. Resistance to the beneficial effects of exercise in Type 2 diabetes: Are some individuals programmed to fail? J Clin Endocrinol Metab. 2014; 100(1):43–52.
11. Bo¨hm A, Hoffmann C, Irmler M, Schneeweiss P, Schnauder G, Sailer C, et al. TGF-βContributes to Impaired Exercise Response by Suppression of Mitochondrial Key Regulators in Skeletal Muscle. Dia-betes. 2016; 65(10):2849–61.https://doi.org/10.2337/db15-1723PMID:27358493
12. Chmelo EA, Crotts CI, Newman JC, Brinkley TE, Lyles MF, Leng X, et al. Heterogeneity of physical function responses to exercise training in older adults. J Am Geriatr Soc. 2015; 63(3):462–9.https://doi. org/10.1111/jgs.13322PMID:25752778
13. Myette-Coˆte´ E´ , Archambault-Therrien C, Brochu M, Dionne IJ, Riesco E. Physical fitness improvement in overweight postmenopausal women who do not lose fat mass in response to exercise training. Meno-pause (New York, NY). 2016.
14. Douchi T, Ijuin H, Nakamura S, Oki T, Yamamoto S, Nagata Y. Body fat distribution in women with poly-cystic ovary syndrome. Obstet Gynecol. 1995; 86(4 Pt 1):516–9. Epub 1995/10/01. PMID:7675372.
15. Hutchison SK, Stepto NK, Harrison CL, Moran LJ, Strauss BJ, Teede HJ. Effects of exercise on insulin resistance and body composition in overweight and obese women with and without polycystic ovary syndrome. The Journal of Clinical Endocrinology & Metabolism. 2011; 96(1):E48–E56.
16. Revised 2003 consensus on diagnostic criteria and long-term health risks related to polycystic ovary syndrome. Fertil Steril. 2004; 81(1):19–25. PMID:14711538
17. Meyer C, McGrath BP, Teede HJ. Effects of medical therapy on insulin resistance and the cardiovascu-lar system in polycystic ovary syndrome. Diabetes Care. 2007; 30(3):471–8.https://doi.org/10.2337/ dc06-0618PMID:17327307
with and without polycystic ovary syndrome. Diabetologia. 2012; 55(5):1424–34.https://doi.org/10. 1007/s00125-011-2442-8PMID:22246378.
19. Montero D, Lundby C. Refuting the myth of non-response to exercise training: ‘non-responders’ do respond to higher dose of training. J Physiol. 2017;https://doi.org/10.1113/JP273480PMID:28133739 20. Dumesic DA, Akopians AL, Madrigal VK, Ramirez E, Margolis DJ, Sarma MK, et al. Hyperandrogenism
Accompanies Increased Intra-Abdominal Fat Storage In Normal Weight Polycystic Ovary Syndrome Women. J Clin Endocrinol Metab. 2016:jc. 2016–586.
21. Britton KA, Fox CS. Ectopic fat depots and cardiovascular disease. Circulation. 2011; 124(24):e837– e41.https://doi.org/10.1161/CIRCULATIONAHA.111.077602PMID:22156000
22. Legro RS, Dodson WC, Kris-Etherton PM, Kunselman AR, Stetter CM, Williams NI, et al. Randomized Controlled Trial of Preconception Interventions in Infertile Women With Polycystic Ovary Syndrome. J Clin Endocrinol Metab. 2015; 100(11):4048–58.https://doi.org/10.1210/jc.2015-2778PMID:26401593 23. Giallauria F, Palomba S, De Sio I, Maresca L, Vuolo L, Savastano S, et al. Inflammatory markers and
visceral fat are inversely associated with maximal oxygen consumption in women with polycystic ovary syndrome (PCOS). Clin Endocrinol (Oxf). 2009; 70(3):394–400.
24. Randeva HS, Lewandowski KC, Drzewoski J, Brooke-Wavell K, O’Callaghan C, Czupryniak L, et al. Exercise decreases plasma total homocysteine in overweight young women with polycystic ovary syn-drome. J Clin Endocrinol Metab. 2002; 87(10):4496–501.https://doi.org/10.1210/jc.2001-012056
PMID:12364425