University of South Carolina
Scholar Commons
Theses and Dissertations
2017
Structural and Functional Studies of Proteins from
the Agricultural Pests Tetranychus Urticae and
Aspergillus Fumigatus
Caleb Schlachter University of South Carolina
Follow this and additional works at:https://scholarcommons.sc.edu/etd
Part of theChemistry Commons
This Open Access Dissertation is brought to you by Scholar Commons. It has been accepted for inclusion in Theses and Dissertations by an authorized administrator of Scholar Commons. For more information, please [email protected].
Recommended Citation
S
TRUCTURAL AND FUNCTIONAL STUDIES OF PROTEINS FROM THE AGRICULTURAL PESTST
ETRANYCHUS URTICAE ANDA
SPERGILLUS FUMIGATUSby
Caleb Schlachter
Bachelor of Science University of Tennessee, 2011
Submitted in Partial Fulfillment of the Requirements
For the Degree of Doctor of Philosophy in
Chemistry
College of Arts and Sciences
University of South Carolina
2017
Accepted by:
Maksymilian Chruszcz, Major Professor
Thomas Makris, Committee Member
Linda Shimizu, Committee Member
Gregorio Gomez, Committee Member
ACKNOWLEDGEMENTS
First and foremost, I would like to acknowledge and thank Dr. Maksymilian
Chruszcz for accepting me into his lab and providing wonderful guidance and wisdom
throughout my graduate career. I would like to acknowledge Dr. Thomas Makris and Jose
Amaya for all the insight they provided on some projects not mentioned in this publication.
I would like to acknowledge Dr. Leslie Lovelace and Dr. Amy Taylor-Perry for giving me
my preferred Teaching Assistantships. I would like to acknowledge my former and current
labmates: Dr. Lesa Offermann, Dr. Nick Mank, Dr. William Booth, Nikita Ussin, Swanandi
Pote, Brenda Kapingidza and Leily Daneshian. I would like to thank my former and current
undergraduates for their patience and help with crystallization: Vincent Klapper, Taylor
Radford, Josh Burgess and Anna Bagnell. I would like to acknowledge my friends and
family for their continued support. I would like to acknowledge the University of South
Carolina for providing me with several opportunities to present my research at conferences,
and for awarding me the SPARC Grant. Lastly, I would like to acknowledge and thank the
members of my committee: Dr. Thomas Makris, Dr. Linda Shimizu, Dr. Gregorio Gomez
ABSTRACT
Agricultural pests are a worldwide problem and cause billions of dollars in crop
loss. In the United States alone, an estimated $40 billion USD is lost per year due to
insecticide resistance [1]. Studied here are proteins (potentially new pesticide targets) from
the agricultural pests Tetranychus urticae and Aspergillus fumigatus. T. urticae, or two-spotted spidermite, is a polyphagous pest, and three proteins from this pest, a cyanase, a
glutathione S-transferase and an intradiol ring-cleavage dioxygenase are described [2].
Cyanase is involved in the conversion of bicarbonate and cyanate, a toxic self-defense
metabolite produced by plants, into ammonia and carbon dioxide. Glutathione
S-transferase conjugates reduced glutathione to xenobiotics for detoxification and have been
associated with insecticide resistance [3]. Intradiol ring-cleavage dioxygenase is involved
in the breakdown and metabolism of toxic aromatic compounds.
Furthermore, A. fumigatus is a ubiquitous fungus that is not only a problem in agriculture, but also in healthcare. A. fumigatus drug resistance is becoming more prominent which is mainly attributed to the widespread use of fungicides in agriculture [4].
The 2-methylcitrate cycle, which is only present in fungi, is responsible for detoxifying
propionyl-CoA, a toxic metabolite produced as the fungus breaks down proteins [5]. The
enzyme responsible for this detoxification is 2-methylcitrate synthase (mcsA) and is a
potential candidate for the design of new anti-fungals. However, mcsA shares a similar
reaction to human citrate synthase (hCS), and both the structure and function of each
TABLE OF CONTENTS
ACKNOWLEDGEMENTS ... iii
ABSTRACT ... iv
LIST OF TABLES ... viii
LIST OF FIGURES ... ix
LIST OF ABBREVIATIONS ... xi
CHAPTER 1:STRUCTURAL CHARACTERIZATION OF A EUKARYOTIC CYANASE FROM TETRANYCHUS URTICAE ...1
1.1BACKGROUND AND INTRODUCTION ...1
1.2PURIFICATION OF RECOMBINANT T. URTICAE CYANASE ...4
1.3CONSTRUCTION OF PMBPCS1 AND CLONING OF T. URTICAE CYANASE ...5
1.4PURIFICATION OF MBP-CYANASE ...8
1.5CONFIRMATION OF CYANASE ACTIVITY OF MBP-CYANASE...9
1.6CRYSTALLIZATION OF MBP-CYANASE ...9
1.7DATA COLLECTION,STRUCTURE DETERMINATION AND REFINEMENT OF TUCYANASE ...10
1.8OLIGOMERIC ASSEMBLY OF TUCYANASE ...10
1.9DIMER INTERFACE OF TUCYANASE ...12
1.10ACTIVE SITE OF TUCYANASE ...13
1.11DISCUSSION ...14
CHAPTER 2:STRUCTURAL AND FUNCTIONAL CHARACTERIZATION OF A GLUTATHIONE
S-TRANSFERASE FROM TETRANYCHUS URTICAE ...28
2.1BACKGROUND AND INTRODUCTION ...28
2.2EXPRESSION AND PURIFICATION OF TUGST IN PJEXPRESS411 ...30
2.3CLONING TUGST INTO PMCSG28, PMCSG29 AND PMBPCS1 ...31
2.4TUGSTEXPRESSION WITH PMCSG28, PMCSG29 AND PMBPCS1 ...35
2.5TUGSTKINETICS ...36
2.6PREDICTED STRUCTURE OF TUGST ...37
2.7DISCUSSION ...38
2.8TABLES ...41
2.9FIGURES ...43
CHAPTER 3:STRUCTURAL CHARACTERIZATION OF AN INTRADIOL RING-CLEAVAGE DIOXYGENASE FROM TETRANYCHUS URTICAE ...48
3.1BACKGROUND AND INTRODUCTION ...48
3.2PROTEIN EXPRESSION AND PURIFICATION OF TUDIOXYGENASE ...49
3.3MOLECULAR CLONING OF TUDIOXYGENASE INTO PMCSG29 AND PMBPCS1 ....51
3.4EXPRESSION AND PURIFICATION OF DIOXYGENASE-MBP AND MBP-DIOXYGENASE ...53
3.5CRYSTALLIZATION OF MBP-DIOXYGENASE ...54
3.6DATA COLLECTION,STRUCTURE DETERMINATION AND REFINEMENT OF TUDIOXYGENASE ...55
3.7CRYSTAL STRUCTURE OF MBP-DIOXYGENASE ...56
3.8COORDINATION OF ACTIVE SITE IRON ...57
3.9PUTATIVE MECHANISM OF TUDIOXYGENASE ...57
3.11TABLES ...59
3.12FIGURES ...61
CHAPTER 4: STRUCTURAL AND FUNCTIONAL CHARACTERIZATION OF 2-METHYLCITRATE SYNTHASE FROM ASPERGILLUS FUMIGATUS AND CITRATE SYNTHASE FROM HUMANS ...65
4.1BACKGROUND AND INTRODUCTION ...65
4.2CLONING OF HCS INTO PMCSG53 ...66
4.3EXPRESSION AND PURIFICATION OF HCS AND MCSA ...68
4.4DATA COLLECTION,STRUCTURE DETERMINATION AND REFINEMENT ...70
4.5STRUCTURAL COMPARISON OF PCS AND CCS TO RECOMBINANT HCS ...72
4.6MECHANISM FOR PCS, CCS AND HCS ...73
4.7COMPARISON OF HCS AND MCSACRYSTAL STRUCTURES ...73
4.8COMPARISON OF HCS TO HCSA348G AND MCSA TO MCSAG352A ...75
4.9OTHER CRYSTAL STRUCTURES OF HCS AND MCSA ...77
4.10 HCS, HCSA348G, MCSA AND MCSAG352A ...78
4.11SCREENING FOR INHIBITORS WITH DIFFERENTIAL SCANNING FLUORIMETRY (DSF) ...80
4.12TESTING INHIBITORS BY UV-VIS SPECTROSCOPY ...81
4.13DISCUSSION ...83
4.14SITE-DIRECTED MUTAGENESIS OF HCSA348G AND MCSAG352A ...86
4.15TABLES ...88
4.16FIGURES ...93
CHAPTER 5:SUMMARY,CONCLUSIONS AND FUTURE DIRECTIONS ...111
LIST OF TABLES
Table 1.1 Primers used for cloning TuCyanase ...17
Table 1.2 Summary of data collection and structure refinement statistics for TuCyanase ...18
Table 2.1 Primers used for TuGST cloning ...41
Table 2.2 Kinetic parameters for GSH and CDNB ...42
Table 3.1 Primers used for TuDioxygenase cloning ...59
Table 3.2 Data collection statistics for TuDioxygenase ...60
Table 4.1 Primers used for hCS and mcsA cloning and mutagenesis ...88
Table 4.2 Data collection statistics for hCS and mcsA crystal structures ...89
Table 4.3 Kinetic parameters of hCS, hCSA348G, mcsA and mcsAG352A determined by UV-Vis spectroscopy ...90
Table 4.4 Differential Scanning Fluorimetry (DSF) results using substrates as ligands ...91
LIST OF FIGURES
Figure 1.1 Reaction scheme of cyanase ...19
Figure 1.2 SDS-PAGE NiNTA purification of TuCyanase and MBP-Cyanase ...20
Figure 1.3 Plasmid map for pMBPcs1 ...21
Figure 1.4 Gel filtration results for MBP-Cyanase ...22
Figure 1.5 Oligomeric state of T. urticae and E. coli cyanases ...23
Figure 1.6 Cyanase dimer and surface interfaces ...24
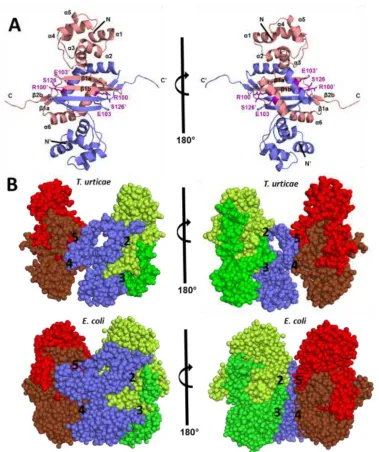
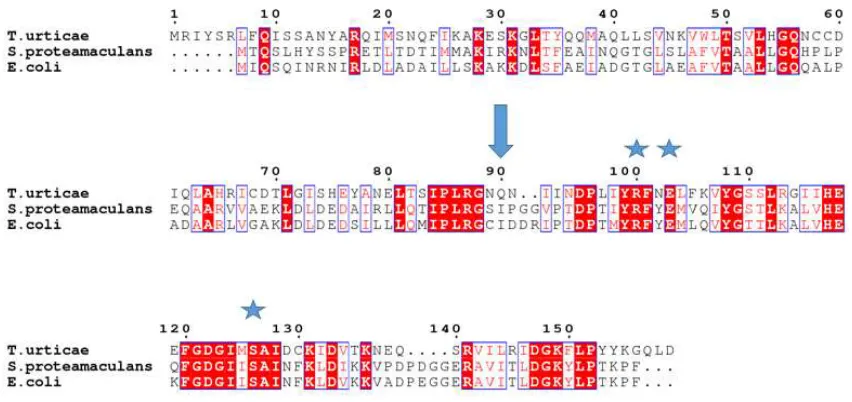
Figure 1.7 Amino acid sequence alignment of T. urticae, S. proteamaculans and E. coli cyanases ...25
Figure 1.8 Amino acid sequence conservation between TuCyanase, EcCyanase and SpCyanase ...26
Figure 1.9 The active site of cyanase from T. urticae ...27
Figure 2.1 Size exclusion results for purification of TuGST ...43
Figure 2.2 Compounds tested with TuGST ...44
Figure 2.3 Kinetic data for GSH and CDNB ...45
Figure 2.4 Sequence alignment of TuGST and BmGST ...46
Figure 2.5 Predicted structure of TuGST ...47
Figure 3.1 The structure of catechol and catechol derivatives ...61
Figure 3.2 Crystal structure of TuDioxygenase ...62
Figure 3.3 Sequence alignment of TuDioxygenase with SACTE_2871 homologue ...63
Figure 3.4 Active site of TuDioxygenase and a bacterial 1,2-dioxygenase homologue ....64
Figure 4.2 Condensation reactions catalyzed by mcsA and hCS ...94
Figure 4.3 Sequence alignment of pCS, hCS, cCS and mcsA ...95
Figure 4.4 Secondary sequence conservation of pCS, hCS and cCS...96
Figure 4.5 Crystal structure of hCS ...97
Figure 4.6 Secondary sequence conservation of hCS and mcsA ...98
Figure 4.7 Comparison of conformational changes between hCS and mcsA ...99
Figure 4.8 Crystal structure of mcsA with oxaloacetate and ethyl-CoA bound ...100
Figure 4.9 Residue movement comparison upon substrate binding by hCS and mcsA ..101
Figure 4.10 Ala348 in hCS and Gly352 in mcsA ...102
Figure 4.11 Crystal structure of hCSA348G ...103
Figure 4.12 Crystal structure of mcsAG352A ...104
Figure 4.13 Kinetic graphs of hCS, hCSA348G, mcsA and mcsAG352A ...105
Figure 4.14 Ligands used for DSF ...107
LIST OF ABBREVIATIONS
4,4’-DDT ... 1,1,1-trichloro-2,2-bis(4-chlorophenyl) Ethane
4HNE ... 4-hydroxynonenal
4NBC ... 4-nitrobenzyl Chloride
4NPA... 4-nitrophenethyl Acetate
4NPB ... 4-nitrophenethyl Bromide
A-CoA ... Acetyl-CoA
AMP ... Ampicillin
APS ... Advanced Photon Source
AU ... Asymmetric Unit
β-ME ...2-mercaptoethanol
BmGST ... Bombyx mori Glutathione S-transferase
B. mori... Bombyx mori
cCS ... Chicken Citrate Synthase
CMM ... CheckMyMetal Server
CDNB ...1-chloro-2,4-dinitrobenzene
CoA ...Coenzyme A
CoA-SH... Coenzyme A (free thiol)
CP ... Chlorfenapyr
DEAE ... Diethylaminoethanol
dGTP ...Deoxyguanosine Triphosphate
DNDGIC ... Dinitrosyl-diglutathionyl Iron Complex
DSF ... Differential Scanning Fluorimetry
DTNB ... 5,5-dithio-bis-(2-nitrobenzoic Acid)
dTTP ...Deoxythymidine Triphosphate
DTT ... Dithiothreitol
EcCyanase ... Escherichia coli Cyanase
E. coli ... Escherichia coli
EDTA ... Ethylenediaminetetraacetic Acid
EPNP ... 1,2-epoxy-3-(4-nitrophenoxy)-propane
FPLC ... Fast-Protein Liquid Chromatography
GFP ...Green Fluorescent Protein
GMQE ... Global Model Quality Estimation
GSH... Reduced Glutathione
GST ... Glutathione S-transferase
HCN ... Hydrogen Cyanide
hCS ... Human Citrate Synthase
HPLC-MS ... High-Performance Liquid Chromatography-Mass Spectrometry
ID-RCDs ... Intradiol Ring-Cleavage Dioxygenases
IPTG ... β-D-1-thiogalactopyranoside
ITC ... Isothermal Titration Calorimetry
kcat ...Turnover Number
kDa ... kiloDaltons
Km ... Michael-Menten Constant
LB ... Luria-Broth
LB-KAN ... Luria-Broth Kanamycin
LIC ... Ligation Independent Cloning
Mbs ... Mega bases
MBP ...Maltose-binding Protein
mcsA ... 2-methylcitrate Synthase
MW ... Molecular Weight
NaCl ... Sodium Chloride
NiNTA ... Nickel-nitrilo-triacetic agarose resin
OAA ... Oxaloacetate
OCN- ... Cyanate
P-CoA ... Propionyl-CoA
PCR ... Polymerase Chain Reaction
pCS ... Pig Citrate Synthase
PDB ... Protein Data Bank
Pro-CoA ... Propionyl-CoA
RMS ... Root Mean-Square
RMSD ... Root Mean-Square Deviation
SERp ... Surface Entropy Reduction
SDS-PAGE ... Sodium Dodecyl Sulfate Polyacrylamide Gel Electrophoresis
SER-CAT ... Southeast Regional Collaborative Access Team
SOC ... Super Optimal Broth with Catabolite Repression
S. proteamaculans ... Serratia proteamaculans
SpCyanase ... Serratia proteamaculans Cyanase SPR ... Surface Plasmon Resonance
TEV ...Tobacco Etch Virus
TLS ... Translational/Libration/Screw
Tm ... Melting Temperature
TNB...2-nitro-5-thiobenzoate
TSSM ... Two-spotted spidermite
T. urticae ... Tetranychus urticae
TuCyanase... Tetranychus urticae Cyanase TuDioxygenase ...Tetranychus urticae Dioxygenase TuGST... Tetranychus urticae Glutathione S-transferase Vmax ... Velocity Max
CHAPTER
1
S
TRUCTURALC
HARACTERIZATION OF AE
UKARYOTICC
YANASE FROMT
ETRANYCHUSU
RTICAE1.1 BACKGROUND AND INTRODUCTION
Chelicerates are a basal lineage within the Arthropoda phylum and represent the
second largest group of terrestrial animals after insects [6]. They comprise of horseshoe
crabs, scorpions, spiders, mites and ticks and include various economically important
species for human health and agriculture. Mites exhibit a diverse range of lifestyles
including herbivory, predation, parasitism, detritivory and symbiosis [7, 8]. With 48,000
species described by the turn of the century [9] and a total estimate of 0.5 and 1 million
species, mites are probably one of the most diverse animal groups [10]. The two-spotted
spider mite (TSSM), Tetranychus urticae, is an agricultural herbivorous pest and is the first chelicerate for which the complete genome was sequenced [11]. Due to its rapid
developmental rate (can reach adulthood from egg in 7 days at 30°C), easy laboratory
rearing and strong research community, T. urticae is presently a versatile chelicerate model organism [12]. Moreover, its compact genome of 90 Mbp (54% of the genomic sequence
encodes for proteins) makes it an attractive experimental system to investigate gene and
protein function.
TSSM is one of the most polyphagous arthropods, feeding on more than 1,100 plant
species including more than 150 agricultural crops [13]. As plants produce a vast number
and between species [14], TSSM is able to overcome a plethora of plant defense systems
[15]. TSSM infestations are controlled with acaricides of which the global market value is
estimated at $1.6 billion [16]. The TSSM has the highest incidence of pesticide resistance,
resulting in extreme difficulty of controlling populations by conventional chemical pest
management [17]. Analyses of the TSSM genome have previously revealed an
unprecedented proliferation of multi-gene families that are commonly associated with the
xenobiotic metabolism. These lineage-specific expansions in families such as cytochrome
P450 monooxygenases and ABC transporters are considered to strongly contribute to the
mite’s ability to quickly develop pesticide resistance and to adapt to a wide host plant range
[11, 18, 19]. In addition, spider mite outbreaks and crop damage are strongly facilitated by
high temperatures and drought stress, both of which are intensified by climate change [20].
With increased reproductive potential under conditions of global warming [21], combined
with an outstanding ability to adapt to new crops and develop resistance to pesticides, the
TSSM is becoming a high-risk pest threatening global crop security.
Many plant species, including a number of food plants, are cyanogenic and release
toxic hydrogen cyanide (HCN) from non-toxic glycoside or lipid precursors upon herbivore
attack [22, 23]. Previous studies have gathered a body of evidence showing that the TSSM
overcomes cyanide toxicity by expressing genes of foreign origin within its genome
acquired through the process of horizontal gene transfer [24, 25].
Two mutually non-exclusive cyanide detoxification pathways, catalyzed by two
horizontally transferred genes, have been proposed for TSSM. Cyanide might be first
oxidized to cyanate (OCN-) which is then catabolized by the horizontally acquired T.
cyanase gene was transcribed in all mite feeding stages (larvae, nymphs and female adults)
and that gene-expression was host plant dependent. However, a later study revealed the
presence of yet another gene from bacterial origin that codes for a β-cyanoalanine synthase
enzyme that directly detoxifies cyanide through the formation of the amino acid derivative
β-cyanoalanine [25]. This raises the question whether cyanide detoxification is the main
function of T. urticae cyanase (in this manuscript further referred to as TuCyanase). The
genomes of some non-phytophagous mites also possess cyanase genes [15]. Cyanate is also
formed by the dissociation of carbamoyl phosphate and inhibits further synthesis of the
compound by interacting with carbamoyl phosphate synthase. As carbamoyl phosphate is
a main substrate for arginine and pyrimidines biosynthesis, cyanase might be indirectly
involved in the regulation of their biosynthesis by changing cyanate concentrations [22,
23, 26–28]. To better understand the biological function of the horizontally transferred
cyanase genes and their protein products, it is of crucial importance to understand the
quaternary structures and how these evolved after a horizontal transfer event.
Cyanases in nematodes, plants and fungi are not very well characterized and the
enzyme from E. coli is the most studied representative of this group of enzymes [26, 29–
34]. It was shown that the E. coli cyanase (here referred to as EcCyanase) is a decameric
protein that uses bicarbonate and cyanate as substrates (Figure 1.1) [35]. The enzyme is
inhibited by various anions such as chloride, azide, nitrate, oxalate, oxaloacetate and
malonate. Moreover, bicarbonate at high concentrations is responsible for substrate
inhibition of the enzyme. Several structures of the E. coli enzyme have been determined
[34]. At the time of this publication, the only other cyanase structure present in the Protein
The TuCyanase presented here is the first mite cyanase that has had its structure
determined, and is also the very first structure of any eukaryotic cyanase. This manuscript
discusses in detail the differences between bacterial and TuCyanase which have a similar
overall fold, despite relatively low sequence identity. Our structural and functional data
provide a deeper understanding on the role of cyanase in T. urticae and other mites.
1.2 PURIFICATION OF RECOMBINANT T. URTICAE CYANASE
Originally, tetur28g02430 (TuCyanase) was ordered from DNA 2.0 (Menlo Park,
CA) in the expression vector pJExpress411 (Kanamycin resistance (KAN)) that has an
isopropyl β-D-1-thiogalactopyranoside (IPTG)-inducible T7 promoter. The gene was
synthesized to contain an N-terminal cleavable 6xHis-tag for ease of purification with the
Tobacco Etch Virus (TEV) cut site MHHHHHHSSGVDLGTENLYFQ/SGSG where the
cut site is shown with a slash. DNA was transformed into BL-21 (DE3) E. coli via heat
shock and cells were plated on Luria-broth (LB)-KAN (50 µg/mL) plates at 37ºC for 16
hours. For inoculation, 10 mL of starter culture was used in 1.0 L of LB containing 50
µg/mL KAN. Cultures were shaken at 37ºC until an OD of 0.8 was reached and then cooled
down to 16ºC for protein expression with 0.4 mM IPTG for 16 hours. Cell pellets were
harvested by spinning cultures in a Beckman Coulter Ultracentrifuge (Indianapolis, IN) at
4ºC which were immediately frozen at -80ºC until needed further.
Pellets were resuspended in lysis buffer (50 mM Tris pH 7.4, 500 mM NaCl, 2%
glycerol, 20 mM β-mercaptoethanol (β-ME), 10 mM imidazole) using 5.0 mL buffer per
gram of pellet and lysed by sonication using a Branson Sonifier 450 (ThermoFisher, Grand
Island, NY). Cell lysate was spun down in a Beckman Coulter Ultracentrifuge
(Indianapolis, IN) at 4ºC and supernatant was loaded onto a 5.0 mL resin bed of HisPur
Tris pH 7.4, 500 mM NaCl, 2% glycerol, 20 mM β-ME, 30 mM imidazole). The column
was washed several times with wash buffer and protein was eluted with elution buffer (50
mM Tris pH 7.4, 500 mM NaCl, 20 mM β-ME, 250 mM imidazole). Elutions were
collected in 1.5 mL fractions and run on a 12% SDS-PAGE gel to determine fractions that
contain protein. Elutions containing protein were put into SnakeSkin Dialysis Tubing with
a 3,000 molecular weight (MW) cutoff (ThermoScientific, Grand Island, NY) and dialyzed
in dialysis buffer (10 mM Tris pH 7.4, 150 mM NaCl, 5 mM β-ME) at 4ºC for 16 hours.
TuCyanase was concentrated using an EMD Millipore Amicon Ultra-15 concentrator
(Billerica, MA) with a 3,000 MW cutoff, and concentration was determined by A280 using
the molar extinction coefficient 18,910 M-1cm-1 and MW 18,540 as determined by the
ExPASy ProtParam tool [37, 38].
Purification of TuCyanase with N-terminal his-tag resulted in very poor yields of
protein (around 1.0 mg per liter culture). Figure 1.2A shows a 12% SDS-PAGE gel for
Ni-NTA purification results of this protein. To increase yield, the fusion protein
maltose-binding protein (MBP) was used in pMBPcs1.
1.3 CONSTRUCTION OF PMBPCS1 AND CLONING OF T. URTICAE CYANASE
CONSTRUCTION OF PMBPCS1
The base vector for making pMBPcs1 was pMCSG71 [39] from DNASU Plasmid
Repository (Tempe, AZ). This pMCSG71 vector expresses fusion protein as follows: MBP,
Tobacco Vein Mottling Virus (TVMV) cut site, Ligation Independent Cloning (LIC) site,
TEV cut site, 6xHis-tag where the LIC site is the location of gene insertion. The end
product pMBPcs1 was designed to express the fusion protein as follows: MBP,
pMCSG71 and replace it with two alanine codons (AGCAGC); the serine of the AAS linker
was added to the 5’ end of the TuCyanase insert later in the process. Primers were designed
using the program on rf-cloning.org [40]. First, megaprimers were synthesized in a 50 µL
primary reaction by mixing 10 µM of each primer (pCSAA-F and pCSAA-R) with phusion
polymerase following the manufacturer's setup protocol (NEB, Ipswich, MA) and
thermalcycling as follows: initial 98ºC for 30 seconds, 15 cycles of 98ºC for 10 seconds,
58ºC for 15 seconds, 72ºC for 10 seconds, a final extension at 72ºC for 30 seconds and an
infinite hold at 12ºC.
After the primary polymerase chain reaction (PCR), secondary PCR was performed
by adding 1.0 µL of 100 ng pMCSG71 to the primary PCR and thermalcycling as follows:
initial 98ºC for 30 seconds, 35 cycles of 98ºC for 10 seconds, 64ºC for 30 seconds, 72ºC
for 6 minutes, a final extension at 72ºC for 10 minutes and an infinite hold at 12ºC. Twenty
units of DpnI (NEB, Ipswich, MA) were added to the secondary PCR and incubated at
37ºC for 2 hours. DpnI was then inactivated at 80ºC for 20 minutes. For transformation, 20
µL of secondary PCR was added to chemically competent DH5-α E. coli cells and heat
shocked at 42ºC for 45 seconds. Cells were allowed to recover by adding 950 µL of super
optimal broth (SOC) media and incubated at 37ºC for 1.0 hour with shaking. Cells were
plated on LB-ampicillin (AMP) plates (50 µg/mL) and grown at 37ºC for 16 hours. Clones
were miniprepped with a GeneJET Plasmid Miniprep Kit (ThermoFisher, Grand Island,
NY) and sent to EtonBioscience (Research Triangle Park, NC) to confirm the correct
sequence with T7 forward and T7 reverse primers.
CLONING OF TUCYANASE INTO PMBPCS1
(Uniprot: T1KZQ3) from DNA 2.0 (Menlo Park, CA) was cloned into it using Ligation
Independent Cloning. For LIC, pMBPcs1 was amplified at the LIC site to generate blunt
ends for T4 DNA Polymerase 3' → 5' exonuclease activity using the primers
pMBPcs1-LIC-F and pMBPcs1-LIC-R in Table 1.1. The PCR was performed following the standard
protocol for KOD Polymerase (EMD Millipore, Billerica, MA) with the addition of 1.0 M
betaine monohydrate, 2.0 mM magnesium sulfate and 130 ng of pMBPcs1 in a 50 µL
reaction with thermalcycling as follows: initial 95ºC for 2 minutes, 30 cycles of 95ºC for
20 seconds, 54ºC for 10 seconds, 70ºC for 6 minutes, a final extension at 70ºC for 10
minutes and an infinite hold at 12ºC. The reaction was run on a 1.0% agarose gel and the
band corresponding to pMBPcs1 was gel excised using a GeneJET Gel Extraction Kit
(ThermoFisher, Grand Island, NY) and eluted with sterile water.
TuCyanase was prepared for LIC into pMBPcs1 by using pMBP-Cyan-F and
pMBP-Cyan-R primers listed in Table 1.1; the forward primer for TuCyanase was designed
to introduce a serine residue at the N-terminal of cyanase so the fusion protein linker would
be three residues consisting of AlaAlaSer. For PCR, TuCyanase in pJExpress411 from
DNA 2.0 (Menlo Park, CA) was used as the template (100 ng) and the protocol for Phusion
polymerase was used (NEB, Ipswich, MA). The conditions for thermalcycling were as
follows: initial 98ºC for 30 seconds, 35 cycles of 98ºC for 10 seconds, 70ºC for 30 seconds,
72ºC for 25 seconds, a final extension at 72ºC for 1.0 minute and an infinite hold at 12ºC.
PCR product was run on a 1.0% agarose gel and gel excised using a GeneJET Gel
Extraction Kit (ThermoFisher, Grand Island, NY) and eluted with sterile water.
Sticky ends for LIC were made by incubating gel excised PCR products with T4
pMBPcs1, 5.0 mM dithiothreitol (DTT), 2.5 mM deoxyadenosine triphosphate (dATP), 1X
NEB2.1 buffer and 3.0 units of T4 DNA polymerase, and a 40 µL reaction containing 1500
fmoles of tetur28g02430, 5.0 mM DTT, 2.5 mM deoxythymidine triphosphate (dTTP), 1X
NEB2.1 buffer and 3.0 units of T4 DNA polymerase were incubated at room temperature
for 30 minutes. The T4 DNA polymerase was then inactivated at 75ºC for 20 minutes and
the reactions were mixed 10:10 at room temperature for 5.0 minutes. Next, 1.0 µL of 25
mM ethylenediaminetetraacetic acid (EDTA) was added and the reaction was incubated
another 5.0 minutes at room temperature. Transformation was performed with heat shock
as mentioned previously after adding the 20 µL LIC reaction to the cells, and cells were
plated on LB-AMP (50 µg/mL) plates at 37ºC for 16 hours. Clones were miniprepped with
a GeneJET Plasmid Miniprep Kit (ThermoFisher, Grand Island, NY) and insertion of
TuCyanase was first confirmed by restriction digest with HindIII and XbaI following the
manufacturer's instructions (NEB, Ipswich, MA). After restriction digest, clones with
correctly sized fragments were sent to EtonBioscience (Research Triangle Park, NC) for
sequencing with T7 forward and T7 reverse primers. Correct clones were transformed via
heat shock into BL-21 (DE3) E. coli cells.
1.4 PURIFICATION OF MBP-CYANASE
Purification of MBP-Cyanase was the same as previously mentioned for cyanase
except it yielded much higher quantities of protein (around 30 mg per liter culture, Figure
2B) and dialysis buffer contained 5.0 mM maltose. MBP-Cyanase concentration was
determined by A280 using the molar extinction coefficient 85,260 M-1cm-1 and MW 60,834
as determined by the ExPASy ProtParam tool [37, 38]. MBP-Cyanase was further purified
with a Superdex 200PG column attached to an ÄKTA Pure FPLC system (GE Healthcare,
mM maltose). Gel filtration results are shown in Figure 1.4. Interestingly, MBP-Cyanase
eluted off the column as a single peak around a size of 670 kiloDaltons (kDa) (based on
Bio-Rad (Hercules, CA) Thyroglobulin 670 kDa standard), which would indicate the
fusion protein is in a decameric state.
1.5 CONFIRMATION OF CYANASE ACTIVITY OF MBP-CYANASE
To determine if the cyanase fusion protein had enzymatic activity,
MBP-Cyanase was incubated in a 500 µL reaction of 100 mM Tris pH 7.5 with 10 mM sodium
cyanate and 10 mM sodium bicarbonate; all chemicals used were purchased from
Sigma-Aldrich. To detect the presence of ammonia, one product of the cyanase reaction, a piece
of Whatman pH paper dampened with diH2O was placed above the opening of the 1.5 mL
tube containing the 500 µL reaction mix. After ~20 seconds, the pH paper turned green
which would indicate the presence of base i.e. ammonia (data not shown). As negative
controls, reactions were made as follows: only sodium bicarbonate, only sodium cyanate,
both sodium bicarbonate and sodium cyanate, sodium bicarbonate with Tris pH 7.5 and
MBP-Cyanase, sodium cyanate with Tris pH 7.5 and MBP-Cyanase. These controls were
all tested with pH paper in the same manner. All of the controls failed to change the color
of the pH paper, except the Tris reaction mix containing sodium cyanate and
MBP-Cyanase. It is possible that residual bicarbonate (from atmospheric CO2) was present after
the purification of MBP-Cyanase, even though bicarbonate was not used during
purification.
1.6 CRYSTALLIZATION OF MBP-CYANASE
MBP-Cyanase crystallization experiments were performed at room temperature
mixed with mother liquor in a 1:1 ratio. A condition of 0.1 M Tris pH 7.5, 15% w/v
PEG6000 produced crystals after about 2 months. Crystals were cryo-cooled in liquid N2.
1.7 DATA COLLECTION, STRUCTURE DETERMINATION AND REFINEMENT OF TUCYANASE
Data was collected using remote access to Southeast Regional Collaborative Access
Team (SER-CAT) 22ID at the Advanced Photon Source (APS), Argonne National Lab
(Argonne, IL). The diffraction images were processed with the HKL-2000 software
package [41]. Data collection statistics are reported in Table 2. Molecular replacement was
performed using MOLREP [42] integrated with HKL-3000 [43]. The crystal structure E.
coli cyanase (PDB code: 2IV1) was used as the starting model for molecular replacement. The initial model was rebuilt using BUCCANEER [44] and CCP4 package [45].
Refinement was performed using REFMAC [46] and HKL-3000. Non-crystallographic
symmetry was used during the whole process of refinement. TLS refinement was used
during the last stages of the refinement and the TLS Motion Determination server was used
for partitioning protein chains into the rigid bodies undergoing vibrational motions [47].
The model was updated and validated with COOT [48]. MOLPROBITY was used in the
final steps of the model validation [49]. The final model together with structure factors
were deposited to the Protein Data Bank [50] with the accession number 5UK3. Dali [51]
and PDBeFold [52] were used to identify structural homologs of the T. urticae cyanase.
PDBePISA [53] was used to analyze oligomeric assembly formed by the enzyme. Figures
were created with PyMOL [54].
1.8 OLIGOMERIC ASSEMBLY OF TUCYANASE
The recombinant MBP-cyanase protein was shown to be enzymatically active by
shown). Although the recombinant protein was unstable at room temperature after 4-5 days
(data not shown), we were still able to crystallize TuCyanase. The model presented here is
the first mite cyanase structure determined and the first structure of any eukaryotic cyanase
(Figure 1.5). The comparison of T. urticae cyanase to the two known bacterial cyanase
structures revealed that a homo-decameric state and active site residues were conserved,
but there were some variabilities in the dimer interfaces and protein domains.
Consequently, TuCyanase appears to be less compact than the prokaryotic cyanases,
EcCyanase and SpCyanase.
Structural analysis revealed that only the cyanase part of MBP-Cyanase is present
in the crystal. The crystal form contained 10 protein chains in the asymmetric unit (AU).
The quaternary structure was determined to be decameric which is in agreement with gel
filtration results (Figure 1.4), as well as the oligomeric forms observed for EcCyanase [34]
and SpCyanase [36]. The decamer may be treated as a pentamer of dimers (Figure 1.6A).
A single protein chain is composed of two segments: an N-terminal domain (helices
α1-α5) and the cyanate lyase domain (all β-strands and helix α6). The role of the N-terminal
domain is not well understood and has a similar structure to some proteins involved in
DNA binding. For example, a structural domain part of cytolysin repressor 2 from
Enterococcus faecalis (PDB code: 2XJ3) overlaps with an RMSD of 1.8 Å (over 58 Cα atoms). The cyanate lyase domain of TuCyanase contained all amino acids necessary to
form the active site.
The determined cyanase structure from T. urticae included mostly residues 22-156
with a small variability of the sequence span between the 10 protein chains in the
E. coli and S. proteamaculans revealed a significant degree of structure similarity despite a relatively low sequence identity (Figure 1.5, 1.7). The sequence identity/similarity
between T. urticae and E. coli or S. proteamaculans proteins is 35%/62% or 34%/56%
respectively, with the N-terminal domains being less conserved in comparison with the
cyanate lyase domains. Superposition of TuCyanase and EcCyanase or SpCyanase
structures resulted in RMSD values of 1.8Å (over 129 Cα atoms; PDB code 1DW9) or
1.7Å (over 128 Cα atoms; PDB code 4Y42), respectively.
1.9 DIMER INTERFACE OF TUCYANASE
As mentioned before, functionally active cyanase enzymes of T. urticae and bacteria form a decamer that may be described as a pentamer of dimers. The dimer interface
(interface 1, Figure 1.6B) has a very large area (~3050 Å2 for T. urticae and ~3250 for E.
coli). In addition, each protein chain forming the dimer interacts with four other protein
chains from neighboring dimers (Figure 1.6B). In TuCyanase, interface 2 (blue and yellow
chains) had a relatively large area (~1200 Å2) compared to interfaces 3 (blue and green), 4
(blue and brown) and 5 (blue and red) which were relatively small (~260 Å2 each); a
significant degree of interface 2 was formed by the C-terminal end of a neighboring unit.
The decamer is barrel-shaped with a height of approximately 70 Å and diameter of 75 Å.
Compared to TuCyanase, EcCyanase is more compact with larger interface areas between
the monomers and neighboring dimers: interface 1 is ~3250 Å2, interface 2 is ~1400 Å2,
interface 3 and 4, are ~800 Å2, interface 5 is ~300 Å2). Despite differences in compactness
and interface areas, the decameric barrel of TuCyanase and EcCyanase have a similar
The major difference in the oligomeric forms observed for proteins from T. urticae
and E. coli (as well as S.proteamaculans) is related to the fact that the spider mite protein structure does not possess the first 20 amino acids. These missing amino acids correspond
to a fragment of helix α1 in the E. coli structure and N-terminal part that does not have a defined secondary structure; it is placed on the “edge” of the barrel mediating contact
between dimers. The presence of the N-terminal amino acids in the E. coli structure increases the surface area interface between dimers by almost 40% in comparison with the
corresponding interactions in the structure for T. urticae. In addition, in E. coli cyanase the N-terminal part of the protein is packed in the barrel, thus limiting the size of the substrate
channel through the decamer. The comparison of the TuCyanase and EcCyanase also shows
that the helices α1 and α5 for EcCyanase are shifted significantly towards the center of the
barrel.
1.10 ACTIVE SITE OF TUCYANASE
Structural and sequence analyses of TuCyanase, EcCyanase and SpCyanase (Figure
1.8) show that the most conserved amino acids are located in the areas mediating
interactions between the dimeric assemblies. Two dimers are necessary to create an active
site and there are five active sites in one decamer. Mapping of the sequence conservation
onto the structure of TuCyanase clearly showed that the cyanate lyase domain is
significantly more conserved than the N-terminal domain. The active site is composed of
amino acids provided by four protein chains (Figure 1.9A). The studies of cyanase from E.
conserved in all studied cyanases (Figure 1.9B) [24, 28, 55], including the recently
discovered silverleaf whitefly homolog (R119, E122 and S145).
The cyanase active site is quite unusual as not only is it formed by residues
originating from four protein chains, it also exhibits a pseudo-two-fold symmetry (Figure
1.9C). The number and composition of the active sites are in agreement with the kinetic
and binding studies that show 0.5 stoichiometry in the case of substrate and inhibitor
binding [30]. At the entrance to the active site, K149 may help to attract negatively charged
substrates. In addition, the entrance to the active site was aligned with hydrophobic residues
like I124, I128 and L151 that limit the size of the molecules/ions that can access the active
site. It is not clear what the role of S126 is during the reaction, but it is believed that R100
is responsible for substrate binding, while E103 positions the arginine in proper orientation.
There are also two proline residues that were conserved in the TuCyanase, EcCyanase and
SpCyanase. The first proline (P96) changes the direction of polypeptide chain and initiates
helix α6 that contains critical catalysis residues R100 and E103. The second proline (P152)
ends a short β-strand (β2b). It is also worth mentioning that the regions between β1a and
β1b (S126-A127-I128), as well as β2a and β2b (K149), contained residues that are highly
conserved among cyanases.
1.11 DISCUSSION
Although the results presented here provide a better understanding of the
horizontally acquired TuCyanase, it remains unclear how the substrates and products enter
and leave the active site, respectively. It was proposed that solvent exposed residues L151
(Figure 1.9C) control the access to the active site [34, 36], and the reaction occurs through
a random sequential mechanism [32]. The active sites have an overall net positive charge
active site residues consist of arginine, serine and glutamic acid residues and are conserved
among all cyanases including those from bacteria, fungi and T. urticae presented here [22, 24, 28, 34, 36, 55]. While there is an agreement on the identity of major cyanase substrates
(Figure 1.1), it is not clear what source(s) of protons is necessary for the reaction.
EcCyanase and TuCyanase display a bell-shaped pH dependence of activity with maxima
at 7.4 and 7.6 respectively [24, 29]. It seems that serines 126 (from two chains) are the only
amino acids in the vicinity of the active site (Figure 1.9C) that may participate in a proton
transfer. However, it cannot be excluded that these residues play a different role during the
reaction.
Decomposition of cyanate and bicarbonate by cyanase (Figure 1.1) generates two
molecules of carbon dioxide. The E. coli cyanase operon also includes a cynT gene that
codes for a carbonic anhydrase which aids in the recycling of the produced carbon dioxide
to bicarbonate [26, 35, 56]. The role of the anhydrase is not only important for carbon
dioxide recycling, but more importantly, it prevents CO2 from escaping from the cell. In
the absence of the anhydrase, the carbon dioxide diffuses faster from the cell than it would
being hydrated to bicarbonate [56]. The escape of CO2 would lead to a depletion of cellular
bicarbonate that in turn would affect various metabolic processes using HCO3-/CO2 as
substrates [57]. Furthermore, in E. coli it was shown that deletion of the cynT gene results in growth inhibition and an inability to degrade cyanate [57]. The importance of the
cyanase/anhydrase tandem in the detoxification of cyanate was also suggested in fungal
identified within the animal kingdom and belong to the α- or β-carbonic anhydrase family
[59, 60]. However, β-carbonic anhydrases with InterPro protein domains IPR001765 could
not be detected, although 9 α-carbonic anhydrases with InterPro domain IPR001148 were
1.12 TABLES
Table 1.1: Primers used for cloning TuCyanase. Lowercase letters show the two alanine insertions for pMBPcs1-F/R. Primers pMBPcs1-LIC-F/R were used to amplify pMBPcs1 at the LIC region to generate linear DNA for cloning. In pMBP-Cyan-F, lowercase letters show the introduction of a serine (codon AGT) at the N-terminal of tetur28g02430. Furthermore, the lowercase letters in pMBP-Cyan-R shows the C-terminal end of tetur28g02430 with the addition of an alanine (codon GCT) which was needed for LIC.
Primer Sequence
pMBPcs1-F 5' CCTGAAAGACGCGCAGACTAATTCGgctgctGGGGA 3'
pMBPcs1-R 5' CGGATTGGAAGTACAGGTTCTCCCCagcagcCGAAT 3'
pMBPcs1-LIC-F 5' GGGGAGAACCTGTACTTCCAATCCGCCGGG 3'
pMBPcs1-LIC-R 5' AGCAGCCGAATTAGTCTGCGCGTCTTTCAG 3'
Table 1.2: Summary of data collection and structure refinement statistics for TuCyanase. Values in parentheses refer to the highest resolution shell. Abbreviations: AU – Asymmetric Unit.
PDB Accession code 5UK3
Data collection
Diffraction source Synchrotron (APS 22ID)
Wavelength (Å) 1.000
a, b, c (Å) 71.1, 81.6, 136.5
α, β, γ(°) 90, 100.4, 90
Space group P21
Solvent content (%) 50
Protein chains in AU 10
Resolution range (Å) 40.00-2.80 (2.85-2.80)
Unique reflections 38010 (1906)
Redundancy 4.1 (4.2)
Completeness (%) 99.9 (100)
Rmerge 0.069 (0.546)
Rpim 0.050 (0.350)
Rrim 0.102 (0.721)
CC half (0.800)
Average I/σ(I) 22.5 (2.0)
Refinement
Rwork 0.221 (0.341)
Rfree 0.240 (0.346)
Mean B value (Å2) 95.8
B from Wilson plot (Å2) 93.3
RMSD bond lengths (Å) 0.012
RMSD bond angles (°) 1.7
No. of amino acid residues A = 135; B,E,H = 137;
C,D,F,G,J = 138; I = 141
No. of water molecules 20
Ramachandran plot
Most favored regions (%) 98.9
1.13 FIGURES
Figure 1.2: SDS-PAGE NiNTA purification of TuCyanase and MBP-Cyanase. A)
Figure 1.6: Cyanase dimer and surface interfaces.A) Structure of the TuCyanase dimer shown in cartoon representation. The dimer is shown in two orientations related by rotation of 180° along the Y-axis and each chain is depicted in a different color. Secondary structure elements are labeled on one of the chains forming the dimer. Residues forming active site are shown in stick representation (magenta) and are labeled. The dimer interface of two
monomers for TuCyanase is ~3060 Å2 and for EcCyanase is ~3250 Å2. B) Space-filling
Figure 1.9 The active site of cyanase from T. urticae. A) Cartoon representation of active
site cyanase formed from 4 monomers. B) The active site is formed by residues R100, S126
and E103 originating from four different protein chains (shown in four different colors). The residues forming the active site are shown in stick representation and are labeled. Oxalate (yellow) is modeled in the active site. The position of oxalate was derived from
EcCyanase structure (PDB code: 2IU7). C) The active site of the TuCyanase is formed by
residues from four adjacent protein chains (each colored differently) and all residues near the vicinity of the active site that were conserved in the enzymes from T. urticae, E. coli
C
HAPTER2
S
TRUCTURAL ANDF
UNCTIONALC
HARACTERIZATION OF AG
LUTATHIONES-T
RANSFERASE FROMT
ETRANYCHUS URTICAE2.1 BACKGROUND AND INTRODUCTION
Glutathione S-transferases (GSTs) are present in several trees of life (both
prokaryotic and eukaryotic) and serve to protect cells from oxidative stress, endogenous
toxins, organophosphates, organotins, carbamates, pyrethoids and other xenobiotics [2, 62,
63]. The thiol group of reduced glutathione (GSH) is conjugated to an electrophilic
compound to make an excretable, water soluble product; alternatively, glutathione can act
as a co-factor such as in a dehydrochlorination reaction [62]. There are several
classifications of GSTs which are based on their primary amino acid sequence [62]. In
insects, the current classifications of GSTs known are delta, epsilon, mu, omega, sigma,
theta and zeta [64, 65]. GST diversity is very common in insects which may be attributed
to alternative gene splicing, genetic rearrangements and local gene duplications that can
result in altered substrate specificity [62, 63]. Insect GSTs are responsible for the
detoxification of several insecticides used in agriculture such as
1,1,1-trichloro-2,2-bis(4-chlorophenyl)ethane (4,4’-DDT), chlorfenapyr and permethrin [2, 62]. Furthermore, in
addition to gene modifications, some insect GSTs can be upregulated in the presence of
insecticides and display slow turnover of the insecticide(s), effectively causing
Almost all GSTs form homodimers or heterodimers with two active sites [62, 66].
In one special case, however, a GST in Plasmodium falciparum has been shown to form a
low GSH affinity tetramer but a high affinity homodimer in the presence of increased GSH
concentration [67]. The active sites of GSTs consist of two subsites: G-site (formed by
N-terminal residues) and H-site (formed by C-N-terminal residues). The G-site consists of
residues near the N-terminus and is responsible for binding GSH [66]. The main G-site
residue involved with activating the reduced thiol of GSH can either be a cysteine, serine,
threonine or tyrosine [66]. The H-site consists of residues near the C-terminus and binds
hydrophobic compounds that are targets for GSH conjugation.
T. urticae is a polyphagous, worldwide agricultural pest that is rapidly developing insecticide resistance due to its rapid reproductive cycle and the widespread use of
insecticides [2]. The growing insecticide resistance in T. urticae can be attributed to several
cytochrome P450 and GST gene families [3]. Four GSTs from T. urticae have been
characterized to date: TuGSTd10, TuGSTd14, TuGSTm09 [3] and TuGSTd05 [65]. The
TuGSTd10, TuGSTd14 and TuGSTm09 enzymes exhibited affinity towards abamectin, an
insecticide, and also peroxidase activity towards Cumene hydroperoxide [3]. TuGSTd05
exhibited activity towards the de-esterified metabolite of cyflumetofen, a more recently
introduced insecticide [65]. A delta-class GST (tetur01g02230) is studied here and was
recombinantly expressed in E. coli. Several compounds were tested by UV-Vis
spectroscopy to determine T. urticae GST (TuGST) specificity and some binding
cooperativity was observed. Furthermore, structural elements of a predicted structure for
2.2 EXPRESSION AND PURIFICATION OF TUGST IN PJEXPRESS411
Initially, TuGST (tetur01g02230) was ordered from DNA2.0 in the IPTG-inducible
expression vector pJExpress411 with a T7 promoter. The gene was synthesized to contain
an N-terminal cleavable 6xHis-tag for ease of purification with the TEV cut site
MHHHHHHSSGVDLGTENLYFQ/SGSG where the cut site is shown with a slash. DNA
was transformed into BL-21 (DE3) E. coli via heat shock and cells were plated on KAN
(50 µg/mL) plates at 37ºC for 16 hours. For inoculation, 10 mL of starter culture was used
in 1.0 L of LB containing 50 µg/mL KAN. Cultures were shaken at 37ºC until an OD of
0.8 was reached and then cooled down to 16ºC for protein expression with 0.4 mM IPTG
for 16 hours. Cell pellets were harvested by spinning cultures in a Beckman Coulter
Ultracentrifuge (Indianapolis, IN) at 4ºC which were immediately frozen at -80ºC until
needed further.
Pellets were resuspended in lysis buffer (50 mM Tris pH 7.4, 500 mM NaCl, 2%
glycerol, 20 mM β-ME, 10 mM imidazole) using 5.0 mL buffer per gram of pellet and
lysed by sonication using a Branson Sonifier 450. Cell lysate was spun down in a Beckman
Coulter Ultracentrifuge (Indianapolis, IN) at 4ºC and supernatant was loaded onto a 5.0
mL resin bed of ThermoFisher HisPur NiNTA Resin (Grand Island, NY) equilibrated in
wash buffer (50 mM Tris pH 7.4, 500 mM NaCl, 2% glycerol, 20 mM β-ME, 30 mM
imidazole). The column was washed several times with wash buffer and protein was eluted
with elution buffer (50 mM Tris pH 7.4, 500 mM NaCl, 20 mM β-ME, 250 mM imidazole).
Elutions were collected in 1.5 mL fractions and run on a 12% SDS-PAGE gel to determine
fractions that contain protein. Elutions containing protein were put into ThermoFisher
dialysis buffer (10 mM Tris pH 7.4, 150 mM NaCl, 5.0 mM β-ME) at 4ºC for 16 hours.
TuGST was concentrated using an EMD Millipore Amicon Ultra-15 concentrator
(Billerica, MA) with a 3,000 MW cutoff, and concentration was determined by A280 using
the molar extinction coefficient 50,880 M-1 cm-1 and MW 27,163 as determined by the
ExPASy ProtParam tool [37]. Concentrated protein was put on a Superdex 200 SEC
column attached to an ÄKTA Pure FPLC system (GE Healthcare, Marlborough, MA)
equilibrated in FPLC buffer (10 mM Tris pH 7.4, 150 mM NaCl). Peaks corresponding to
TuGST were pooled and the protein concentration was determined using the Bradford
method [68]. To remove the N-terminal his-tag from TuGST, it was subjected to TEV
protease cleavage. Briefly, pure TuGST (1-2 mg/mL) was incubated with TEV protease in
a 1:100 (w/w) protease/protein ratio and dialyzed for 12 hours in dialysis buffer at 4˚C.
After cleavage, TuGST was loaded onto an NiNTA column equilibrated in FPLC buffer
and TuGST was collected in the flow through and concentrated. Due to poor yields and
instability of TuGST, fusion partners for protein expression and a tagless construct were
pursued.
2.3 CLONING TUGST INTO PMCSG28, PMCSG29 AND PMBPCS1
pMCSG28 and pMCSG29 Cloning
Purification of TuGST with N-terminal his-tag resulted in very poor yields of
protein (around 3.0 mg per liter culture). Furthermore, TEV his-tag cleavage resulted in
most of the protein denaturing and the final yield of TuGST was less than one milligram
(data not shown). To increase TuGST yield, expression options with fusion partner
maltose-binding protein (MBP) were explored. Two plasmids, pMCSG29 (C-terminal
tested for their abilities to increase TuGST expression. An additional plasmid, pMCSG28,
was also used to generate a tagless TuGST construct that contains no terminal His-tag or
fusion partner.
The pMCSG28 and pMCSG29 plasmids were purchased from DNASU Plasmid
Repository (Tempe, AZ). These vectors are designed to express protein with a C-terminal
TEV-cleavable 6xHis-tag or N-terminal MBP, TVMV cut site, LIC site (gene insert), TEV
cut site and 6xHis-tag, respectively; however, the reverse insertion primer for pMCSG28
(pMCSG28-GST-R) was designed to include a stop codon on the insert so this vector could
be used for tagless TuGST expression. The vectors were amplified at the LIC site to
generate blunt ends for LIC using the primers pMCSG28/29-AMP-F and pMCSG28/29-R
listed in Table 2.1; both pMCSG28 and pMCSG29 contain identical LIC sites so only one
set of primers was needed to amplify both vectors. KOD polymerase (EMD Millipore,
Billerica, MA) was used following the manufacturer’s protocol with the addition of 1.0 M
betaine monohydrate. Thermalcycling was as follows: initial denaturation 95˚C for 2
minutes, 30 cycles of 95˚C for 20 seconds, 61˚C for 10 seconds and 70˚C for 2 minutes 30
seconds, followed by incubation at 4˚C. After PCR, the pMCSG28/29 products were
purified by gel excision.
TuGST in pJExpress411 was used as base template for all reactions that involve
amplifying the TuGST gene. The main sequence for TuGST was amplified with the
primers pMCSG28/29-GST-F and pMCSG28-GST-R for pMCSG28 insertion, and
primers pMCSG28/29-GST-F and pMCSG29-GST-R for pMCSG29 insertion listed in
Table 2.1. Primers were designed to make the insert compatible with ligation independent
polymerase (NEB) was used following the manufacturer’s protocol. Thermalcycling was
as follows: initial 98ºC for 30 seconds, 35 cycles of 98ºC for 10 seconds, 61ºC for 15
seconds, 72ºC for 10 seconds, a final extension at 72ºC for 30 seconds and an infinite hold
at 12ºC. For pMCSG29 insert amplification, KOD polymerase (EMD Millipore, Billerica,
MA) was used following the manufacturer’s protocol with the addition of 1.0 M betaine
monohydrate. Thermalcycling was as follows: initial denaturation of 95˚C for 2 minutes,
20 cycles of 95˚C for 20 seconds and 71˚C for 20 seconds, followed by incubation at 4˚C.
All PCR products were purified by gel excision.
Sticky ends for LIC were made by incubating gel excised PCR products with T4
DNA polymerase (NEB, Ipswich, MA). A 40 µL reaction containing about 300 fmoles of
vector (pMCSG28/29), 5.0 mM DTT, 2.5 mM dATP, 1X NEB2.1 buffer and 3.0 units of
T4 DNA polymerase, and a 40 µL reaction containing about 1000 fmoles of insert, 5.0 mM
DTT, 2.5 mM dTTP, 1X NEB2.1 buffer and 3.0 units of T4 DNA polymerase were
incubated at room temperature for 30 minutes. The T4 DNA polymerase was then
inactivated at 75ºC for 20 minutes and the reactions were mixed 10:10 at room temperature
for 5 minutes. Next, 1.0 µL of 25 mM EDTA was added and the reaction was incubated
another 5 minutes at room temperature. Transformation was performed with heat shock
after adding the 20 µL LIC reaction to chemically competent DH5-α E. coli cells and plated on LB-AMP (50 µg/mL) plates at 37ºC for 16 hours. Clones were miniprepped with a
GeneJET Plasmid Miniprep Kit (ThermoFisher, Grand Island, NY) and insertion of
TuGST was first confirmed by restriction digest with XhoI following the manufacturer's
instructions (NEB, Ipswich, MA). After restriction digest, clones with correctly sized
T7 forward and T7 reverse primers. Correct clones were transformed via heat shock into
chemically competent BL-21 (DE3) E. coli cells for protein expression.
pMBPcs1 Cloning
The construction of pMBPcs1 is described in Chapter 1.3 of this manuscript.
TuGST was prepared for LIC into pMBPcs1 by using primers pMBPcs1-GST-F and
pMBPcs1-GST-R listed in Table 2.1. For PCR, TuGST in pJExpress411 was used as
template and the protocol for Phusion polymerase was followed (NEB, Ipswich, MA). The
conditions for thermalcycling were as follows: initial 98ºC for 30 seconds, 35 cycles of
98ºC for 10 seconds, 70ºC for 30 seconds, 72ºC for 25 seconds, a final extension at 72ºC
for 1 minute and an infinite hold at 12ºC. PCR product was run on a 1.0% agarose gel and
gel excised using a ThermoFisher GeneJET Gel Extraction Kit (Grand Island, NY) and
eluted with sterile water.
Sticky ends for LIC were made by incubating gel excised PCR products with T4
DNA polymerase (NEB, Ipswich, MA). A 40 µL reaction containing about 400 fmoles of
pMBPcs1, 5.0 mM DTT, 2.5 mM dATP, 1X NEB2.1 buffer and 3.0 units of T4 DNA
polymerase, and a 40 µL reaction containing about 1500 fmoles of TuGST, 5.0 mM DTT,
2.5 mM dTTP, 1X NEB2.1 buffer and 3.0 units of T4 DNA polymerase were incubated at
room temperature for 30 minutes. The T4 DNA polymerase was then inactivated at 75ºC
for 20 minutes and the reactions were mixed 10:10 at room temperature for 5 minutes.
Next, 1.0 µL of 25 mM EDTA was added and the reaction was incubated another 5 minutes
at room temperature. Transformation was performed with heat shock after adding the 20
µL LIC reaction to chemically competent DH5-α E. coli cells and plated on LB-AMP (50
GeneJET Plasmid Miniprep Kit (Grand Island, NY) and insertion of TuGST was first
confirmed by restriction digest with HindIII and XbaI following the manufacturer's
instructions (NEB, Ipswich, MA). After restriction digest, clones with correctly sized
fragments were sent to EtonBioscience (Research Triangle Park, NC) for sequencing with
T7 forward and T7 reverse primers. Correct clones were transformed via heat shock into
chemically competent BL-21 (DE3) E. coli cells for protein expression.
2.4 TUGST EXPRESSION WITH PMCSG28, PMCSG29 AND PMBPCS1
Both fusion partner constructs (pMCSG29 and pMBPcs1) produced appreciable
amounts of protein (around 20 mg per liter culture) after NiNTA and FPLC purifications,
but using TEV protease to cleave 6xHis-tags would also result in most of the protein
denaturing and yield less than one milligram of TuGST, similar to pJExpress411
expression and purification (data not shown). However, purifying tagless TuGST
(pMCSG28) resulted in considerable yields of active protein (about 15 mg per liter culture).
Purification and expression was the same as pJExpress411 up to the sonication.
After sonication, lysate was dialyzed in 4.0 L of 25 mM Tris pH 7.5 at 4˚C for 12 hours.
Next, the lysate loaded onto a HiPrep DEAE FF anion exchange column attached to an
ÄKTA Pure FPLC system (GE Healthcare, Marlborough, MA) equilibrated in 25 mM Tris,
pH 7.5. A stepwise elution gradient with sodium chloride was used in increments of 100
mM up to 500 mM (data not shown). TuGST eluted off the column at 100 mM NaCl, was
concentrated, then loaded onto a Superdex 200 SEC column attached to an ÄKTA Pure
FPLC system (GE healthcare, Marlborough, MA) (Figure 2.1) equilibrated in 50 mM
HEPES pH 8.0 and 150 mM NaCl. Final yield of protein was around 14 mg per liter culture.
structure and kinetic results herein show that the protein is most likely homodimeric, as is
most common for GSTs [3, 69–71]. Furthermore, purified TuGST was run both on
SDS-PAGE and Native-SDS-PAGE; SDS-SDS-PAGE showed one band at 24 kDa as expected, but the
Native-PAGE showed the possibility of several oligomeric states (data not shown).
2.5 TUGST KINETICS
All reagents mentioned here were purchased from Sigma-Aldrich (St. Louis, MO),
Santa Cruz Biotechnology (Dallas, TX) or FisherScientific (Grand Island, NY). Data was
fit using OriginPro software (Northampton, MA). Several compounds that are known
targets of GSTs were tested which include GSH, 1-chloro-2,4,-dinitrobenzene (CDNB),
1,1,1-trichloro-2,2-bis(4-chlorophenyl)ethane (4,4’-DDT), chlorfenapyr (CP), permethrin
(PM), hydrogen peroxide, 1,2-epoxy-3-(nitrophenoxy)-propane (EPNP),
4-nitrophenethyl bromide (4NPB), 4-nitrobenzyl chloride (4NBC), 4-hydroxynonenal
(4HNE), ethacrynic acid (ECA) and 4-nitrophenyl acetate (4NPA)(Figure 2.2) by UV-Vis
spectroscopy in a ThermoFisher NanoDrop 2000 and processed with NanoDrop 2000
software (Grand Island, NY). The only compounds that seemed to exhibit any activity were
GSH and CDNB as measured at 340 nm with a molar extinction coefficient of 9600 M-1
cm-1 [64]. Reactions consisted of 10 mM GSH or 1.5 mM CDNB in 1.0 mL of 100 mM
HEPES pH 8.0 with a working TuGST concentration of about 47 nM; TuGST showed the
highest thermal stability in pH 8.0 buffer (data not shown). Reactions were performed in
triplicate, and background GSH reactivity with target compounds was subtracted from
reactions containing enzyme to determine the concentration of enzyme-conjugated GSH
products. Interestingly, TuGST showed positive cooperativity towards GSH binding
parameters are listed in Table 2.2. TuGST had a higher affinity for GSH than CDNB but a
lower Vmax. The specific activity for both substrates was very low (around 15
nmoles/min/mg of protein) relative to other GSTs [3, 64–66, 70, 72–75], and the kcat and
catalytic efficiency for CDNB were about 2-fold higher than those for GSH.
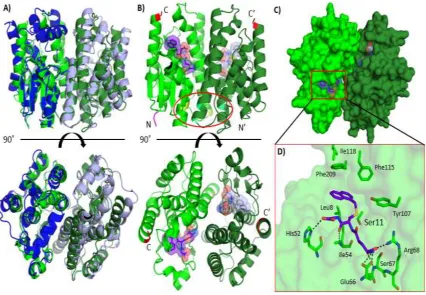
2.6 PREDICTED STRUCTURE OF TUGST
The structure for TuGST was predicted using the amino acid sequence for TuGST
(Uniprot: T1JQ77) in the SWISS-MODEL online program [76–78]. The template model
chosen was a silkworm delta-class GST from Bombyx mori (PDB code: 3VK9) with a 43.7% sequence identity (Figure 2.4). The Global Model Quality Estimation (GMQE) was
0.75 (range is from zero to one where one is more reliable predictions based on template
used and sequence alignment). The residue range was 1 to 214 with 0.99 coverage.
Measurements were made in COOT and structures made in PyMOL [79, 80].
The predicted structure of TuGST is shown in Figure 2.5A. Similar to other GSTs,
it is shown as a homodimer with two active sites. To observe potential substrate binding,
the predicted TuGST model was aligned with a human theta-class GST, hGSTT2-2 (PDB
code: 3LJR) (Figure 2.5A). Despite relatively low sequence identity (about 25%), aligning
the structures of predicted TuGST and hGSTT2-2 had an RMSD value of 1.2 Å (performed
in PyMOL [80]). Based on amino acid sequence TuGST appears to be a delta-class GST.
Theta-class hGSTT2-2 was chosen for comparison for two reasons: 1) hGSTT2-2 has the
ligand 1-menaphthyl glutathione conjugate bound which can be used as a homologous
model for substrate binding, 2) Cooperativity has been observed in hGSTT2-2, and
residues that may be the basis for this cooperativity are found in the predicted TuGST
In hGSTT2-2, the residues Tyr73, Leu89 and Ala93 correspond to Tyr73, Val89
and Ala93 in TuGST (Figure 2.5B) and may be responsible for cooperativity [66]. The
1-menaphthyl glutathione conjugate is modeled in the active sites of TuGST. Residues in the
G-site of TuGST include Ser11 (interacts with reduced thiol of GSH), His52, Ile54 (main
chain backbone salt bridge), Glu66, Ser67 (main chain backbone salt bridge) and Arg68
(Figure 2.5D) similar to those found in BmGST (3VK9 - Ser11, Gln51, His52, Glu66,
Ser67 and Arg68 with a difference in only one residue (Gln51 in BmGST corresponds to
Phe51 in TuGST) [81]; the Ile54 residue of BmGST could potentially form a salt bridge
with 1-menaphthyl glutathione conjugate similar to that of TuGST. Furthermore, residues
in the H-site potentially include Leu8, Tyr107, Phe115, Ile118 and Phe209 (Figure 2.5D)
similar to Tyr107, Tyr115, Phe119, Phe206 and Ser212 found in BmGST [81]. The
hydrophobic H-site residues in BmGST appear to be much bulkier than those found in
TuGST which may contribute to their difference in specificities.
2.7 DISCUSSION
The delta-class TuGST investigated here only had reactivity towards GSH and
CDNB. Initially, expression and purification of an N-terminal 6xHis-tagged TuGST in E.
coli lead to poor yields of protein, especially after cleaving the tag with TEV protease. The fusion partner MBP was also used and resulted in poor yields of TuGST. Only using a
construct with no tags or fusion partners resulted in appreciable yields of TuGST. All
constructs were tested for GST activity, and all of them except non-tagged TuGST
displayed extremely deficient GST activity (relative to the non-tagged construct; data not
shown). This observation may be explained by observing the predicted structure of TuGST.
GSH, and the C-terminal region contains residues responsible for binding hydrophobic
substrates. Adding a 6xHis-tag or fusion partner to either of the terminal ends may disrupt
the protein active sites and overall protein folding, which is a possible explanation as to
why these constructs had very poor GST activity or did not express well. Only after
expressing TuGST with no tags or fusion partners was activity observed by UV-Vis
spectroscopy.
Positive and negative cooperativity was observed for GSH and CDNB,
respectively. For most GSTs, a lock-and-key motif (example hGSTP1-1, PDB code: 6GSS)
is observed upon substrate binding, but an alternative “clasp” motif has been described in
the middle of the subunit interface for some GSTs [66]. It has been speculated that the clasp
motif behaves like two hands interlocking that may facilitate cooperativity [66]. Observing
the predicted TuGST structure, the residues to form a clasp motif are present, but
site-directed mutagenesis experiments would need to be performed to confirm this type of motif
and mechanism. Furthermore, negative cooperativity was observed in several GSTs upon
binding the toxic nitric oxide adduct dinitrosyl-diglutathionyl iron complex (DNDGIC)
[66]. The authors describe DNDGIC binding as a perturbation of normal enzymatic
activity, and that cooperativity is displayed as a means of possible cooperative
self-preservation [66].
The negative cooperativity may help to maintain residual conjugating activity of
GST against other endogenous toxins so complete GST activity is not lost [66]. A similar
situation may be true for the TuGST studied here, although it did not show reactivity with
almost any of the compounds tested. In this case, it is possible this TuGST may serve only
studies and instrumentation such as Surface Plasmon Resonance (SPR) or Isothermal
Titration Calorimetry (ITC) would provide more information on substrate binding than