visuaiisation
of paragraph-ievei metadata
Mischa Weiss-Lijn
Ph.D. Computer Science
This thesis is submitted for the degree of Doctor o f Philosophy of
University College London
December 02
Department of Computer Science
ProQuest Number: U642024
All rights reserved
INFORMATION TO ALL USERS
The quality of this reproduction is dependent upon the quality of the copy submitted.
In the unlikely event that the author did not send a complete manuscript and there are missing pages, these will be noted. Also, if material had to be removed,
a note will indicate the deletion.
uest.
ProQuest U642024
Published by ProQuest LLC(2015). Copyright of the Dissertation is held by the Author.
All rights reserved.
This work is protected against unauthorized copying under Title 17, United States Code. Microform Edition © ProQuest LLC.
ProQuest LLC
789 East Eisenhower Parkway P.O. Box 1346
This work examines the thesis that the interactive visualisation of paragraph-level
metadata can be used to increase the efficiency of goal-directed search in corporate
documents. The design of a tool to support goal-directed search via the visualisation of
paragraph-level metadata is explored, defined and implemented. A new evaluation
method, named best-case analysis, is developed and applied to determine the potential
utility of this tool.
A new visualisation, named GridVis, is described which displays a document’s
paragraph-level metadata. The design decisions are supported by task analysis,
evaluation and a review of the information visualisation literature. A new technique
based on interviews with users is developed to create metadata and metadata
taxonomies that will service common information needs.
An interactive prototype of GridVis is subjected to an experimental performance
evaluation. A qualitative analysis shows that performance could be improved if users
made more use of the information provided by GridVis. The only quantitatively
significant result was GridVis’ lower task time which prompted suspicion of GridVis’s
utility. GridVis was re-implemented to realise the design ideas inspired by the
qualitative analysis and user feedback.
A new evaluation method, named best-case analysis, is described. It makes use of
GOMS and information foraging theory to build a model that computes a ‘best-case’
performance. This is then compared to the benchmark performance of twenty four
domain experts using paper versions of the same documents. This evaluation method
reveals that GridVis potentially offers either higher recall or faster task times than
largely consumed by the extra navigation time required. If however the design were
improved to make it 50% faster to use, it would give performance that is broadly
Abstract ... 2
Contents ... 4
Table of fîgures... 13
List of Publications...21
Acknowledgments...23
Chapter 1 Introduction...26
1 Research questions and contributions...30
2 Thesis structure...32
Chapter 2 Background literature...36
1 Introduction...36
2 Metadata fo r use within documents...38
2 .1 Definition...38
2.2 Types of metadata... 39
2.3 Producing metadata...40
2.3.1 Managing semantic heterogeneity... 40
2.3.2 Structured documents...42
2.3.2.1 Mark-up languages for structured documents and m etadata...42
2.3.2.2 The pros and cons of structured docum ents... 44
2.4 Using m etadata...45
2.4.1 Metadata as a finding a i d ...45
2.4.2 Dynamic document creation - microdocuments and metadata...47
2.5 Section summary... 47
3 Information visualisation...49
3.1 Layout techniques... 49
3.1.1 Unstructured layouts...50
3.1.2 Structured layouts... 51
5
3.1.2.2 Grid structures... 54
3.2 Interaction techniques... 58
3.2.1 Dynamic querying... 58
3.2.2 Tightly coupled displays...58
3.2.3 Focus + context displays...60
3.3 Corpus visualisation...61
3.3.1 Visualisation of document metadata...61
3.3.2 Visualisation of category hierarchy...62
3.4 Single document visualisation...63
3.4.1 Visualisation of key word distribution in document surrogates...63
3.4.2 Visual document navigation and querying systems...67
3.4.3 Visualising document narratives...70
3.5 Section summary...72
4 Information seeking and information retrieval...74
4.1 Models of information seeking...74
4.2 The limitations of information retrieval techniques...76
4.3 Information seeking, document use and goal directed search in the w orkplace...78
4.3.1 Goal-directed search within-documents... 79
4.3.2 The allure of paper... 82
4.4 Section summary...84
5 Evaluation methods...85
5.1 Empirical techniques...85
5.1.1 Evaluation of within-document search to ols... 85
5.1.2 Evaluation of search result visualisations... 88
5.1.2.1 Information retrieval metrics in visualisation evaluations... 88
5.1.2.2 Alternative approaches to measuring performance... 90
5.1.2.3 Difficulties of measuring search performance of visualisations .... 91
5.2 Theoretical evaluation techniques... 91
5.2.1 General principles - rational analysis and cost structure... 92
5.2.2 GOMS a mature engineering modelling to o l... 93
5.2.3 Other types of cognitive m odelling... 95
5.3 Section summary...96
6 Information foraging theory... 97
6.2 The optimal diet selection algorithm ...102
6.3 Constructing models of information foraging... 105
6.4 Empirical support for information foraging th eo ry ...107
6.5 Section summary...110
7 Assumptions and limitations...I l l 7.1 A narrow focus on information retrieval in general and goal-directed search in particular...111
7.2 A focus on expert perform ance... 113
7.3 A focus on traditional information retrieval m etrics...115
7.4 A focus on quantitative comparative evaluation...116
8 Comparative review o f related work...118
8.1 Visualisation...118
8.1.1 Navigation with visual document overview s... 119
8.1.2 Navigation and search using visualizations of content distribution 120 8.1.3 Visualizations of metadata taxonomies...121
8.2 Hypertext and e-books...122
8.2.1 Outlining... 123
8.2.2 Unstructured hypertext navigation techniques... 124
8.3 Theoretical techniques for performance evaluation... 126
8.4 Section summary... 130
Chapter 3 The production and use of corporate documents and how metadata could fît in... 133
1 Introduction...133
2 The writer study...135
2.1 M ethod...135
2.1.1 Methods used for the data analysis...137
2.2 Results and discussion... 137
2.2.1 The document types produced at the Sainsbury’s logistics planning division...138
2.2.2 Can goals be expressed as metadata?... 139
2.2.3 Is the metadata replicating existing document organisation?...141
2.3 Sum m ary...142
3 The reader study...143
3.1 M ethod... 143
7
3.2.1 The characteristics of long life, information rich documents...145
3.2.2 Reading practices... 147
3.2.3 Characterising document reuse... 148
3.2.4 W riter’s understanding of the reader information needs... 150
3.2.5 Can goals be expressed as metadata?... 153
3.2.6 Is the metadata replicating existing document organisation?...154
3.3 Conclusion...154
Chapter 4 GridVis: a tool for supporting goal directed use through within-document metadata visualisation... 157
1 Introduction...157
2 Creating Content-Descriptive Paragraph-Level Metadata fo r Business Documents...159
2.1 Selecting the documents...159
2.2 Metadata Design and Production... 160
2.2.1 Tag G eneration...160
2.2.2 Tag applicability... 162
2.2.3 Tag Rationalization...164
2.3 Metadata Taxonomy Design and Production...165
3 Visualization D esign...169
3.1 Design M ethods...169
3.2 The Visualization D esign...170
3.2.1 O verview ...170
3.2.2 An Illustrative Scenario... 172
3.2.3 Design Rationale and Advanced Features...173
3.2.3.1 Grid orientation...173
3.2.3.2 Navigation history... 174
3.2.3.3 Paragraph context... 174
3.2.3.4 Making the grid scannable... 175
3.2.3.5 Supporting the use of ta g s ... 176
4 Alternative design features considered...181
5 System Implementation...183
5.1 Encoding the metadata in X M L... 183
5.2 The visualisation implementation... 185
Chapter 5 Initial evaluation... 187
1 User trial - Exploring the capabilities o f G ridVis...187
1.1 M ethod...188
1.1.1 Data analysis... 192
1.2 Results... 193
1.3 D iscussion... 194
2 Task analysis...197
2.1 Objects and the object taxonomy... 198
2.2 Actions, the goal structure and the procedural substructure... 200
2.3 Key goals and objects: a simplified task m o d e l...204
2.4 D iscussion...206
3 Experimental evaluation...207
3.1 M ethod... 207
3.1.1 The sam ple...208
3.1.2 The GridVis prototype and technical set-up... 208
3.1.3 The Documents... 211
3.1.4 Relevance ratings...212
3.1.5 Experimental design... 214
3.1.6 Data capture...216
3.2 Quantitative resu lts... 216
3.2.1 Analysis... 216
3.2.2 Retrieval performance results... 218
3.3 Qualitative results...219
3.3.1 Investigating strategy u se ... 219
3.3.1.1 Analysis procedure...219
3.3.1.2 Tag cell selection strategies... 222
3.3.1.3 Paragraph cell selection...224
3.3.2 Investigating the use of co-occurrence information in cell selection ... 228
3.3.2.1 Analysis procedure...228
3.3.2.2 Results - an exploration of the effect of paragraph cell selection strategy 230 3.4 D iscussion... 232
4 The problems o f empirical evaluation in a corporate environm ent 236
g
C h ap ter 6 A best-case analysis evaluation o f the potential of w ithin-docum ent
m etadata for goal-directed s e a rc h ... 240
1 Introduction...240
1.1 Best-case analyses...241
1.1.1 What is a best-case analysis?...241
1.1.2 The pros and cons of best-case analyses...243
1.1.3 Approaches to constructing best-case analyses... 245
1.2 Applying the best case evaluation approach to G ridV is... 246
2 Constructing the best case m odel...249
2.1 Strategy level model definition...250
2.1.1 Paragraph cell scent evaluation strategy...257
2.1.2 Tag scent evaluation strategy...259
2.1.3 Assumptions used in strategy level m odel... 260
2.1.4 Summary of the strategy level m o d el... 262
2.2 Performance level model definition...263
2.2.1 Currency Assumptions... 266
2.2.2 Scent models...268
2.2.2.1 Tag information scent m odel... 268
2.2.2.2 Paragraph cell information scent m odel... 270
2.2.3 Cost m odels...275
2.2.3.1 Models of actual c o s t...275
2.2.3.1.1 Tag choice cost m odel...277
2.2.3.1.1.1 Sanity check experiment...281
2.2.3.1.2 Paragraph cell choice cost model... 282
2.2.3.1.2.1 Sanity check experim ents... 287
2.2.3.1.3 Paragraph handling m odel...292
2.2.3.2 Models of expected cost... 297
2.2.3.2.1 Estimating GridVis navigation time...299
2.2.3.2.2 Estimating paragraph handling tim e ... 308
2.2.3.2.3 Estimating the mean patch choice tim e... 311
2.3 Section summary - an overview of the best-case m odel... 311
3 Paper performance experiment...313
3.1 Sample...313
3.2 M aterials... 314
3.2.1.1 Choice of document type...315
3.2.1.2 Varying document length... 316
3.2.1.3 Varying information need difficulty... 317
3.2.2 Developing representative queries...318
3.2.3 Relevance j udgements... 319
3.3 M ethod...319
3.3.1 Data transcription...322
4 Performance Metrics...324
5 Chapter summary...326
Chapter 7 Results from the best-case analysis... 327
1 The benchmark - performance and strategies with paper...327
1.1 Reading strategies...327
1.2 Task perform ance...333
1.3 The effect of document length...335
1.4 The effect of question difficulty... 338
2 How does the best-case GridVis performance fare against the benchmark?...340
2.1 Recall performance... 341
2.2 Precision performance... 344
2.3 Task time performance...345
2.4 Does the extra cost of navigation with GridVis outweigh the cost savings of the paragraphs avoided?...346
2.5 Does GridVis increase the quality and relevance of material found?... 348
2.6 The trade-off - balancing task time and retrieval effectiveness 349 2.7 The effect of document length...350
2.8 The importance of exploitation cost prediction...351
3 General discussion...353
3.1 Design im plications... 355
3.2 Critical assessment...355
4 Chapter summary...358
Chapter 8 Conclusions and further work ...360
11
1.1 A new approach for supporting goal-directed search within corporate
documents... 360
1.2 A new evaluation technique...363
1.3 Evaluation of the functional viability of interactive visualisations of paragraph-level m etadata... 364
2 Further work...366
2.1 Evaluation - alternative scenarios of u sa g e ...366
2.2 Paragraph-level metadata and its visualisation... 367
2.3 Information foraging models... 368
References 371 Appendix 1 - Results and discussion for the overview and sorting task in the user study... 384
1 D iscussion...385
Appendix 2 - Expert judge ratings... 387
Appendix 3 - Confîgurations of tag selection strategies... 390
Appendix 4 - GOMS models for tag and paragraph cell selection...393
2 GOMS model fo r tag selection in the GridVis Interface...393
2.1 High level goals...393
2.2 M ethods... 393
3 GOMS model fo r Paragraph cell selection times...396
3.1 Left to right strategy... 396
3.2 Applicability o n ly ... 396
3.3 Co-occurrence only... 397
3.4 Co-occurrence and restricted applicability... 399
4 Operator algorithm fo r get-from-task <cell-applicability>...401
Appendix 5 - Paragraph time coding procedure... 403
1 Codes assigned to paragraphs...405
Appendix 6 - Graphs showing full data for the effect of document length in the paper performance experiment... 407
1 Setting and measuring document length...413
13
Table of figures
( j \
(îk
and m inor
Figure 1 Thesis M ap. The location o f each m ajor and m inor co n trib u tio n 33
Figure 2 Sem N et (Fairchild, Poltrock & Furnas 1988). The im age on the left show s a
netw ork with random placem ent o f nodes w hile the other shows it once the graph
layout has been structured...50
Figure 3 Cone Tree (R obertson, M ackinlay & Card 1 9 9 1 )...53
Figure 4 O verview o f teaching resources (M archionini & Shneiderm an 1 9 8 8 )...56
Figure 5 The M atrix B row ser (Botsch & Kunz 1996)...57
Figure 6 PDQ T ree-brow ser (Kum ar, Plaisant & Shneiderm an 1997)... 59
Figure 9 The PopO ut Prism (Suh et al. 2 0 0 2 )... 66
Figure 10 The D ocum ent Lens (M ackinlay & R obertson 1993)... 68
Figure 12 Three docum ent visualisations (H ornbæ k & Frpkjæ r 2 0 0 1 )...69
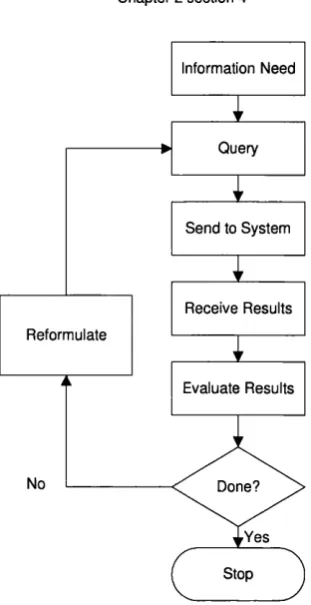
Figure 13 A general model o f inform ation seeking (H earst 1999)... 75
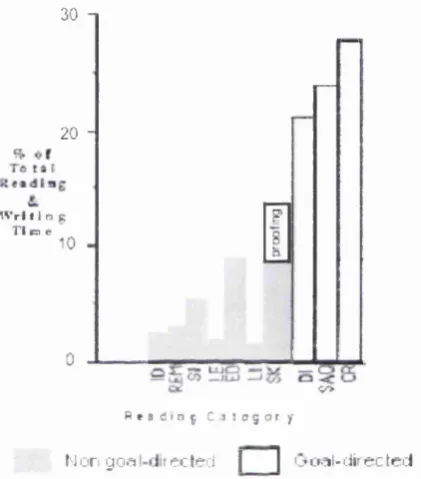
Figure 14 The prevalence o f goal-directed, and non goal-directed types o f reading, adapted from A dler et al (A dler et al. 1998)... 80
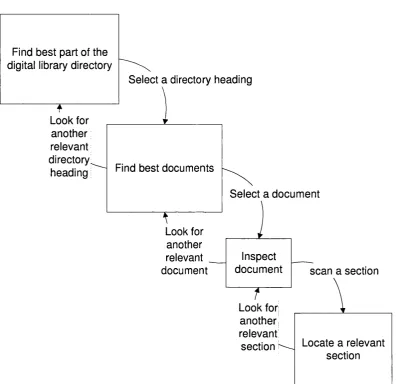
Figure 15 S earching in a digital library; characterised as a repeating cascade o f patches and item s... 101
Figure 16 An exam ple o f the relationship o f betw een item profitability and the profitability o f diets including item s 1,2 ,... k ... 105
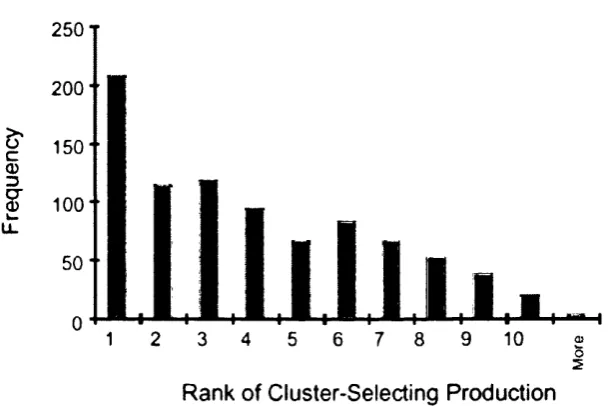
Figure 18 On the y-axis, this graph shows the probability of the next cluster not being
selected, subtracted from probability of it being selected. On the x-axis, it shows
the profitability of the next item, minus the profitability of the current diet. More
simply, whether a cluster will be selected is shown on the y-axis, and whether the
profitability for the current item is larger than that for those already selected is
shown on the x-axis... 109
Figure 19 The proportion of goals with each level of diffuseness and evaluativeness
rating. The portions of the graph that are hashed out indicate those goals which are
not metadata expressible... 141
Figure 20 Recall and precision, for the goals predictions made by writers of four
documents (one reader/participant for each docum ent)...151
Figure 21 Recall and precision for predictions of the portions of text needed by reader
... 152
Figure 22 The proportion of goals with each level of diffuseness and evaluativeness
rating. The hashed portions of the graph indicate those goals which are not
metadata expressible... 154
Figure 23 The components of the GridVis visualisation... 171
Figure 24 The paragraph cells relating to the tag selected are given a different highlight
colour, allowing the user to locate them effortlessly... 176
Figure 25 A simplified flow diagram of the task model showing the main portions of the
task, the objects (in bold),the input to the task the decision points O , the
actions O , and the cell selection strategies (dotted blue lin e s)... 177
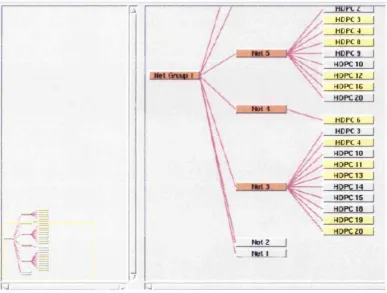
Figure 27 The structure of the XML documents visualised by GridVis. (Dotted lines
15
Figure 28 Screen shot of prototype GridVis mock-up used... 190
Figure 29 Evaluation interface for the goal-directed search ta sk ...191
Figure 30 The object taxonomy...200
Figure 32 A simplified flow diagram of the task model showing the main portions of the
task, the objects (in bold),the input to the task the decision points O , the
actions O , and the cell selection strategies (dotted blue lin e s)...205
Figure 33 A screenshot of the version of GridVis used in the experimental evaluation
...209
Figure 34 GridVis as used in the experiment...210
Figure 35 Screenshot of the setup for the ‘without GridVis’ condition...211
Figure 36 The mean scores for each tag selection strategy across all participants, show
as percentage of total score...223
Figure 37 The mean scores for each paragraph cell selection strategy across all
participants show as percentage of total score... 224
Figure 38 Scores for each paragraph cell selection strategy across three participants with
a similar configuration of strategies, shown as percentage of total score... 225
Figure 39 Scores for each paragraph cell selection strategy across six participants with a
similar configuration of strategies, shown as percentage of total score... 226
Figure 40 Interactive recall and traditional precision for the top ranked 3^^of paragraph
cells using each of 3 different paragraph selection strategies... 231
Figure 42 A simplified flow diagram of the task model showing the main portions of the
task, the objects (in bold), the input to the task c u , the decision points O , the
Figure 43 An overview of the best-case m odel...252
Figure 44 The use of GridVis seen as a cascade of patches and item s... 255
Figure 45 Illustration of the three different types of information available for judging
the information scent of paragraph c e lls ...258
Figure 46 Overview of GridVis best-case m odel... 262
Figure 47 Overview of the tag choice portion of the performance level m o del 265
Figure 48 Overview of the paragraph cell choice portion of the performance-level best-
case m odel... 266
Figure 49 A scatter plot showing the correspondence between information value
predictions based on applicability alone and the actual information values from the
expert judge relevance ratings...272
Figure 50 A scatter plot showing the correspondence between information value
predictions based on co-occurrence alone and the actual information values from
the expert judge relevance ratings... 273
Figure 51 A scatter plot showing the correspondance between information value
predictions based on applicability and co-occurrence and the actual information
values from the expert judge relevance ratin gs...275
Figure 52 An illustration of how the actual cost models, I , are broken down, and
what data, / / , is used to set their parameters...276
Figure 53 The basic structure of the tag choice NGOMSL m odel... 277
Figure 54 Chart illustrating the discounting of tag choice cost each time a section is
17
Figure 55 Human and GOMS times for tags choice. The trials are shown in sequential
order; thus, repeated section tags indicate section revisits...282
Figure 56 Illustration of the cost model for the LtoR strategy...283
Figure 57 Ilustration of the cost model for the AppOnly strategy...284
Figure 58 Ilustration of the cost model for the CoocOnly strategy... 285
Figure 59 Ilustration of the cost model for the Cooc&RestrictedApp strategy 285 Figure 60 Human and GOMS cell choice times using the LtoR strategy... 289
Figure 61 Human and GOMS cell choice times using the AppOnly strategy...290
Figure 62 Human and GOMS cell choice times using the CoocOnly strategy 291 Figure 63 Human and GOMS cell choice times using the Cooc&RestrictedApp strategy ... 292
Figure 64 Scatter plot of paragraph length against predicted and actual times (from the paper performance experiment) for paragraphs that are ultimately accepted 294 Figure 65 Scatter plot of paragraph relevance rating (i.e. information value) against predicted and actual times (from the paper performance experiment) for paragraphs that are ultimately accepted... 295
Figure 66 Scatter plot of paragraph length against actual and predicted times for reading paragraphs that are utlimately rejected... 296
Figure 67 Scatter plot of paragraph relevance (i.e. information value) against actual and predicted times for reading paragraphs that are ultimately rejected...296
Figure 69 An illustration of the components of expected cost, I , and what data,
/ / , is used to set their param eters...299
Figure 70 An illustration of how the tag selection cost is broken down into various
components, I I , and what data, / / , is used to set their values and
accompanying coefficients and constants O ... 300
Figure 71 An illustration of how the estimation section selection cost is broken down
into various components, I I , and what data, / / , is used to set their values and
accompanying coefficients and constants O ... 304
Figure 72 The percentage difference between the predicted and ‘actual mean number of
unvisited paragraph cells’ (shown as a percentage of the actual number of unvisited
cells). The cross hair drawn with a dotted line, illustrates that the error tends to 0
when ‘actual mean number of cells on a tag’ tends to, 3, its mean...307
Figure 73 A query with two constraints on relevance, indicated by the grey panels. ..317
Figure 74 The collated data on reading strategies and the transitions between them, from
interview and observational data. Transitions that were only evidenced by one
subject have been excluded to clarify the overall picture. By starting at the top and
tracing a path downwards, one can appreciate the use of multiple layers of reading
strategy, which increase in cost as the expected relevance of material increases. 331
Figure 75 The mean time taken to complete a question for different document lengths.
... 336
Figure 76 The mean result and traditional precision, and ‘proportion of reading time
spent reading relevant’ across the different document lengths... 337
Figure 77 The mean recall across the different document lengths...338
19
Figure 79 Core and Peripheral recall scores... 343
Figure 80 Precision performance scores... 344
Figure 81 Task time performance... 345
Figure 82 The dependence of task time on the cost estimates for GridVis usage. The
results for paper are not part of the sensitivity analysis, but are included to enable
comparison... 346
Figure 83 Scores for the proportion of time spent reading and navigating... 347
Figure 84 Results from the sensitivity analysis of the proportion of times spent reading
and navigating...348
Figure 85 The rate of gain or profitability (information units per second)...349
Figure 86 Results from the sensitivity analysis for the rate of information gain 350
Figure 87 An illustration of when paper or GridVis is advantageous... 354
Figure 88 Scores for each tag selection strategy across four participants with a similar
configuration of strategies, shown as percentage of total score... 390
Figure 89 Scores for each tag selection strategy across two participants with a similar
configuration of strategies, shown as percentage of total score... 391
Figure 90 Scores for each tag selection strategy across two participants with a similar
configuration of strategies, shown as percentage of total score... 391
Figure 91 Scores for each tag selection strategy across two participants with a similar
configuration of strategies, shown as percentage of total score... 392
Figure 92 The individual participant times and the mean scores, for core recall against
Figure 93 The individual participant times and the mean scores, for peripheral recall
against document length...408
Figure 94 The individual participant times and the mean scores, for overall recall
against document length...409
Figure 95 The individual participant times and the mean scores, for task time against
document length...409
Figure 96 The individual participant times and the mean scores, for interactive precision
against document length... 410
Figure 97 The individual participant times and the mean scores, for traditional precision
against document length... 411
Figure 98 The individual participant times and the mean scores, for proportion of
reading time spent with relevant against document len g th ... 412
Figure 99 The individual participant times and the mean scores, for task time against
21
List of Publications
An early version of Chapter 4 has been published in:
Mischa Weiss-Lijn, Janet T. McDonnell, Leslie James (2002) Interactive Visualization of paragraph-level metadata to support corporate document use. Visualising the Semantic Web, Vladimir Geroimenko and Chaomei Chen (Eds.) Springer Verlag, Nov 2002
Portions of chapter 4 have also appeared in:
• Mischa Weiss-Lijn (2002) Visualisation de métadonnées pour facilité rutilisation des documents. IHM ’2002, Poitiers
The experimental evaluation reported in section 3 of chapter 5 has been published in:
• Mischa Weiss-Lijn, Janet T. McDonnell, Leslie James (2002) An empirical evaluation of the interactive visualization of metadata to support document use. Lecture Notes in Computer Science - Visual Interfaces to digital libraries (in press)
This evaluation, along with portions of chapter 4, was also summarised in:
• Mischa Weiss-Lijn, Janet T. McDonnell, Leslie James (2001) Supporting document use through interactive visualization of metadata. Visual Interfaces to Digital Libraries - Its Past, Present, and Future, ACM-i-IEEE Joint Conference on Digital Libraries, June 28th 2001
These parts of the thesis are also covered, along with a discussion, from section 4 of
chapter 5, on the difficulties of doing empirical evaluations in the workplace, in:
• Mischa Weiss-Lijn, Janet T. McDonnell, Leslie James (2001) Visualising Document Content with Metadata to Facilitate Goal-directed Search. International Symposium of Visualisation of the Semantic Web, IV2001 25 - 26 - 27 July 2001
An early formulation of the best-case analysis approach, and its application to GridVis, is
23
Acknowledgments
A great many people have at some stage been involved in work that has found its way
into this thesis.
First and most formally, this research was sponsored by J Sainsbury pic and undertaken
within the Postgraduate Training Partnership established between Sira Ltd and
University College London. Postgraduate training partnerships are a joint initiative of
the DTI and the EPSRC.
The work in this thesis was supported by and carried out in three institutions,
Sainsbury’s, Sira, and UCL.
At Sainsbury’s, the energy and enthusiasm of the now disbanded knowledge group,
inspired and fuelled the first year and a half of research. Marc Venables, Zahir Bashir,
Ian Hawkins, Stuart Robinson all took an active interest in my work and helped form
my early ideas. Duncan Wilson, my guardian and mentor at Sainsbury’s, was
instrumental in enabling me to involve the people and problems of Sainsbury’s in the
research. His diligence in protecting me from the frequent waves of corporate
reorganisation was such that I am the only member of the knowledge group to survive
them. When the knowledge group was disbanded, Duncan left me in the capable hands
of Leslie James. Leslie, and his Strategy Research Team (referred to later as the
‘frontier users’), provided a me with a huge amount of support. Leslie, Clair, Dave, and
Rob, were all repeatedly willing to take time out to act as volunteers for the various
experiments, user tests, and metadata production tasks which needed to be done by
sense of good design, contributed enormously. Finally, thanks are due to the many
people at Sainsbury’s head office who kindly agreed to be subjects in my experiments.
Sira provided me with a place to work, free lunches, vocational training, and most
importantly of all, the wise counsel of Dr John Gilby. Despite a very busy schedule,
John was always willing to give me the time I needed, fearlessly diving into the details
of any mathematical and algorithmic tangles I’d got myself into. His advice was always
practical but encouraging, keeping me on the narrow winding path to completion.
At UCL I started life in the Virtual Environments research group under the tutelage of
Mel Slater. He guided me through the first year and a half with insightful critiques and
a wealth of ideas. The Virtual Environments group provided me with a congenial and
welcoming base. Manuel Oliveira was the exemplary PhD student with whom I shared a
desk. He always took an active and constructive interest in my work, giving the harsh
but true critiques that I needed to hear.
When my work moved out of Mel Slater’s domain, Janet McDonnell bravely took me
on as her PhD student. She has always been there, to help clarify problems thrown up by
the research, and to untangle the narratives in my writings. Janet guided me through the
subtlies of doing research in a corporate context and helped me kick the ‘modelling’
habit enabling me to accept that the best-case model was finally finished.
Once under Janet’s wing, I moved to the multimedia lab. Here I was able to discuss my
work and the information seeking literature with Simon Attfield who was one of the
very few people around whose research interests overlapped with mine. John McCarthy,
my former employer and desk mate, provided invaluable advice on statistics. I ’d also
like to thank the rest of the lab for helping with momentous task of proof reading my
25
several occasions, to give me invaluable advice on aspects of HCI and research
methodology.
I must of course thank Anne Poméry, my darling girlfriend, who never managed to
understand why I was researching in this area, but always gave me the love and
affection I needed. Finally there is my (nuclear) family who were almost able to explain
what my thesis was about, after just four years. They housed me and fed me once my
Chapter 1
Introduction
Large corporations have for many years attempted to improve the way they use, manage
and distribute information and knowledge. Among these attempts, a number of
technologies have been introduced to support the use of documents. Documents are a
major repository of corporate knowledge; their use is woven into the fabric of office
work. Thus, improvements in the tools for document use can contribute directly to
increased productivity.
In general, currently used technologies, offer incomplete support for document use. For
example, many companies have recently deployed intranet systems to more effectively
store and distribute documents (IDC 2001). These technologies offer incomplete
support for document use because they focus on document delivery. This is problematic
because a substantial portion of document use consists of goal-directed searches where
only a portion of the document is required. Thus although the digital support stops once
a desired document is found, the search does not. This suggests that there is an
opportunity to improve matters by extending the digital support for search to within-
document search.
Digital support for within-document search could have a substantial impact despite the
widespread use of paper for reading documents. As early dreams of the paperless office
have withered, it has been argued that paper persists because it offers important
affordances^ that are difficult to reproduce in electronic form (Sellen & Harper 1997).
Chapter 1 section 1 27
reading (Adler et al. 1998; Sellen & Harper 1997) document related tasks accounted for
between 97% and 82% of total work time. In one of the studies just under 50% of this
time was spent with a combination of paper and electronic documents (Sellen & Harper
1997). Both studies found that about 13% to 14% of the time was spent with digital
documents alone. Thus, tools which improve the efficiency of on-screen document use
could be of value to corporations.
Documents are used in a wide variety of ways; the research presented in this thesis
focuses on goal-directed search which is an important and prevalent class of document
use. Goal-directed search can be defined as “sampling information in the text which
satisfies the goal of the search” (Adler et al. 1998, p. 244). Documents are used for goal-
directed search, cross-referencing, skimming, prolonged linear reading, annotation
(Adler et al. 1998), and even used as tangible symbols to convey social messages
(Sellen & Harper 1997). They are integral to many different types of work such as
writing, analysis, discussion and collaboration. This research focuses on attempting to
support goal-directed search because it is part of a variety of important work activities
such as writing and analysis, and is itself a prevalent workplace activity.
This research examines one of a number of possible avenues (Sellen & Harper 1997) for
improving the digital support of document use. One approach, currently pursued by the
e-book community, is to develop new hardware that reproduces some of paper’s
affordances such as legibility, portability and annotatability (Schilit, Price &
Golovchinsky 1998). Alternatively, software tools can be developed to better support
document use with standard hardware. The use of string searching, e.g. a ‘find in page’
function, is a typical widely used example. Similarly outlining is sometimes used to
show document structure and content via a tree view of headings. More recently,
researchers have attempted to apply techniques from the field of information
visualisation to support document use. For example, visualisation has been used in
combination with string searching to visualise the distribution of the keywords being
sought. Another approach has been to generate visual thumbnails which convey large-
scale features such as section and paragraph boundaries and illustrations. Another, new,
approach is explored and evaluated in this thesis; the interactive visualisation of
paragraph-level metadata.
The interactive visualisation of paragraph-level metadata is an attractive avenue to
explore for a number of reasons. Firstly, paragraph-level metadata can give accurate
descriptions of content which are tailored to the interests of its users. It can do so using
the local language of the users, thus reducing problems introduced by variations in
vocabularies used (Furnas et al. 1987). These descriptions can be aggregated at multiple
levels of both structure and content. A user can examine the content at the level of any
aggregate of paragraphs present in the document such as sub-sections or section. Thus,
they can work at a level of granularity appropriate to their needs. If the metadata sits in
a taxonomy, the user can also look for content related to categories which collect
together numerous related pieces of metadata. Finally, in combination with the use of
information visualisation techniques this paragraph-level metadata can be used to show
the presence, location and extent of content in a document.
Although the development of new technologies is in itself valuable, their evaluation is
perhaps more so. Evaluation is crucial in both practical and academic terms. It is needed
to determine the potential for actual deployment of a new technology. If a tool is to be
Chapter 1 section 1 29
significant advantages. This is especially true for the use of paragraph-level metadata,
where there will be a significant cost associated with production of the metadata.
Evaluation is also needed in order to make a complete and useful contribution to the
field of human-computer interaction (HCI). Without evaluation, the utility of any
avenues explored is uncertain. It would be unclear whether these avenues can be can
safely ignored by future research, or profitability pursued.
In HCI research, what is of most value is the potential of the class of designs being
explored through the development of a particular system. Minor design problems, the
shortcomings of a prototype implementation or the inexperience of users can be
overcome by further design, development work and training if there is sufficient
potential to warrant it. It is thus valuable to be able to directly assess the potential of a
design. Since interactive software rarely meets completely novel goals, its potential can
often usefully be assessed by comparing its potential performance to that of a
benchmark, i.e. an existing means to achieve the same goals. In this research, a new
evaluation methodology, best-case analysis, is developed and demonstrated, which
1
Research questions and contributions
The discussion above leads to three research questions:
1. How can the interactive visualisation o f paragraph-level m etadata be used to
support goal-directed search, w ithin-docum ents, in a corporate environm ent?
2. Can an interactive visualisation o f paragraph-level m etadata be used to deliver
w orthw hile support o f goal-directed search, w ithin-docum ents, in a corporate
environm ent?
3. How can the potential of a class o f designs be evaluated, rather then the
perform ance o f a particular im plem entation?
T hese in turn result in three m ajor contributions and a num ber o f m inor contributions.
The m ajor contributions are:
2
An approach to visualising w ithin-docum ent m etadata w hich facilitates goal-
directed search w ithin-docum ents
A new evaluation m ethod which allow s the ultim ate potential o f a class o f designs
to be assessed
An evaluation of the utility o f the interactive visualisation o f paragraph-level
m etadata in the support of goal-directed search w ithin-docum ents
The m inor contributions are:
1 _ „
A characterisation o f the docum ents suitable for enrichm ent with paragraph-level
Chapter 1 section 1 31
A new m ethod fo r soliciting m etadata and m etadata taxonom ies that are focused
on the inform ation needed to discrim inate relevant m aterial
The application o f a best-case analysis to an inform ation seeking tool
A characterisation o f the high-level strategies used in goal-directed reading
The uncovering o f theoretical grounds, in inform ation foraging theory, that
suggest the im portance, for inform ation seeking tools, o f cues w hich com m unicate
2
Thesis structure
To convey the structure of this thesis, each chapter is described very briefly at first and
summarised by the thesis map in Figure 1, the contents of each chapter are then
described in more detail. Chapter 2 reviews the literature in the fields related to this
work. It describes relevant background material and lays out the evidence to warrant the
choice of techniques used later in the thesis for design and evaluation work. Chapter 3
reports two exploratory studies of document use in a corporate environment which
sought to assess the feasibility of using paragraph level metadata. Chapter 4 describes
the design of GridVis, an interactive visualisation of paragraph-level metadata to
support goal-directed search. Chapter 5 reports user trials, task analysis, and
experimental evaluation that were used to assess and further refine the design of
GridVis. Chapter 6 describes the best-case analysis used to ascertain the potential
performance of the interactive visualisations of paragraph-level metadata as embodied
by GridVis. Chapter 7 reports the results of this evaluation, and Chapter 8 ties together
the conclusions and contributions of this research and suggests avenues for further
work. Figure 1 illustrates the way each of these chapters fit into the thesis as a whole,
and locations of the various contributions enumerated in section 1. The content of each
Chapter 1 section 2 33
G
Ch 1 - Introd uctionBackground investigation Evaluation
Ch 2 - B a ckground Literature
M eta data literature Inform ation seeking Inform ation visualisation Inform ation foraging Evaluation m ethods Related w ork
Ch 3 - C o rp orate d oc um ents and how m etadata could fit in
W riter study
interview s 7 p a rticip a n ts
R eader study
inte rview s 4 pa rticip a n ts C h a ra c te risa tio n of d o c u m e n ts u s e d C h a ra c te risa tio n of d o c u m e n ts su itab le for e n ric h m e n t with p a ra g ra p h -le v e l m e ta d a ta Investigation Into n u m b e r th e g o a ls th a t a re m e ta d a ta e x p re ssib le
Design a nd prtxluction
Ch 4 - G ridV is C o nstru ction
Selecting the docu m en ts M eta data Design and Production M eta data Taxo nom y D esign and P roduction
Interview with 8 p a rticip a n ts, k P ro v id e d inform ation o n inform ation
n e e d s a n d w hat is n e e d e d to d isc n m in a te rele v an t m a teria l
Selecting the docu m en ts V isualization Design
Ch 8 - C o n clu sio n s and further w ork
C o nclusions and contributio ns Further w ork_____________________
Ch 5 - Initial e v a lu atio n
U ser trial
4 p a rtic ip a n ts • 3 re a d in g ta s k s with GridVis (overview , g o a l-d ire c te d s e a r c h a n d sorting)
T a sk analysis E xp erim e nta l e va luation
12 p a rticip a n ts - G ridVis v s. S c rolling w indow - within s u ^ e c t s d e s ig n
E xpert ju d g e ratin g s for p a ra g ra p h r e le v a n c e
Ch 6 - A best-case ana lysis
^ ^ e s t - c a s e ana lyses in the abstract
T h e p r o 's a n d c o n 's o l b e s t- c a s e a n a ly s e s
he best case ana lysis of G ridV is ^ S t r a t e g y - le v e l defin ition
S tudy to identify ta g s c e n t s tra te g y (2 p a rtic ip a n ts se le c tin g ta g s with in s tru m e n te d v e rsio n o l GridVis)
P e rform an ce-level definition
G O M S m o d e ls lo r G ridVis u s e
% M odels o l e x p e r ie n c e ■ U n e fitting to d a ta from d o c u m e n ts a n d P a p e r P e r fo r m a n c e E x p erim e n t
T he ben ch m a rk - P aper p e rform ance expe rim en t
24 su b je c ts . G o a W ir e c te d s e a r c h with p a p e r d o c u m e n ts . R etrieval p e rf o rm a n c e a n d p a ra g ra p h re a d in g tim e s m e a s u r e d u s in g v id e o f o o tag e .
M a te r ia ls
D o cu m en t s e le c tio n a n d m anipulation E x p ert ju d g e r a tin g s for p a ra g ra p h r e le v a n c e Q u e ry c o n sfru ctio n
P erform ance m etrics
Ch 7 - R esults fro m th e best-case a n a lysis
/ ^ e b e n chm a rk p e rform ance
N ^ ^ n a l y s i s of high le vel re a d in g str a te g ie s V A nalysis of ta s k p e rfo rm a n c e
G ridV is Vs B e nchm ark perform ance
Figure 1 Thesis Map. The location o f each major
,-,Q)
and m inor%
contributionC hapter 2 review s literature from the various areas related to this research. Section 2 on
m etadata describes docum ent m etadata from different traditions, looks at som e o f the
issues surrounding its production, and review s the w ays it has been used to support
search w ithin docum ents. A section on inform ation visualisation, section 3, review s its
various techniques and fields evidence to w arrant the design choices in the developm ent
o f G ridV is. The follow ing section, section 4, draw s on theories o f inform ation seeking
to argue for the potential utility of m etadata taxonom ies, and uses evidence for the
im portance o f goal-directed search in the w orkplace to argue that it is w orth supporting
and notes the continuous prevalence o f paper docum ent use. The next section, 5, looks
at evaluation m ethods. It exam ines the em pirical m ethods and m etrics used to evaluate
methods are described and the particular choice of techniques used in this research is
justified. One of the more recently developed of these techniques, the use of information
foraging theory, is the subject of the following section, 6, where its foundations, use and
validity are discussed. The final section, section 8, covers visualisation work related to
the work in this thesis, it is critically assessed and the inadequacies of evaluation
techniques which might substitute for the best-case method developed in this research,
are exposed.
Chapter 3 reports two exploratory studies of document use in the head office of a large
UK retailer which attempted to examine the feasibility of using paragraph-level
metadata to support goal-directed search within corporate documents. A subset of the
documents used are identified as being suitable for enrichment with metadata. Their
characteristics are described. An analysis of the goals workers bring to documents they
read examines the degree to which these goals can be represented with metadata made
up of keywords or noun phrases.
Chapter 4 describes the design and construction of GridVis, an interactive visualisation
of paragraph-level metadata. The techniques used to construct the high quality metadata
needed are described in section 2. These include techniques adapted from previous
research and a novel technique developed in this research, to elicit the information used
to discriminate relevant material. The design of GridVis is described in section 3; the
contribution to the design, of evidence from numerous rounds of evaluation, is
discussed.
Chapter 5 reports a user trial, task analysis and experimental evaluation of GridVis. In
section 1, the description of a user trial of an early static mock-up of GridVis supports
discussion of a number of design problems and highlights methodological concerns. A
Chapter 1 section 2 35
reported for use in a review of the GridVis design (see section 2). The final section of
this chapter, section 3, describes the evaluation of a full implementation of an improved
design, using a controlled experimental comparison with a simple scrolling window.
Results from this experiment are used to argue for the need for an evaluation
methodology which can assess the ultimate potential of a class of designs.
Chapter 6 describes the best-case analysis method and its application to the interactive
visualisation of paragraph-level metadata. The best-case analysis method is described in
section 1.1. Its general advantages and limitation are discussed. In section 2 the best-
case model of GridVis use which incorporates information foraging theory is described.
First, in section 2.1, the model is described at a high, or strategy level. Then, in section
2.2, it is described at a computational, or performance level. Section 3 describes an
experiment to measure human goal-directed search performance with paper documents.
Chapter 7 reports the results of the best-case analysis. The results from the experiment
on performance with paper are reported first in section 1. The navigational strategies
used with paper are described and used to argue the validity of comparing the
performance on paper with that computed by the best-case model of GridVis. The best-
case performance of GridVis is compared with that of paper in section 2. The relative
advantages of various affordances offered by GridVis are reported and an assessment is
made of the general viability of interactive visualisations of paragraph-level metadata.
Chapter 8 summaries the contributions and conclusions offered by this research and
Chapter 2
Background literature
1
Introduction
In this chapter literature from various related fields is reviewed to portray the context of
the research, lay out the evidence behind the direction of this work, explain the
theoretical and methodological tools used, gather together evidence used to warrant the
research and design decisions made and critically evaluate related work.
A section on metadata, section 2, lays out the different traditions in which metadata has
been used, and describes some systems which have used it at a sub-document level. It
covers the various technical standards and tools with which paragraph-level metadata
can be produced and discusses problems of metadata production and their associated
solutions. The following section, section 3, on information visualisation, reviews the
various techniques used in the design work of this thesis, and fields evidence to warrant
the design choices made. Next, section 4, uses the theoretical work on information
seeking to argue for the potential utility of metadata. It goes on to review standard
information retrieval techniques, and their suitability for searching within documents.
Finally, it reviews studies of workplace document use to argue the importance of goal
directed search, and the suitability of paper as a benchmark against which technologies
for within-document search can be compared. The following section, section 5, on
evaluation methods reviews the range of empirical and theoretical techniques that have
been, or could be, applied to document search tools. Lessons are drawn for the empirical
evaluation carried out in this research and the choice of theoretical techniques is
justified against a background of alternatives. In section 6, one of the more novel
Chapter 2 section 1 37
to prepare the reader for its use in the evaluation work described in Chapter 6. Finally
section 8, surveys related work, looking at previous attempts to support within
document search and existing evaluation techniques contrasting them with the tool and
2
Metadata for use within documents
This section looks at document metadata, since the research presented in this thesis
explores the potential of paragraph-level metadata that describes the semantic content of
corporate documents.
The section starts by distinguishing between metadata arising from the library
cataloguing tradition, and that coming from the artificial intelligence and knowledge
based systems community. Turning to the production of metadata, the problems caused
by semantic heterogeneity are described and the solution applied such as the use of
controlled vocabularies, are discussed. Structured documents and the mark-up
languages that they use are reviewed. The high cost of producing such documents
means that production must either be sufficiently incentivised or be done by specialists.
The rise of structured documents on the web (via XML) and the accompanying
metadata standards such as PICS and Dublin Core are then covered. Finally, the uses of
within-document metadata as a finding aid and in dynamic document assembly are
discussed.
2.1
Definition
Most simply and most broadly, metadata is data about data. It has many uses, from
library catalogues to non-textual corporate data (De Carvalho Moura, Campos &
Barreto 1998). The research presented in this thesis, however, attempts to support goal-
directed search and therefore is concerned with semantic document metadata, i.e. data
about document content. Also, it is important that the metadata is human readable.
Although some forms of metadata are meant primarily for consumption by computers,
computers can only manage a relatively impoverished understanding of much content-
Chapter 2 section 2 39
2.2
Types of metadata
Here we shall look at two different types of document metadata arising from two
different disciplines: information science and artificial intelligence (AI).
The computerisation of library catalogues in the early seventies led to the development
of sophisticated standards for bibliographical metadata. These are characterised by the
Machine Readable Catalogue (MARC) (American Library Association 1996) and the
more modem and flexible Encoding Archival Description project (EAD) (Swetland
1996). These standards define fields for a large range of information. A minority of
these fields, such the ‘subject headings’ or ‘subject’ field, describe an item ’s semantic
content. These ‘subject heading’ fields are often populated using standardised
classifications systems such as the Library of Congress Subject Headings (LCSH 2002)
(discussed further in section 2.3.1). Essentially, in this thesis, the metadata used is very
similar to such subject headings, but instead of being applied at the document level, they
are applied at the paragraph level.
In the artificial intelligence and knowledge-based system communities an ontology is
most commonly defined as, “an explicit specification of [...] the relevant concepts of
[...] some phenomenon in the world” (Benjamins et al. 1999, p. 691). It can contain a
number of modelling primitives including classes, relations, functions, axioms and
instances.
Ontologies can be used in the production of document metadata rich in formally
encoded knowledge to enable the use of AI reasoning algorithms. They have been used
to provide descriptions of news articles, academic literature and business data (Jokela,
Turpeinen & Sulonen 2000; Motta, Buckingham Shum & Domingue 2002). In the
business domain, TOVE provides a highly formal ontology for automated reasoning
is to enable the communication among people and computers in an organisation and
assist in the “acquisition, representation and manipulation of enterprise knowledge”
(Uschold et al. 1998, p. 3). Although such ontologies could be used to supply paragraph
level metadata for business documents, they are pitched at too general a level for
practical use; the enterprise ontology does not include terms for the many vital, yet
idiosyncratic, organisation-specific elements.
At this point it is useful to distinguish between ontologies and taxonomies such as those
developed in this thesis. A taxonomy is a strictly hierarchical classification of domain
concepts exemplified by the Library of Congress Subject Headings (LCSH 2002).
Ontologies range from the very formal, which include axioms and theorems about the
relationships between concepts, to the informal, which are essentially taxonomies with
the possible addition of non-hierarchical relationships.
2.3
Producing metadata
2.3.1 Managing semantic heterogeneity
Words and phrases mean different things, to different people, in different contexts
(Furnas et al. 1987); this is the problem of semantic heterogeneity. In a corporate
context the problem is exemplified by the differences in perspective, knowledge and
language that tend to arise between different portions of organisations (Bryce 1997).
How can metadata based descriptions of content deal with this problem?
One way of dealing with it is to have many different types of content description which
together allow the reader to converge on a correct understanding. Both MARC and EAD
do this. For example MARC has fields for summary (which allows abstracts), title, and
subject headings. This solution helps the user to converge on the correct interpretation
Chapter 2 section 2 41
Another solution is the creation of what are called controlled vocabularies or
classifications. Examples of this are the Medical Subject Headings (MESH 2002), and
the Library of Congress Subject Headings (LCSH 2002). These systems provide a
commonly agreed organisation of terms, so that large collections can be organised
according to their content. This kind of solution has the problem of needing centralised
control. Although this has been attempted (e.g. by the US government, Schuldt 1994), it
would seem difficult to achieve in a corporate environment where knowledge is widely
dispersed, not rigorously documented and things change rapidly. A potentially effective
solution is to maintain a centralised glossary in a distributed fashion using hyperlinks
from terms in documents. An example of this is the ‘Virtual Hyperglossary’ (West &
Murray-Rust 1998).
An alternative approach is to encourage heterogeneity in the terms used as metadata
while allowing selective and personalised views of the metadata. Hue et al. took this
approach; data objects can be grouped into sets using unrestricted criteria based on
metadata (Hue, Levoir & Nonon-Latapie 1997). Users of this proposed system are
allowed to create their own hierarchies to describe the data from their perspective.
Dourish et al have put forward a proposal which marries this approach with the use of
controlled vocabularies. They allow standardised company taxonomies to be customised
and adapted in such a way that mappings can be made between adaptations and back to
the standard (Dourish, Lamping & Rodden 1999).
Hence, although semantic heterogeneity is a problematic aspect of the production and
2.3.2 Structured documents
The concept of a structured document can be likened to a form. The form explicitly
dictates what goes where using mark-up languages, which use tags to attach metadata to
data:
e.g. < wife’s_name >Jane Bloggs</wife’s_name>
This allows structure, in terms of what goes where or with what, to be predefined. It
also allows metadata to be added to component parts of a document. Thus any
document enriched with paragraph-level metadata will be a structured document.
2.3.2.1 Mark-up languages fo r structured documents and metadata
The mark-up languages used to create structured documents are generally described
using either SGML (Standard Generalised Mark-up Language) (SGMLiISO 8879) or its
younger net enabled sibling XML (Extensible Mark-up Language) (W3C 1998). These
international standards allow mark-up languages to be flexibly defined in a device
independent manner that allows easy interchange of information. SGML requires what
is called a DTD (Document Type Definition) to allow the tags to be defined along with
the constraints on the kind of data they should contain, and their possible inter
relationships. In place of DTDs XML uses, but does not require, XML schemas.
SGML and XML have been used to create mark-up languages for textual documents.
The Text Encoding Initiative (TEI) uses SGML for the detailed encoding of literary and
linguistic textual materials in electronic form (TEI 2002). Encoding documents using
the TEI DTD makes an extensive amount of information about the composition, style,
and structure of a document available to computer analysis. Although TEI can be used
to create paragraph level metadata, it is overly complex for this purpose, since it was
Chapter 2 section 2 43
On the web XML has been used to define a number of mark up languages for encoding
metadata. RDF (Resource Description Framework) is an XML standard for encoding
metadata which can be used by AI reasoning algorithms (W3C 1999). Topic-maps are
an ISO standard which allow metadata to be encoded so the metadata from different
repositories can be easily combined (Pepper 1998). Although both of these standards
ostensibly allow documents to be encoded with metadata, they are made complex by
their aspirations to enable AI reasoning, and allow easy merging of repositories,
respectively. This complexity makes them unnecessarily cumbersome and difficult to
apply for simple cases such as the encoding of paragraph-level metadata.
Two standards have been developed specifically for metadata about web page content.
PICS (Platform for Internet Content Selection), allows web pages to be labelled with
information that would indicate content unsuitable for children (PICS 1996). Coming
from the library cataloguing tradition the Dublin Core (Weibel, Grodby & M iller 1995)
defines a list of 15 tags/fields for the description of resources. Two of these, ‘subject’
which contains keywords, and ‘description; which contains a free text description,
describe the resource’s contents. Unfortunately, PICS and Dublin Core are geared
towards document-level metadata, whereas here the metadata needs to be encoded at the
paragraph-level.
This brief review suggests that the existing standards for document and metadata
encoding are not ideal for the production of paragraph-level metadata undertaken in the
research behind this thesis. However the basic mark-up languages, particularly XML,
will be extremely useful in preparing documents encoded with paragraph-level