Journal of Fluid Mechanics
http://journals.cambridge.org/FLMAdditional services for Journal of Fluid Mechanics:
Email alerts: Click here Subscriptions: Click here Commercial reprints: Click here Terms of use : Click here
The interaction of waves and a turbulent current: waves
propagating against the current
P. H. Kemp and R. R. Simons
Journal of Fluid Mechanics / Volume 130 / May 1983, pp 73 89 DOI: 10.1017/S0022112083000981, Published online: 20 April 2006
Link to this article: http://journals.cambridge.org/abstract_S0022112083000981 How to cite this article:
P. H. Kemp and R. R. Simons (1983). The interaction of waves and a turbulent current: waves propagating against the current. Journal of Fluid Mechanics, 130, pp 7389 doi:10.1017/ S0022112083000981
Request Permissions : Click here
d . F h i d Mech. (1983), vol. 130, p p . 73-89 Printed in &eat Britain
73
The interaction
of
waves and a turbulent current: waves
propagating against the current
By P.
H.KEMP
AND R.R. SIMONS
Department of Civil and Municipal Engineering, University College London,
Gower Street, London WClE 6BT
(Received 1 September 1982)
The results of a n experimental study of the interaction between waves and a current propagating in the same direction, have been reported by Kemp & Simons (1982).
This paper describes the second part of the study, and considers the case of waves propagating against the current. Tests were performed in a laboratory flume with smooth and rough beds, and velocity measurements were made with a directionally sensitive laser anemometer as described in the previous paper. Analysis, including ensemble averaging of velocities and surface elevation, was performed by an on-line computer.
Results indicate that the rate of wave attenuation is greatly increased by the addition of an opposing current, and reduced by a following current. Wave profiles remain closely described by Stokes second-order theory ; orbital velocities are also found to be in agreement with a second-order wave theory modified to take account of the presence of the current.
Certain results described occur regardless of the relative directions of current and wave. Mean velocities in the upper flow increase in the direction of the wave generator for increasing wave height. This suggests that the current is enhancing the wave- induced mass transport. Near the bed the velocity profiles so change that above the rough bed the current is retarded by the wave motion. I n the logarithmic layer over the smooth bed velocities are increased with increasing wave height. However, all changes to velocity profiles have to be carefully interpreted, as the sidewall boundary layer decreases in thickness with even the smallest wave superimposed on the current.
Turbulence intensities and Reynolds stresses near the rough bed are increased by the presence of the waves, most strongly in a layer two roughness heights above bed level, where fluctuations are periodic and effected by vortices ejected from the roughness troughs. Above this level, and over the smooth bed, turbulence levels are similar t o those for the currents alone.
1.
Introduction
A knowledge of the interaction of waves and currents is proving to be of increasing interest, with large offshore structures being sited in inhospitable marine conditions. Near the surface, loading on -structures and vessels is frequently due to combined waves and currents, while at the seabed the strongest mechanism for sediment movement involves pickup by wave action and transport by currents. Also, the prediction of wave heights after propagation through a region with current flowing can be important for design of shore protection.
74 P . H . Kemp and
R. R.
Simonscurrent flow which have looked a t particular aspects of the problem (Sarpkaya 1955;
van Hoften & Karaki 1976; George & Sleath 1979; Brevik & Aas 1980), there is still a lack of detailed data and understanding of the interaction process either in the upper layer or near the bed. The present study, which included tests on waves propagating with and against the current, and over smooth and rough beds, aimed to provide experimental data to assist in the verification of theoretical models, paying particular attention to the near-bed region. Careful consideration was also given to the experimental difficulties inherent in such laboratory flows.
The first part of the results, dealing with waves on a following current, has already been published (Kemp & Simons 1982). A considerable increase in bed shear stress and roughness scale was observed a t the rough boundary, as had been predicted by Grant & Madsen (1979) and Christoffersen (1980) using eddy-viscosity models of the boundary layer. The near-bed layer experienced lower mean velocity but greater turbulence intensities than for the current alone. These changes are relevant to sediment movement a t the bed, where Bijker, Hijum & Vellinga (1976) have reported increased upstream transport with the introduction of a current to wave motion.
One of the main objectives of the work described both in the previous and the present papers was to observe the interaction between a laminar wave-induced oscillatory boundary layer and a turbulent current, in order to determine whether the turbulence was affected by the potential flow. The experiments were then extended to the more practical situation where the bed roughness induced turbulence in both cases.
This paper reports on the combined flow when waves propagate against the current, and compares the results with those obtained with waves on the following current.
Throughout this paper, for a quantity M ,
i@
is the ensemble average of M withM
subtracted(z
is the mean value over the full sample period) :0
@
is the turbulence r.m.s. of M about periodici@
2. Apparatus and instrumentation
The present tests, carried out on waves propagating against a current, were performed in the same channel as described by Kemp & Simons (1982), but with modifications to the beach end. The channel was 0.457 m wide and had a test section
10.06 m long.
Initial trials revealed that air bubbles were being entrained in the water when i t entered the channel under the beach, and these led to inaccurate anemometer readings. Also, considerable turbulence was created by the flow through and round the beach, so altering the boundary-layer characteristics along the flume.
The air-entrainment problem was overcome by replacing the direct inlet pipe from the header tanks with a low-level constant-head system in the laboratory. The end of the channel was extended by adding a tank containing barriers of ballotini, hairlock and honeycomb sheeting, wire mesh, and wooden fairings to suppress inlet turbulence.
Interaction of wave8 and a turbulent current Inflow from
header tank
75
Inflow from
W
P
FIGURE 1. Channel layout and recirculating system.
through weak spots experienced by Thomas (1981). This requirement eliminated any dense beach structure spanning the full flow depth. The solution adopted was to position a thin sheet of perforated metal slightly below wave trough level, supported by four thin rods from above. It was partly horizontal and partly sloping at 2.5'
towards the wave-paddle end. When waves propagated onto this structure it tended to flex. However, trials with additional supports showed that the movement increased the absorption of wave energy rather than reflecting it.
A further change required to control the opposing current was the addition of an overflow weir at the outlet behind the paddle. For flexibility of the system this was constructed a t the top of an upstand pipe. The revised channel layout is shown in figure 1.
Velocities were measured using a laser-Doppler anemometer with phase shifting incorporated to give directional sensitivity. Wave-surface elevation was monitored by resistance probes. An on-line minicomputer was used for storage and analysis of data.
For the smooth-boundary tests the channel bed consisted of dural sheets onto which four coats of marine-quality paint had been applied. Under these conditions the current alone was well into the turbulent regime, whereas the waves alone were laminar.
The two-dimensional bed roughness used was constructed of 5 mm high triangular wooden strips placed a t 18 mm intervals along the channel bed. One of the objectives in selecting this bed form was that the smaller waves alone should be near the laminar regime (albeit with incipient vortex motion), while the higher waves should be turbulent. By Jonsson's (1966) criteria, the larger waves were transitional for the size of bed roughness selected, but it was felt that separation round the sharp-crested elements would induce earlier transition to turbulence than he predicted.
Spectrum analysis was carried out on the waves. I n this way i t was possible to eliminate any suggestion that any of the effects observed might have been due to the presence of parasitic waves resulting from imperfect wave generation.
3. Experimental programme and preliminary tests
76 P. H . Kemp and R. R. I 9' zmons
height propagating alone over a smooth bed, and WR1-5 were for the same paddle motion but with the waves propagating over a two-dimensional bed roughness. Tests
CA and CR were for a current of mean centreline velocity of 185 mm/s, over smooth and rough beds respectively. Tests WCA1-5 and WCR1-5 were for the waves superimposed on the following currents CA and CR with appropriate bed conditions. In all cases still-water depth d was 200 mm a t the test section, and the wave period
T
was 1 s.For the results described herein, tests DA and DR were for a current alone of mean centreline velocity 110 mm/s over smooth and rough beds respectively, while tests
WDA1-5 and WDR1-5 were for the waves WA1-5 and WR1-5 propagating on the
opposing currents DA and DR. The choice of a weaker opposing current was to a certain extent imposed by the physics of the channel inlet. However, it offered the opportunity to investigate the wave-dominated range of interaction more closely than had been possible with the following current. Flow parameters are set out in table 1.
Normalized mean-velocity profiles for the four currents measured alone are shown in figure 2. These show very good agreement for both rough and smooth bed cases, except within the near-bed region above the rough boundary. Here scaling might be expected to be on a roughness lengthscale rather than on boundary-layer thickness. When determining the height origin e for the logarithmic curve fit to the turbulent boundary layer, the stronger following current gave a value of 1.7 mm below roughness apex level. However, for the slower opposing current the value arrived a t was 3 mm below apex level.
In the previous work, in tests WCAl-5 and WCRl-5, a significant reduction in sidewall boundary-layer thickness was found. Preliminary tests were thus made for the opposing current case also, to check if similar changes occurred. Figure 3 confirms that, indeed, the sidewall boundary-layer thickness is dramatically reduced by the addition of even the smallest wave under test, from a value of 40 mm for current alone to approximately 10 mm when waves were superimposed. Qualitative tests with dye also suggested that very close to the sidewall the mean motion was against the current, and in the direction of viscous wave-induced mass transport. These results indicate a redistribution of flow across the channel when waves are superimposed on
a current, at laboratory scale. This has to be borne in mind when interpreting the mean velocities.
4.
Results
4.1. Wave-surface projiles
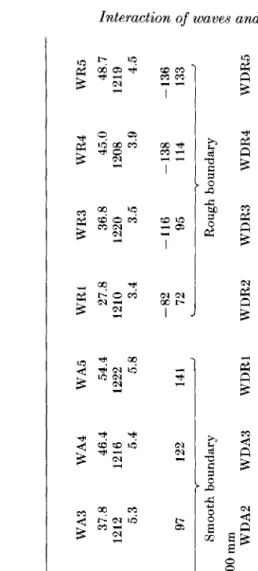
fi) Waves alone. T = 1.006 s. d = 200 mm WA1 WA3 WA4 Wave height H (mm) 29.0 37.8 46.4 Wavelength L (mm) 1210 1212 1216
dH dx
Reflection coefficient a, (%) 6.0 5.3 5.4 -X 105 Maximum wave bed velocity 9, (mm/s) 75 97 122 measured above wave boundary layer , Y Smooth boundary WDAl WDA2 WDA3 H (mm) 32.4 40.0 45.6 L (mm) 1043 1063 1080 (ii) Waves with an opposing current; T = 1.003 s, d = 200 mm a, (Oh) 3.7 2.1 1.2
dH -X
105 - dx -60 -61 - 70 ub (mm/s) 76 93 108 Mean centreline velocity for current \ A alone uB (mm/s) 112.6 Smooth boundary
WA5 54.4 1222
5.8
141
WDRl 27.9
2.5
1053 - 135 72
WR1 WR3 WR4 WR5 27.8 36.8 45.0 48.7
2
1210 1220 1208 1219 6 3.4 3.5 3.9 4.58
ci$.
72 95 114 133
<
- 82 -116 - 138 - 136 < > Rough boundary8
0,WDR2 WDR3 WDR4 WDR5
’
33.4 39.7 50.5 59.1 Q 1055 1055 1055 1055&
B
3.0 2.3 2.6 2.0
&
- 150 - 170 - 225 - 3402
c: m” c) r?
78
0.92
0.8-
0.7-
0.6-
P. H . Kemp an,d
R.
R.
SimonsY
s
-
0.5-
0.4
-
0.3
-
0.2-
0.1-
0
X
x.
X
x * X
X *
+
X * 6
x * *(
x * x * * * x
x * * * X *
x x***
X $ * * * * * * * %
I I
5 10 1 5 20 25
Rough x
bed
U
X
Smooth
bed
X
.
X
X
X
Ulu,
FiCunE 2. Normalized mean-velocity profiles, ti/u, versus y/6;
x , following currents ;
+,
opposing current.0 (mrn/s)
FIGIJRE 3. Sidewall boundary layer, x , current alone DA; 0, Wave
Interaction of waves and a turbulent current 79
Wave surface
elevation (mm)
r
FIGURE 4. Wave-surface profile with opposing current flowing -, WDR3; -. - , Stokes
second-order theory ; - -, linear theory ; . . . ., Rrink-Kjaer & Jonsson theory.
The attenuation rate of the waves along the channel was found to increase greatly when an opposing current was introduced. This contrasted with the results for the following current, when the attenuation rate was reduced (figure 5 ) . The change applied both to the viscous-dominated smooth-bed case, and to the turbulent rough-boundary tests. If the results are reinterpreted as height loss per wavelength,
so taking into account the change in wa\clength with the addition of a current, there still remains the trend to incareased attenuation with the opposing current (40
Yo),
and reduced attenuation with the following current (15yo).
,Measured wavelengths over the smooth boundary showed an increase of 4
yo
between the smallest and highest waves tested. The predicted value from Thomas (1981), assuming a uniform current equal to the dcpth-averaged mean velocity, lay near the centre of this range, as did that from the linear shear-current theory of Brink-Kjaer & Jonsson (1975). The constant vorticity used in applying the latter theory was that which gave the correct surface velocity and overall depth-averaged velocity. Wavelengths over the rough boundary remained almost constant for the full range of wave heights tested, at a value within 1yo
of thc theoretical predictions assuming uniform flow, and that of a linear shear current.4.2. Wave-induced velocities
For each test run, velocities was measured a t the channel centrcline at u p to 30
positions in the vertical. The purely wave-induced, periodic velocities were computed by ensemble-averaging 200 wave cycles of data and subtracting the mean-velocity component.
80
0 110 210 310 4.0 510 6.0 7.0 8.0
P.
H . Kemp andR.
R.
Simons H (mm)vv
"VVV 0"
v v
Opposing current: WDR4
55
No current: WR5
. .
Following current: 0
WCR5 U a
Distance from channel inlet (m)
FIQURE 5. Wave-height attenuation along channel: V, wave on opposing current WDR4,
H = 50.5 mm;
V,
wave alone WR5, H = 48.7 m m ; 0. wave on following current WCR5,H = 46.6 mm.
similar result was found for waves on a following current, although there was a trend towards the 'overshoot ' velocity being reduced for smaller waves in the latter case. The periodic velocities outside the rough-bed boundary layer, of about two roughness heights, and up to the surface were in good agreement (within 2
yo)
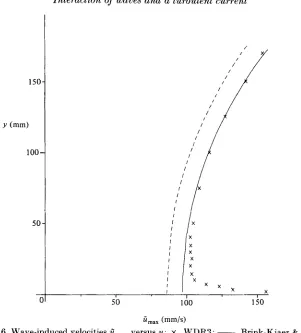
with the theory of Brink-Kjaer & Jonsson (1975) for second-order waves on a linear shear current (figure 6). However, over the smooth bed the results are about 5yo
less than predicted. The difference may be attributed to the mean-velocity profile over the rough bed being of a more uniform slope than that over the smooth bed, and so closer to the profile assumed in the theory. Velocities predicted by neglecting the current and simply applying second-order wave theory to the measured wavelength and height would underestimate results by 15Yo.
Interaction of waves and a turbulent current 81
150
Y (mm)
100
50
-
I
i,,, (mm/s)
FIGURE 6. Wave-induced velocities Cm,, versus y: x , WDR3; -, Brink-Kjaer & Jonsson theory; - - - -, Stokes second-order theory.
4.3. M e a n velocities
4.3.1. Overall characteristics. Mean velocities were measured at up to 30 positions
in the vertical at the channel centreline, by averaging the anemometer signal over
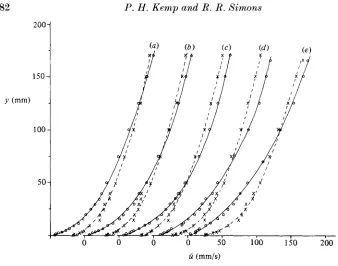
200 wave cycles. The profiles computed from these results indicate that over both smooth and rough boundaries the effect of superimposing waves of increasing height onto a current propagating against the waves is to increase the mean velocity in the upper flow. This is the opposite effect to that found for waves on the following current.
A comparison was made between the measured profiles and those predicted assuming a linear superposition of the separately measured unidirectional current and waves of the same height and length. This shows that a linear law of superposition does not apply, and suggests that the wave-induced return current towards the paddle in the upper layers is enhanced by the current (see figure 7). If displacement and momentum thicknesses are calculated from these data, both are found to increase with wave height. Boundary-layer parameters are set out in table 2.
82
Y.
H . Kemp andR.
R.
Simons2o01
ii (mm/s)
FIGURE 7. Mean-velocity profiles over rough bed: 0-0, experimental results; x--- x ,
theoretical addition of wave alone and current alone. (a) WDR1, H = 27.9 mm; (b) WDR2,
33.4 mm; (e) WDR3, 39.7 mm; (d) WDR4, 50.5 mm (e) WDR5, 59.1 mm.
Smooth-boundary tests DA WDAl WDA2 WDA3
Shear veiocity es (mm/s) 5.31 4.37 4.83 4.77
c*,,, (mm/s)
Shear stress T~ ( x 28.3 30.0 25.7
- 12.0 13.3 15.6
5.38 5.32 5.48 5.07
4.27 2.77 2.96 3.94
]
viscous layerti* (mm/s)
*B
Displacement thickness
35.6 47.4 45.5 36.4
Momentum thickness
25.5 31.2 30.2 58.2
Outer flow velocity Goo (mm/s) 137.0 139.9 145.5 169.9
0
[
=lom
2
(1)
-;
dy] (mm)K = von Kirman’s constant = 0.387; *B calculated from fi/tL* = ( 1 / ~ ) In (ytL*/v)+ B
Rough-boundary tests DR WDRl WDR2 WDR3 WDR4 WDR5
c*
(mm/s) 8.25 10.52 12.23 13.2 13.3 14.3Tb ( x 10-3 p a ) 68 111 150 173 i 77 204
Roughness length yo (mm) 0.82 3.44 4.09 3.89 4.36 6.09
Nikurdse roughness k, (mm) 24.7 103.2 122.7 116.7 130.8 182.7
d , (mm) 45.0 67.1 60.6 57.0 58.1 56.9
0 (mm) 28.1 33.6 31.0 29.9 29.2 25.8
Urn (mm/s) 142.5 161.6 162.1 167.1 143.6 166.3
von KArman’s constant = 0.378
Interaction of waves and a turbulent current 83
attributable to the influence of the changing side-wall boundary-layer thickness, as described in $ 3 .
Near the rough boundary, the results showed the same behaviour as for the waves on the following current. The superposition of waves of increasing height led to a progressive decrease in mean velocity above the roughness apex level, with the reduction extending up through the logarithmic layer. I n the roughness troughs, the mean flow against the current increased with wave height.
4.3.2. ~ o g a r i t ~ ~ ~ c layer. It has previously been shown (Kemp & Simons 1982) that
when waves propagate on a following current the logarithmic layer still exists. The present tests confirm that the same applies with the reverse current, and that the changes induced in the region by the presence of the waves are independent of current direction relative to the wave. Over the smooth bed the logarithmic curve slope (and hence a measure of mean bed shear stress) remains constant to within 10
yo,
for the three waves tested, and also throughout the wave cycle when periodic velocities are included.Over the rough bed, however, the mean bed shear stress 'ib and roughness scale
yo deduced from the slope and intercept of the logarithmic curve both showed an overall trend to increase with increasing wave height. For the largest waves tested, shear stress increased by a factor of three, and roughness scale by a factor of six times the values for current alone. The nature of the logarithmic profiles for each of the particular waves considered remained unaltered through the wave cycle, however, as was illustrated for waves on the following current.
The distribution of eddy viscosity with depth was computed from the mean bed shear stress and mean-velocity profile, using the relationship
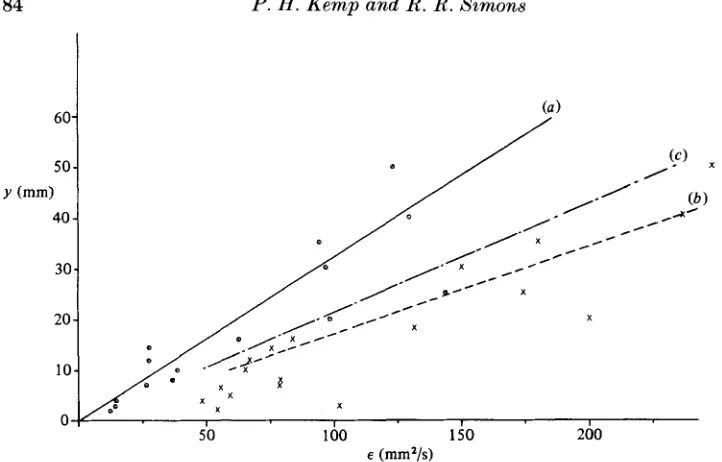
as assumed in Christoffersen (1980). The results in the turbulent boundary layer indicate a linear distribution in all cases, with the slope deldy increasing with wave height. Near the rough bed a linear distribution of different slope was found, for both the current alone and for current with the smaller waves; but, as the wave height increased, so the results became more scattered, with no curve clearly defining the data (see figure 8).
4.3.3. Ensemble-averageprojiles. With the aid ofthe computer it was straightforward
to reconstruct velocity profiles, for any phase (within 2') of the wave cycle, from the mean velocities and ensemble-averaged periodic velocities a t 30 measuring positions
in the vertical. An example of such a set of curves is shown in figure 9, for run WDA3
over the smooth bed. Flow reversal was experienced at both the surface and the bed, as demonstrated in ( a ) , while ( b ) concentrates on the layer within 3 mm of the bed. The phase advance experienced a t the smooth bed in oscillary flow is clearly visible in this figure, being of the order of 35O, compared with the theoretical value of 4 5 O
under laminar wave motion.
4.4. Turbulence intensities
4.4.1. Periodic variations. The relatively low levels of turbulence found in the
84 P. H . Kemp and R. R. Simons
E (mm2/s)
FIGURE 8. Eddy-viscosity distribution over rough bed: 0-0,. current alone DR; x --- x ,
current with opposing wave WDR3; __ - ~ , Grant & Madsen theory for WDRB;
E = ?,/(pd%/dy).
There was, however, a notable periodicity in the turbulence intensities through the wave cycle in the logarithmic layer, where wave-induced vertical velocities were able to convect turbulence in a region where intensities varied with height above the bed. Within 2 mm of the smooth bed there were peaks in 6' at phases of maximum acceleration and deceleration (or zero absolute velocity), the larger values corre- sponding to deceleration.
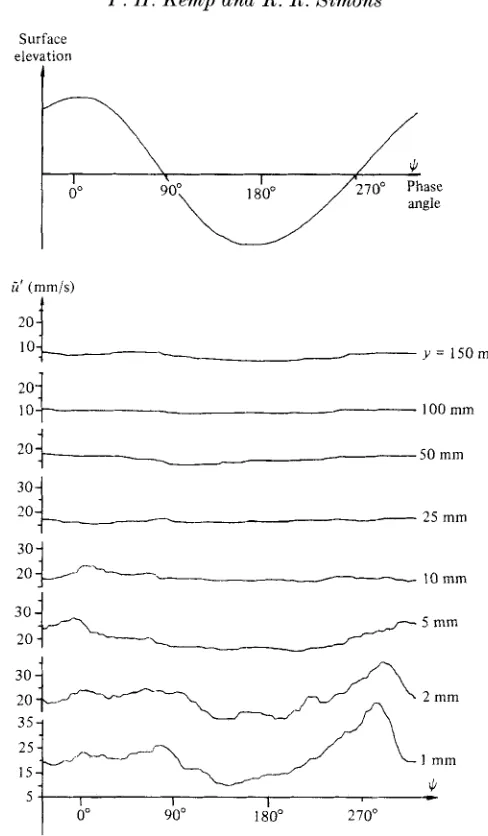
Near the rough boundary, considerable disturbance was introduced into the flow by the vortices formed in the roughness troughs. Turbulence intensities thus fluctuated through the wave cycle, and were dependent on the outer flow velocities generating the vortices. Figure 10 shows the way in which the horizontal turbulence varied through the cycle a t positions through the depth of flow. From this figure it can be seen that within 5 mm of the bed there are two peaks of activity corresponding to phases of acceleration and deceleration, the greater being for the latter. As the current was flowing against the direction of wave propagation, this occurred as the wave crest was approaching and the water level was rising. In the experiments previously reported in which a stronger current flowed in the same direction as the wave, there was only one peak near the bed, and that too corresponded to the decelerating phase, in that case after the wave crest had passed.
In the present tests, the greater turbulence activity occurred at phases where the ensemble-average periodic velocity .ii had secondary peaks superimposed, and both
v"
andv"'
showed significant maxima, suggesting the periodic streaming of fluid from the vortices between the roughness elements.Above this layer two roughness heights above the bed, the turbulence activity became periodic at the wave frequency, with the maximum value occurring during the passage of the wave crest. As for the smooth-bed tests, this could be attributed to the movement of high-turbulence fluid from near the bed by wave-induced upward motion.
Interaction of waves and a turbulent current
$ = 90” j, =O”
(a)
4bO 300 200 100 -100
ii + 6 (mm/s)
rL = 0”
j, = 90”
mm
FIGURE 9. u+c
I
2d0 100 0 -100
ti + ic (mm/s)
versus y a t 18’ intervals; smooth bed WDA3: ( a ) full depth;
85
near bed
peaks and troughs, up to a level two roughness heights above apex level, a t which level values over spex and trough wEe identical.
The variations in Reynolds stress u’u’ through the wave cycle confirmed the results of the horizontal turbulese. At the phase prior to the passage of the wave crest there was a sharp drop in u’v’ to a negative value ten times the mean value for current alone. At the phase corresponding to maximum acceleration there was a relatively mild peak, though with a positive value five times that for current alone.
86
Surface elevation
Y.
H . Kemp andR. R.
Ximons20
100 mm
1 0 ,
2ol
50 min25 mm
;:I
~-
/
-
1 0 m m30
1
A
5 - I I c
0" 90" 180" 270"
FIGURE 10. C' versus phase angle @ over rough-bed apex : run WDR3.
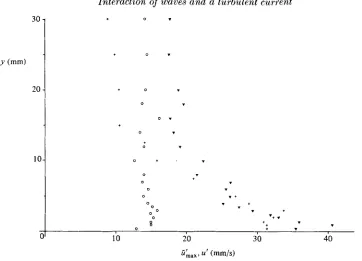
wave with opposing current, and wave alone, and demonstrates that, although the near-bed activity is of the same order of magnitude in the latter two cases, the effective turbulent boundary layer is far thicker with the combined flow, and of two to three times the intensity of the current alone. The same applies to the mean turbulence values over the wave cycle, where the activity near the bed is far greater ( > 50
yo
for WDR3) than that for the current alone. The vertical turbulence results follow
the same trends.
Y (mm) 20 -
10-
Interaction of waves and a turbulent current
0 .
0 0
o r
0
8 f .
87
0
0 .+
.
8
.
0 10 20 30
.
40i(&, u' (mmis)
FIGURE 11. u', Bkax versus y within 30 mm of bed: 0, current alone DR; +, wave alone WR4;
v,
wave on opposing current WDRS. Measurements made over a bed-roughness element.5.
Discussion
When waves are superimposed on a current the previous results (Kemp & Simons
1982) and the present study indicate that near the boundary the mean flow is
insensitive t o whether the waves propagate with or against the current. This is because the waves under consideration resemble plane oscillat'ory motion in this layer. However, velocities for the current alone near the smooth bed were observed to be greater than for the curfent with opposing waves. This could be due to the wave-induced masf transport towards the beach slowing the flow a t the bed. Alternatively, it may be a further symptom of the problems induced by changes in sidewall boundary-layer thickness when waves are superimposed on a current. Small oscillatory motions a t the walls appear sufficient to prevent formation of the usual boundary layer there, and so cause flow redistribution across the channel. This effect could be reduced by use of a wider flume, but that in turn might lead to unstable secondary flow cells across the flow.
88 P. H . Kemp and R. R. Simons
place every cycle, causing the generation and ejection of an upstream vortex in addition to the usual downstream vortex. This behaviour was similar to that for waves alone. With the stronger following current, the upstream vortex was far weaker, if formed a t all, leading to the formation and weaker ejection of only one vortex each wave cycle.
The presence of wave-induced vortices in the layer above the rough bed causes a drop in mean velocity and a large increase in apparent bed roughness and shear stress as determined from the mean-velocity profiles. This is as found for waves propagating with the current, and as predicted by the theories of both Grant & Madsen (1979)
and Christoffersen (1980). The measured values appear to be in better agreement with the latter.
I n the upper flow, the relative directions of the wave and current become significant. When they are in the same direction, the mean flow is retarded, whereas if they oppose one another it is increased. This is consistent with the direction of wave-induced mass transport as measured for waves alone, and suggests that the current is enhancing the motion towards the paddle. Another interpretation could be to relate this change to the rate of wave attenuation along the channel. When waves oppose the current, attenuation increases and results in a loss of wave energy. However, the mean velocity in the upper layer is increased, causing an increase in current energy. When the waves propagate in the direction of the current there is less wave attenuation, less loss of wave energy, and a corresponding decrease in current velocity near the surface.
Mean-velocity profiles and turbulence intensities from the tests with waves on a following current indicated a reduction in boundary-layer thickness at the bed from the value for current alone. However, the present tests show no such clear trend for either an increase or decrease, although the mean velocity would suggest an increase in thickness. This would appear to be due to secondary, wave mass-transport effects near the surface rather than to changes in the turbulence characteristics of the boundary layer. The Eulerian velocity-measuring technique was taken into account when interpreting the mean velocities. If this was not done, it would tend to further exaggerate the change in outer flow velocities.
The logarithmic description of the mean-velocity profile was found to be valid for waves in both directions, and throughout the wave cycle. This applies to the wave period under consideration, but for longer, shallow water waves the wave boundary layer is likely to extend up into the current-induced logarithmic layer and produce a periodicity into the bed shear velocity deduced from the logarithmic slope. The possible effects of wave-current interactions on sediment transport were suggested by the authors in Kemp & Simons (1982), based on the results from tests on waves with a following current. The present results concur with the gist of this section, although the relatively stronger waves on the opposing current produce a wave-induced boundary layer only approximately two roughness heights thick.
6. Conclusions
The following conclusions relate to the present study of waves propagating against
a current, and comment on the previous case of waves propagating with a current.
Interaction of waves and a turbulent current 89
(2) Near the rough bed, mean velocities are decreased by the presence of waves in both cases.
(3) For waves on an opposing current, surface profiles remain close to Stokes second-order theory if scaled on wavelength and height.
(4) For the particular wave period used in these tests, wave attenuation is reduced by a following current, but increased by an opposing current. It is not yet clear whether this applies more generally.
(5) Wave-induced periodic velocities are described within 5
%
by a second-order theory taking the shear current into account in both cases.(6) Turbulence intensities averaged over the wave cycle are increased by the superposition of waves on a current in either direction within a layer two roughness heights above the rough bed.
(7) Turbulence intensities and Reynolds stresses vary through the wave cycle near the rough bed, with peak values far in excess of those experienced by currents alone, but of the same order as for waves alone. The periodic variation is dependent on the relative magnitudes of current- and wave-induced velocity near the bed rather than on their directions.
(8) The sidewall boundary layer in the channel is considerably reduced in thickness in both cases when even the smallest waves are imposed on the current.
(9) A nearly horizontal, perforated metal sheet placed just below wave trough level
acts as an efficient wave absorber, while not adversely influencing the opposing current profile.
R E F E R E N C E S
BIJKER, E. W., HIJUM, E. V. & VELLINOA, P. 1976 Sand transport by waves. I n Proc. 15th Coastal
Engng. Conf., Hawaii, vol. 2, chap. 68, pp. 1149-1167.
BREVIK, I. & AAS, B. 1980 Flume experiments on waves and currents, I, rippled bed. Coastal Engng
3, 149-177.
BRINK-KJAER, 0. & JONSSON, I. G. 1975 Radiation stress and energy flux in whter waves on a
shear current. Inst. Hydrodyn. Hydraul. Engng, Tech. Univ. Denmark, Prog. Rep. no. 36, pp.
CHRISTOFFERSEN, J . B. 1980 A simple turbulence model for a three-dimensional current wave
motion on a rough bed. Inst. Hydrodyn. Hydraul. Engng Tech. Univ. Denmark, Int. Rep. no.
1.
GEORGE, C. B. & SLEATH, J. F. A. 1979 Measurements of combined oscillatory and steady flow
over a rough bed. J . Hydraul. Res. 17, 303-313.
GRANT, W. D. & MADSEN, 0. S. 1979 Combined wave and current interaction with a rough bottom.
J . Geophys. Res. 84, 1797-1808.
JONSSON, I. G. 1966 Wave boundary layers and friction factors. In Proc. 10th Conf. Coastal Engng,
KEMP, P. H . & SIMONS, R. R. 1982 The interaction between waves and a turbulent current: waves
LAMB, H. 1932 Hydrodynamics, sixth edn. Cambridge University Press.
SARPKAYA, T. 1955 Oscillatory gravity waves in flowing water. Trans. A.S.C.E. 122, 564. HOFTEN, J. D. A. VAN & KARAKI, S. 1976 The interaction of gravity waves and turbulent channel
27-32.
Tokyo, VOI. 1 , pp. 127-148.
propagating with the current. J . Fluid Mech. 116, 227-250.