High energy photon reference for radiation protection:
tech-nical design of the LINAC beam and ionization chambers; and
calculation of monoenergetic conversion coefficients
D. Dusciac a, J.-M. Bordy, J. Daures, V. Blideanu
CEA, LIST, Laboratoire National Henri Becquerel (LNE-LNHB), Bât. 602 PC111, CEA-Saclay 91191 Gif-sur-Yvette Cedex, France
Abstract. In this work, we present the results of the first part of a research project aimed at offering a complete response to dosimeters providers and nuclear physicists’ demands for high-energy (6 – 9 MeV) photon beams for radiation protection purposes. Classical facilities allowing the production of high-energy photonic radiation (proton accelerators, nuclear re-actors) are very rare and need large investment for development and use. A novel solution is proposed, consisting in the use of a medical linear accelerator, allowing a significant de-crease of all costs.Using Monte Carlo simulations (MCNP5 and PENELOPE codes), a specifi-cally designed electron-photon conversion target allowing for obtaining a high energy pho-ton beam (with an average energy weighted by fluence of about 6 MeV) has been built for radiation protection purposes. Due to the specific design of the target, this “realistic” radia-tion protecradia-tion high-energy photon beam presents a uniform distriburadia-tion of air kerma rate at a distance of 1 m, over a 30 × 30 cm² surface. Two graphite cavity ionizing chambers for ionometric measurements have been built. For one of these chambers, the charge collection volume has been measured allowing for its use as a primary standard. The second ionizing chamber is used as a transfer standard; as such it has been calibrated in a 60Co beam, and in the high energy photon beam for radiation protection.The measurements with these ion-izing chambers allowed for an evaluation of the air kerma rate in the LINAC based high-energy photon beam for radiation protection: the values cover a range between 36 mGy/h and 210 mGy/h, compatible with radiation protection purposes.Finally, using Monte Carlo simulations, conversion coefficients from air kerma to dose equivalent quantities have been calculated in the range between 10 keV and 22.4 MeV, for the spectral distribution of the fluence corresponding to the beam produced by the linear accelerator of the LNE-LNHB.
Cette étude propose une solution pour répondre à la demande des fabricants de dosimètres et des exploitants du nucléaire de disposer de champs de rayonnements photoniques de haute énergie (6 à 9 MeV) afin de caractériser (test de type) des dosimètres en vue de leur mise sur le marché et de les étalonner. Les installations de production de champs de rayon-nements photoniques de haute énergie sont « lourdes » et très rares (accélérateur de pro-tons, réacteurs nucléaires type piles piscines, …). L’utilisation d’un accélérateur médical permet de mutualiser l’utilisation entre radioprotection et radiothérapie en diminuant les coûts d’exploitation. Dans un premier temps, nous avons défini (par simulations Monte Car-lo) puis réalisé un ensemble cible de conversion-atténuateur-égalisateur, qui permet d’obtenir un faisceau homogène de photons de haute énergie (énergie moyenne pondérée par la fluence égale à 6,17 MeV) pour la radioprotection à partir d’un faisceau d’électrons
DOI: 10.1051/ 00004 (2016)
,
124 12400004
EPJ Web of Conferences epjconf/2016
de 18 MeV, fourni par l’accélérateur linéaire médical du LNE-LNHB. Le faisceau ainsi obtenu est homogène en termes de kerma dans l’air sur une surface de 30 × 30 cm² à 1 m. Dans un second temps, nous avons fabriqué, assemblé et caractérisé deux chambres d’ionisation à cavité en graphite pour réaliser les mesures ionométriques. Pour l’une de ces chambres, nous avons mesuré le volume de collection des charges permettant ainsi de l’utiliser en tant qu’étalon primaire, l’autre chambre d’ionisation étant un étalon de transfert, elle a été éta-lonnée dans un faisceau de 60Co et dans le faisceau de photons de haute énergie pour la ra-dioprotection. Les mesures effectuées avec les chambres d’ionisation ont permis d’évaluer la valeur du débit de kerma dans l’air dans le faisceau de photons de haute énergie: celle-ci couvre une gamme entre 80 mGy/h et 210 mGy/h, ce qui est compatible avec les besoins dans ce domaine. Enfin, nous avons calculé à l’aide de simulations Monte-Carlo des coeffi-cients de conversion du kerma dans l’air vers les équivalents de dose pour des énergies de photons discrètes de 10 keV à 22,4 MeV dans des configurations géométriques spécifiques et pour la distribution spectrale de la fluence produite sur le LINAC du LNE-LNHB.
1 Introduction
Radiation protection of workers susceptible to be exposed to ionizing radiation requires the use of dosimeters type tested and calibrated in radiation fields covering all the encountered situations at one’s workplace. For photon radiation, the radiation qualities to be used for type tests and calibrations are described in the international standard series ISO 4037. Moreover, in nuclear industry, dosimeters must be tested in high energy photon fields (mean energy of spec-trum of 6 to 7 MeV).
A LNE-LNHB project was launched in order to design, construct and characterize a high en-ergy photon field in order to meet the dosimeters manufacturers and users needs (Project Review 2014).
The international standard ISO 4037-1 [1] presents the production modes and the tech-nical characteristics of radiation fields that are necessary for the characterization of these do-simeters for high-energy photons. There are few facilities providing high-energy photon fields for radiation protection standards and calibration purposes. The current work presents a new practical solution of setting such fields using a conventional radiotherapy linear accelerator (LINAC).
2 State of the art
In nuclear power plants and near the large accelerators, the workers might be exposed to high-energy photons (> 2 MeV). In case of nuclear reactors, high-energy gamma fields are pro-duced by the activation of oxygen in the primary circuit fluids (i.e. water in France, carbon diox-ide in Great Britain). By an (n,p) reaction on 16O, fast neutrons produce 16N, then its decay gives
high energy photons, with an energy of 6.13 MeV (ISO 4037-1) [1].
Today, only the German (Calibration and Measurement Capabilities 2013) [2] and the Rus-sian (Calibration and Measurement Capabilities 2014) [3] National Metrological Institutes dis-pose of photonic high energy beams for the characterization of dosimeters. The PTB beams are produced by the activation of Fluor and/or Carbon targets by a proton beam, the VNIIM beams are produced by a LINAC (maximum energy 10 MeV) and a betatron (maximum energy 50 MeV). Radiation fields for radiation protection have to be characterized in terms of fluence and air kerma to derive the dose equivalents. Characterization in terms of air kerma using primary ionization chambers has already been performed at LNE-LNHB for photon beams used for radia-tion protecradia-tion and radiotherapy (137Cs and 60Co energies). Thus 6 primary cavity ionization
chambers have been designed and built in 2008 at the LNE-LNHB [4]. The same design is used for this study.
DOI: 10.1051/ 00004 (2016)
,
124 12400004
EPJ Web of Conferences epjconf/2016
For the characterization in terms of dose equivalents of the radiation fields, the determina-tion of conversion coefficients (from air kerma to dose equivalents) is needed. The average con-version coefficients are obtained through convolution of mono energetic concon-version coefficients (CC) with the fluence spectra at the measurement point. The mono energetic CC’s are available up to 10 MeV in ICRU report 57 [5].
In this work, a new high-energy photon reference facility for radiation protection is dscribed, and a series of Monte Carlo calculations of the CC are presented to extend the range of available CC up to 22.4 MeV.
3 High energy photon standard for radiation protection
Our objective is to obtain a radiation field with a narrow distribution of fluence in terms of energy, of an equivalent energy of 6 – 7 MeV, homogenous in terms of dose equivalent and/or air kerma over a 30 cm × 30 cm² surface, centered at the point of measurement, and with dose equivalent rates compatible with radiation protection purposes.
Figure 1. Depth dose normalized curves in a ‘slab’ phantom for mono energetic beams of 5, 6, 7, 8 and 9 MeV and radiotherapy spectra of 6, 12 and 20 MV
As a first stage of our work, a series of normalized percentage depth dose curves for mono energetic beams of high-energy photons were calculated using MCNP5 code.
In these simulations, a large source (larger than 30 cm × 30 cm) emits a parallel and ho-mogenous photon beam directed towards the entry facet of a ‘slab’ phantom of 30 cm × 30 cm × 15 cm made of tissue equivalent material (as defined by the ICRU [6]. The mono energetic pho-ton beams are of 5, 7 and 9 MeV, the same calculation were made with the three radiotherapy spectra of 6, 12 and 20 MV previously calculated in air, at the entry of a cubic, 30 cm × 30 cm × 30 cm water phantom [7]. As it can be seen in figure 1, the percentage depth dose normalized curves obtained with these three radiotherapy spectra are not superposed with those obtained with the mono energetic photon beams. This means that the radiotherapy spectra are unable to reproduce the behavior of a mono energetic high-energy photon beam. Nevertheless, the curve of the 20 MV radiotherapy spectrum intercepts the 10 mm depth vertical line in the same region
DOI: 10.1051/ 00004 (2016)
,
124 12400004
EPJ Web of Conferences epjconf/2016
that the curve of the 5 MeV beam. This clearly indicates that for a mean energy of about 6 MeV, the new high-energy photon beam for radiation protection could be obtained from a LINAC ra-diotherapy beam of about 20 MV, taking care of a consequent reduction of low photon energies by the use of a specifically designed target.
Therefore, a beam of high-energy photons can be obtained by the slowdown of an electron beam, on a metal target of high atomic number (needed in order to favor energy loss by brems-strahlung). In this work, we use high-energy electrons (18 MeV) supplied by the medical linear accelerator Delphes of LNE-LNHB in order to obtain high-energy photons. In order to “harden” the spectrum of photons (i.e. to reduce the proportion of low-energy photons), the high atomic number material of the target is supplemented by a material of low atomic number.
Interaction of an 18-MeV electron beam with several combinations of high-Z materials (tungsten, lead, gold, copper) and low-Z materials (graphite, beryllium) with various thicknesses were studied. A thorough analysis of the obtained simulated results showed that the best hard-ening of the spectrum and the best air kerma rate reduction was obtained with a layer of tung-sten thick of about 1.1 cm, followed by a layer of graphite of about 7.8 cm thick. However, for practical reasons (related to the cost and to the weight of the material), copper has been used as material for our target, still allowing good performance compared to tungsten. Prior to the de-sign of a proper shape of the conversion target, we have conducted preliminary experiments on several prototype Cu-C conversion targets (a 14 mm Cu target, a 28 mm Cu target; a mixed 28 mm Cu and 64 mm graphite conversion target). It ended that by simulating the interaction between an electron beam of 18 MeV with a copper-graphite conversion target (3.6 cm of cop-per and 15.7 cm of graphite), a spectrum of average energy weighted by fluence of 5.79 MeV was obtained. In this configuration, the electrons beam incident on the conversion target is of 7.5 cm × 7.5 cm. The geometric shape of the target should be adjusted in order to obtain a uniform beam on a surface of 30 cm × 30 cm at a distance of 1 m from the entry point to the target. The resulting simulated profiles lead to a particular shape of the Cu-C target. In order to obtain a homogeneous ambient dose equivalent distribution (± 2%) on an area of 30 × 30 cm², the target is thicker in its central part than at its edges. This is true for both materials constituting the tar-get, and the radial symmetry of the system directed us to superpose conical structures. Several successively adjusted models were simulated in order to set the final design of the target shown in Figure 2.
Figure 2. Final design of the conversion target
)
E
Copper target
Graphite filter
DOI: 10.1051/ 00004 (2016)
,
124 12400004
EPJ Web of Conferences epjconf/2016
The average energy weighted by fluence of the spectrum obtained by simulation with the final design of the target is of 6.17 MeV. The average energy weighted by energy fluence of this spectrum is equal to 9.02 MeV. The two average energies are given by the formulae:
(1) (2)
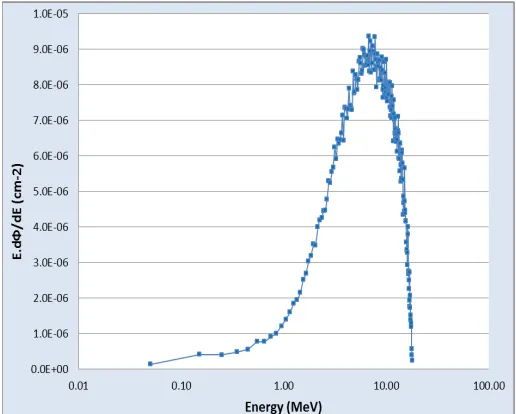
With this target, the distribution of air kerma is relatively uniform (± 2% compared to the mean value) along the horizontal and the vertical axis in the range of -15 cm to 15 cm. The radia-tion protecradia-tion spectrum in air is presented in the Figure 3 here below (the contriburadia-tion of low energies yields to ~2% of the total air kerma).
Figure 3. High-energy photon radiation protection spectrum
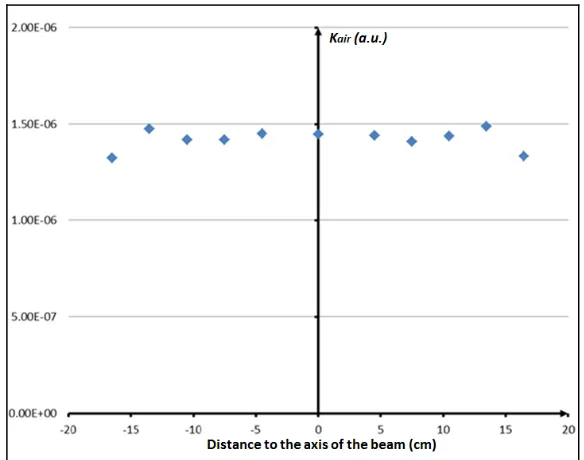
As an example the horizontal profile calculated over +/-15cm at a distance of 1 m from the target’s entry facet, is shown in figure 4. The maximum difference in respect to the average val-ue of the air kerma is of about 3%. The air kerma presents a similar distribution along the verti-cal axis over the same range. The homogeneity of the simulated beam is therefore sufficient on a 30 cm × 30 cm² surface at the measurement distance.
4 Primary standard for the high energy photon beam for radiation
protection
The LNE-LNHB has designed and built in 2008 a series of six primary cavity ionization chambers adapted to common radiation protection and radiotherapy beams (60Co, 137Cs). These
chambers have been used for the establishment of French primary standards in these beams in terms of air kerma. A primary dosimeter for the high-energy photon beam for radiation
protec-<
E
³
³
u
)
dE
dE
d
Φ
dE
dE
d
Φ
E
E
³
³
u
u
u
<
dE
dE
d
Φ
E
dE
dE
d
Φ
E
E
E
DOI: 10.1051/ 00004 (2016)
,
124 12400004
EPJ Web of Conferences epjconf/2016
tion has been built using the same design [8] as one of the existing primary spherical ionizing chambers (Figure 5). Its external wall and internal electrode are made of graphite, the charge collection volume of this new chamber has been determined in the laboratory. The average ab-sorbed dose in the cavity of an air-filled chamber is given by the following expression.
W
e
Q
V
D
air air
U
1
(3)
where Q is the electrical charge created in the cavity by the ionization of the gas by the radiation,
e is the elementary charge, ρair is the density of air, V is the cavity’s charge collection volume, and
W is the average energy needed for the creation of an ion pair in the gas (in our case, the gas is the air, identical to the ambient air, as the chamber has a hole allowing for the circulation of the air in and out of the chamber, thus called “open geometry” chamber).
Figure 4. Horizontal profile of the beam in terms of air kerma at 1 m from the entry facet of the target
Figure 5. Primary ionization chamber
The functioning of the ionization chamber has been tested by electrical characterization measurements in a reference isotopic beam (60Co). Recombination and polarity correction
fac-tors for this chamber are close to unity (1.0016 and, respectively, 1.0006), thus proving a good electrical performance of the chamber.
The characterization of the ionization chamber has been continued in the LINAC beam. The optimal polarization voltage has been measured; its value is of +850 volts. The stability of the signal over time has been tested; it is better than 0.13% and does not have systematic drift. The
Graphite spherical wall (cathode)
8 5 4
3 9
7 6
Graphite collection electrode Air cavity
DOI: 10.1051/ 00004 (2016)
,
124 12400004
EPJ Web of Conferences epjconf/2016
graphite wall of the chamber is thick enough (3 mm) to ensure electron equilibrium in a 60Co
beam, but not in the case of a energy LINAC beam. This problem is resolved by using a thick graphite electron equilibrium cap (27 mm). All subsequent reference measurements have been realized with this cap.
A first evaluation of the air kerma rate in the LINAC beam has been performed with this reference ionization chamber. Measurements of ionization currents have been normalized to the indications of the monitor ionization chamber, expressed in terms of Monitor Units (MU). The air kerma rate is then measured in grays per MU. It is expressed by the following
.
(4)
where:
MU is the charge corrected by temperature, pressure and humidity of the LINAC monitor ioniz-ing chamber,
the “/MU” index in a quantity indicates that the quantity is divided by the MU charge,
Q*ref is the charge Qref measured by the reference chamber, corrected of the leakage current, of
climate conditions (temperature, pressure, humidity), electrical factors (recombination, polari-ty) and of the non-punctual chamber (diffusion in the chamber’s stem, and radial and axial ani-sotropy of the beam),
(μen/ρ)air,graphite is the mass energy absorption coefficients ratio of air and graphite,
Sgraphite,air is the average collision mass stopping power ratio of graphite and air,
Agraphite is the correction factor due to the graphite wall (attenuation and diffusion of photons),
is the fraction of energy going into bremsstrahlung.
The values of the air kerma rate and the associated uncertainty and of intermediate terms are presented in Table 1.
Table 1. Determination of the reference air kerma rate
Quantities Values Uncertainty (k=1, %)
* /MU réf
Q
(C/MU) 1.1015 10-1 0.40Agraphite 9.485 10-1 0.21
Volume (m3) 4.1405 10-6 0.037
ρair (kg/m3) (dry air, 20 °C, 1013,25 hPa) 1.2047 0.001
W/e Sgraphite,air (J/C) 32.18 0.93
(μen/ρ)air,graphite 1.038 1.5
1 / (1-
ḡ)
1.024 1.4(Gy/h) 7.96 105 2.3
Detailed correction factors (other than climate factors) to be applied to Qref and their
asso-ciated uncertainties are presented in Table 2.
The air kerma rate, expressed in grays per unit time was estimated using the average quan-tity of charge measured by the monitor per minute (~ 4.32×10⁻⁹ MU/min). The air kerma rate is
~ 200 mGy/h at 1.45 m from the virtual point source. The results are resumed in the Table 3. DOI: 10.1051/
00004 (2016) ,
124 12400004
EPJ Web of Conferences epjconf/2016
Table 2. Correction factors applied to the measured charge, corrected of climate conditions, and associated uncertainties.
Factors Values Uncertainty (k=1, %) Polarity, kpol 1.0006 0.051
Recombination, krec 1.0016 0.097
Stem, kst 0.9997 0.32
Radial anisotropy, krn 1.0000 0.14
Axial anisotropy, kan 1.0000 0.025
Table 3. Estimation of the measured air kerma rate per time unit. Measurement distance Current I (A) (Gy/h)
1.45 m (reference) -7.925 10-12 2,064 (46) 10-1
3.45 m -1.398 10-12 3,641 (82) 10-2
The reference values of the air kerma rate in this beam and the conversion coefficients (section 6) allow calculating radiation protection operational quantities.
5 Realization and calibration of a transfer dosimeter for the high energy
photon beam for radiation protection
An ionization chamber, identical to the primary ionization chamber described above, has been built. The current measurements for the calibration of this chamber have been performed in the same conditions as those described in the previous chapter, using an electron equilibrium cap (27 mm thickness). The characteristics of the chamber in terms of recombination, polarity and leakage currents were studied giving the same results as those of the chamber used for the primary measurements.
This chamber has been calibrated in the 60Co beam of the LNE-LNHB (Figure 6), using an
ionometric chain (electrometer, cables, etc.). The calibration coefficient, NKair,60Co, is 7.66×10 6
Gy/C, with an uncertainty of 0.64 % (k = 2) (LNHB Calibration Certificate No. 103141, 2014). The measurements performed in the LINAC beam resulted in the following calibration coeffi-cient: NKair,LINAC = 6.92×10⁶ Gy/C, with an uncertainty of 4.5 % (k = 2) (LNHB Calibration
Certificate No. 103142, 2014).
Figure 6. Ionization chamber in the 60Co beam of LNE-LNHB
DOI: 10.1051/ 00004 (2016)
,
124 12400004
EPJ Web of Conferences epjconf/2016
6 Calculations of conversion coefficients
Conversion coefficients (CC) relate physical quantities and operational quantities. Physical quantities for dosimetry of ionizing radiation are the fluence (Φ), the kerma (K) and the ab-sorbed dose (D). Dose equivalents (ambient H*(10) or personal Hp(10)) are the operational
quantities used for strongly penetrating radiation [9,10]. Conversion coefficients (kΦ) and (hk)
allow obtaining air kerma from fluence and dose equivalent from air kerma, respectively.
hν
Source Detector
Figure 7. Geometry used for the calculation of kΦ
(pGy·cm2) (5)
(Sv/Gy) (6)
The values of the mono energetic CC are given in ICRU 57 report (ICRU no. 57 1998) up to 10 MeV for photons. For the purpose of the present work values up to 18 MeV are needed, so we calculated them and made a comparison of our calculations with the values of ICRU 57. The conversion coefficient kΦ is evaluated in a simplified geometry (Figure 7). The source is
homog-enously distributed over a thin disc of 15 cm radius. The detector is a disc of dry air (composi-tion defined by ICRU) of 15 cm radius and a thickness of 0.05 cm (Figure 7). The source and the detector are in vacuum.
The conversion coefficients for ambient dose equivalent h*k(10) are evaluated in a
geome-try using the phantom, currently named “ICRU sphere”, defined in ICRU Report 39 (ICRU no. 39 1985). This phantom is a sphere of 15 cm radius made of 4-element tissue equivalent material, having a density of 1 g/cm3 (ICRU no. 47 1992) (Figure 8). The conversion coefficients for
per-sonal dose equivalent hk,p(10) are evaluated in a geometry using the phantom, currently named
“ICRU slab phantom”. This phantom has been defined by ICRU: it is a parallelepiped slab of 30 cm × 30 cm × 15 cm, in the same 4-element tissue equivalent material (ICRU no. 47 1992) (Fig-ure 9).
DOI: 10.1051/ 00004 (2016)
,
124 12400004
EPJ Web of Conferences epjconf/2016
h
ν
Source
Detector
ICRU Sphere
Figure 8. Geometry used for the calculation of h*Φ(10) and h*k(10)
hν
Source
Detector
ICRU « slab » phantom
30 cm
15 cm x
y
z
Figure 9. Geometry used for the calculation of hΦ,p(10) and hk,p(10)
The dose equivalent is related to the absorbed dose by a simple formula: H = Q∙D, where Q
is the average quality factor. For photons, this average quality factor equals to 1 [11]. Therefore, the absorbed dose to tissue, expressed in Gy, is numerically equal to the dose equivalent, ex-pressed in Sv.
The numerical Monte Carlo simulations have been performed with the MCNP5 (X-team 5, MCNP 2003) [12] and PENELOPE 2008 [13] codes. The geometries described above are simu-lated with both codes, and the number of particles followed is chosen in order to achieve a suffi-ciently low uncertainty. The MCNP5 code uses the following cross-section libraries: MCPLIB04 for photons, and EL03 for electrons (LLNL EPDL 1997) [14]. Photoelectric cross-sections used by the PENELOPE 2008 code are those of the EPDL 97 library (LLNL EPDL 1997).
Incident photon energy for the evaluation of mono energetic conversion coefficients ranges from 10 keV to 22 MeV. This energy range is significantly larger (low and high energy) than the energy range used in the ICRU 57 Report (10 keV – 10 MeV) (ICRU no. 57 1998). MCNP5 and PENELOPE 2008 codes use more recent cross-sections libraries than those that have been used in order to obtain the conversion coefficients given in ICRU 57 Report. Moreover, all the results presented in ICRU 57 Report have been calculated in a “kerma approximation”, i.e. considering that the secondary electrons created by photons deposit their energy locally. For high-energy photons, in an energy range where electronic equilibrium is fulfilled at 10 mm depth, we have:
KT ≈ DT (KT is the kerma in tissue and DT is the absorbed dose in tissue). Therefore, numerically,
H*(10) ≈ KT and Hp(10) ≈ KT. In an energy range where electronic equilibrium is not yet
estab-lished, we have: DT < KT. Therefore, numerically, H*(10) < KT and Hp(10) < KT.
Electronic equilibrium is reached at a depth greater than the practical range of the elec-trons. In our calculations, the “detector” is situated at a depth of 10 mm, inside the phantom in tissue equivalent material. After the evaluation of the range of electrons in the tissue equivalent
DOI: 10.1051/ 00004 (2016)
,
124 12400004
EPJ Web of Conferences epjconf/2016
material by Monte Carlo simulations in MCNP5, we have concluded that for this depth, the elec-tronic equilibrium is not ensured for energy higher than 2 MeV. This point has been already underlined for Hp(3) quantity for photon energies higher than 1 MeV [15]. Thus, for incident
photon energy above 2 MeV, the “kerma approximation” and the absorbed dose calculations are significantly different. By carefully choosing the cut-off energies for electrons and positrons in PENELOPE 2008 (50 keV) and evaluating the appropriate tallies in MCNP5 (i.e. tally F6 for air kerma calculations and tally *F8 for absorbed dose calculations), we have calculated the mono energetic conversion coefficients (from fluence or from air kerma to dose equivalent) in “kerma approximation”, and also in terms of the absorbed dose, DT.
7 Results and Discussions
In the great majority of cases, a good agreement was obtained between MCNP5 and PE-NELOPE 2008: the difference between values obtained by the two codes is generally smaller than 0.5%. In Tables 4, and 5 the calculated values of several conversion coefficients, in “kerma approximation” and in terms of absorbed dose are presented for mono energetic photons. The values of the coefficients presented in these three tables are mean values of coefficients calcu-lated by MCNP5 and by PENELOPE 2008 calculation.
The conversion coefficients have been compared to the data from the ICRU 57 Report (ICRU no. 57 1998) for photon energy up to 10 MeV. In the range 10 keV – 2 MeV, we have found a good agreement between the coefficients calculated in “kerma approximation” and in ab-sorbed dose, with those presented in the ICRU 57 Report. According to Table 6 for the h*k(10)
coefficients, for the energies equal to or greater than 3 MeV, only the coefficients obtained in “kerma approximation” are close to the values reported in ICRU 57 (Table A.21., pp 179).
Figure 10.h*k(10) values as function of energy (in “kerma approximation”, in absorbed dose calculations
and according to the ICRU-57 Report)
In the range 3 MeV – 22.4 MeV, the difference between the conversion coefficients h*k(10)
obtained in “kerma approximation” and in absorbed dose calculations increases sharply with the energy. This is explained by the fact that for the high energies of photons the build-up
dis-DOI: 10.1051/ 00004 (2016)
,
124 12400004
EPJ Web of Conferences epjconf/2016
tances of secondary electrons is considerably higher than 10 mm. The curves in Figure 10 show these differences for the h*k(10) coefficients.
Table 4. Conversion coefficients h*k obtained in absorbed dose calculations,
average value of MCNP5 and PENELOPE 2008 calculations Photon
en-ergy (MeV)
Mean h*Φ(10) coef-ficients (pSv·cm²)
Mean h*k(10) coeffi-cients (Sv/Gy)
Mean hΦ.p(10)
coef-ficients (pSv·cm²)
Mean hk.p(10)
coeffi-cients (Sv/Gy)
0.01 0.064 0.008 0.064 0.008
0.02 1.049 0.607 1.055 0.611
0.04 0.631 1.437 0.660 1.504
0.06 0.512 1.749 0.557 1.901
0.08 0.539 1.747 0.588 1.906
0.1 0.620 1.663 0.676 1.814
0.2 1.204 1.404 1.281 1.495
0.3 1.796 1.300 1.895 1.371
0.4 2.360 1.246 2.470 1.304
0.5 2.874 1.206 3.000 1.259
0.6 3.378 1.186 3.491 1.226
0.8 4.282 1.154 4.408 1.188
1 5.126 1.142 5.249 1.169
1.5 6.922 1.125 7.041 1.144
2 8.418 1.113 8.541 1.129
3 10.647 1.068 10.784 1.082
4 10.851 0.894 10.970 0.904
5 10.320 0.728 10.469 0.739
6 9.773 0.604 9.925 0.613
8 9.051 0.450 9.175 0.456
10 8.646 0.358 8.788 0.364
11 8.518 0.326 8.634 0.330
12 8.429 0.299 8.529 0.303
13 8.384 0.277 8.441 0.279
14 8.284 0.256 8.423 0.261
15 8.223 0.239 8.334 0.242
16 8.171 0.223 8.336 0.228
17 8.145 0.210 8.283 0.214
18 8.206 0.201 8.270 0.202
19 8.154 0.189 8.278 0.192
20 8.134 0.179 8.214 0.181
21 8.118 0.171 8.256 0.174
22 8.151 0.164 8.244 0.165
DOI: 10.1051/ 00004 (2016)
,
124 12400004
EPJ Web of Conferences epjconf/2016
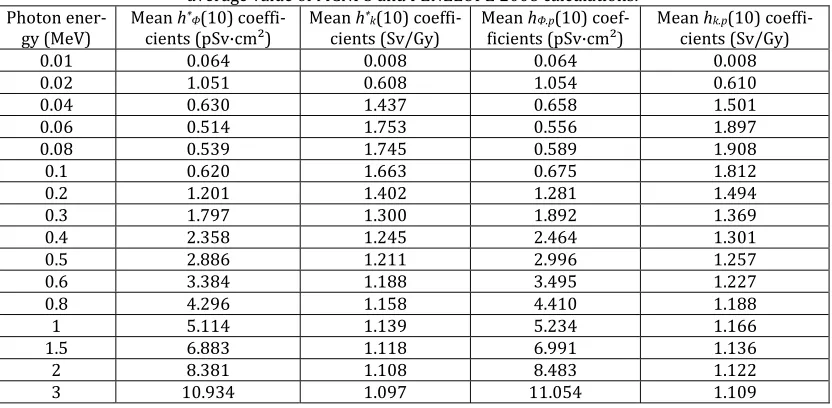
Table 5. Conversion coefficients h*k obtained in “kerma approximation” calculations,
average value of MCNP5 and PENELOPE 2008 calculations. Photon
ener-gy (MeV)
Mean h*Φ(10) coeffi-cients (pSv·cm²)
Mean h*k(10) coeffi-cients (Sv/Gy)
Mean hΦ.p(10)
coef-ficients (pSv·cm²)
Mean hk.p(10)
coeffi-cients (Sv/Gy)
0.01 0.064 0.008 0.064 0.008
0.02 1.051 0.608 1.054 0.610
0.04 0.630 1.437 0.658 1.501
0.06 0.514 1.753 0.556 1.897
0.08 0.539 1.745 0.589 1.908
0.1 0.620 1.663 0.675 1.812
0.2 1.201 1.402 1.281 1.494
0.3 1.797 1.300 1.892 1.369
0.4 2.358 1.245 2.464 1.301
0.5 2.886 1.211 2.996 1.257
0.6 3.384 1.188 3.495 1.227
0.8 4.296 1.158 4.410 1.188
1 5.114 1.139 5.234 1.166
1.5 6.883 1.118 6.991 1.136
2 8.381 1.108 8.483 1.122
3 10.934 1.097 11.054 1.109
Table 5 continue. Conversion coefficients h*k obtained in “kerma approximation” calculations,
average value of MCNP5 and PENELOPE 2008 calculations.
4 13.219 1.089 13.304 1.096
5 15.372 1.084 15.424 1.088
6 17.410 1.076 17.484 1.080
8 21.462 1.066 21.565 1.072
10 25.468 1.056 25.556 1.059
11 27.531 1.053 27.610 1.056
12 29.569 1.050 29.629 1.052
13 31.661 1.047 31.666 1.047
14 33.705 1.043 33.743 1.044
15 35.815 1.040 35.803 1.040
16 37.976 1.039 37.910 1.037
17 40.074 1.035 40.077 1.035
18 42.097 1.029 42.259 1.033
19 44.292 1.028 44.389 1.030
20 46.447 1.025 46.616 1.029
21 48.689 1.023 48.843 1.027
22 50.844 1.021 51.098 1.026
In Figure 10 a difference between the h*k(10) coefficients calculated in “kerma
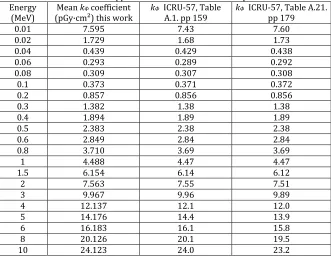
approxima-tion” and tabulated in the ICRU 57 Report (Table A.21., pp. 179) is visible for energies higher than 300 keV. These disparities arise from slightly different values of the Kair/Φ quantity (used
to determine the value of the h*k(10) coefficients), as can be seen in table 7.
The values of kΦ in Table A.1 have been obtained using input data from 1982, whilst the
values of kΦ in Table A.21 have been obtained using input data from 1995. The largest difference
between these two sets is of ~3.5%. The largest difference between the values of the h*k(10)
coefficients presented in Table 6 is of ~3,8%. We therefore conclude that this difference may be explained by the difference between the two sets of air kerma..
A similar comparison of coefficients has been performed for another set of conversion coef-ficients: hk,p(10). In the same manner as for the h*k(10) coefficients, in the range 10 keV – 2 MeV,
DOI: 10.1051/ 00004 (2016)
,
124 12400004
EPJ Web of Conferences epjconf/2016
we have found a good agreement between the coefficients calculated in “kerma approximation” and in absorbed dose, with those presented in the ICRU 57 Report. According to Table 8 pre-sented here below for the hk,p(10) coefficients, for the energies equal to or greater than 3 MeV,
only the coefficients obtained in “kerma approximation” are close to the values reported in ICRU 57 (Table A.24., pp 182).
As for the h*k(10) coefficients, in the range 3 MeV – 22.4 MeV, the difference between the
conversion coefficients hk,p(10) obtained in “kerma approximation” and in absorbed dose
calcu-lations increases sharply with the energy due to the build-up depth of secondary electrons con-siderably higher than 10 mm above 3 MeV. The curves in Figure 5 show these differences for the
hk,p(10) coefficients.
In Figure 11 a difference between the hk,p(10) coefficients calculated in “kerma
approxima-tion” and tabulated in the ICRU – 57 Report (Table A.24., pp. 182) is visible for energies higher than 2 MeV. As for the h*k(10) coefficients, it is explained by the difference between the two sets
of air kerma values.
Figure 11.hk,p(10) values as function of energy (in “kerma approximation”, in absorbed dose calculations
and according to the ICRU-57 Report)
DOI: 10.1051/ 00004 (2016)
,
124 12400004
EPJ Web of Conferences epjconf/2016
Table 6. Air kerma – ambient dose equivalent conversion coefficients calculated in absorbed dose, in “kerma approximation” and in ICRU-57 Report
Photon energy (MeV)
h*k(10) (Sv/Gy) in absorbed dose
h*k(10) (Sv/Gy) in “kerma
approxima-tion”
h*k(10) (Sv/Gy) in ICRU - 57 report, Table A.21. pp 179
0.01 0.008 0.008 0.008
0.02 0.607 0.608 0.61
0.04 1.437 1.437 1.47
0.06 1.749 1.753 1.74
0.08 1.747 1.745 1.72
0.1 1.663 1.663 1.65
0.2 1.404 1.402 1.40
0.3 1.300 1.300 1.31
0.4 1.246 1.245 1.26
0.5 1.206 1.211 1.23
0.6 1.186 1.188 1.21
0.8 1.154 1.158 1.19
1 1.142 1.139 1.17
1.5 1.125 1.118 1.15
2 1.113 1.108 1.14
3 1.068 1.097 1.13
4 0.894 1.089 1.12
5 0.728 1.084 1.11
6 0.604 1.076 1.11
8 0.450 1.066 1.11
10 0.358 1.056 1.10
Table 7. Fluence – air kerma conversion coefficients calculated in “kerma approximation” and in ICRU 57 Report Energy
(MeV)
Mean kΦ coefficient
(pGy·cm²) this work
kΦ ICRU-57, Table
A.1. pp 159
kΦ ICRU-57, Table A.21.
pp 179
0.01 7.595 7.43 7.60
0.02 1.729 1.68 1.73
0.04 0.439 0.429 0.438
0.06 0.293 0.289 0.292
0.08 0.309 0.307 0.308
0.1 0.373 0.371 0.372
0.2 0.857 0.856 0.856
0.3 1.382 1.38 1.38
0.4 1.894 1.89 1.89
0.5 2.383 2.38 2.38
0.6 2.849 2.84 2.84
0.8 3.710 3.69 3.69
1 4.488 4.47 4.47
1.5 6.154 6.14 6.12
2 7.563 7.55 7.51
3 9.967 9.96 9.89
4 12.137 12.1 12.0
5 14.176 14.4 13.9
6 16.183 16.1 15.8
8 20.126 20.1 19.5
10 24.123 24.0 23.2
DOI: 10.1051/ 00004 (2016)
,
124 12400004
EPJ Web of Conferences epjconf/2016
Table 8. Air kerma – personal dose equivalent conversion coefficients calculated in absorbed dose, in “kerma approximation” and in ICRU-57 Report
Photon energy (MeV)
hk,p(10) (Sv/Gy)
in absorbed dose
hk,p(10) (Sv/Gy) in
“kerma approximation”
hk,p(10) (Sv/Gy) in ICRU - 57
report, Table A.24. pp 182
0.01 0.008 0.008 0.009
0.02 0.611 0.610 0.611
0.04 1.504 1.501 1.490
0.06 1.901 1.897 1.892
0.08 1.906 1.908 1.903
0.1 1.814 1.812 1.811
0.2 1.495 1.494 1.492
0.3 1.371 1.369 1.369
0.4 1.304 1.301 1.300
0.5 1.259 1.257 1.256
0.6 1.226 1.227 1.226
0.8 1.188 1.188 1.19
1 1.169 1.166 1.167
1.5 1.144 1.136 1.139
3 1.082 1.109 1.117
6 0.613 1.080 1.109
10 0.364 1.059 1.111
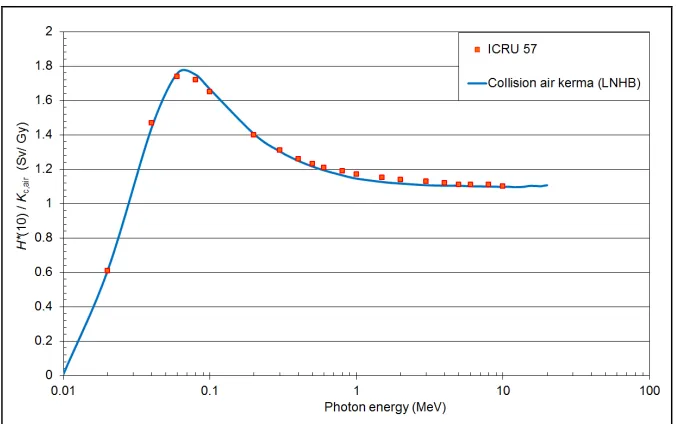
Two new sets of conversion coefficients has been calculated replacing total air kerma by collision air kerma for h*k and hk,p (Figures 12 and 13). Looking at these sets of data, the
discrep-ancies with ICRU 57 values do not exist anymore. This leads to the conclusion that the ICRU 57 data set was calculated with the collision air kerma rather than the air kerma, and therefore that the data of table A1 page 59 of ICRU 57 are related to collision air kerma.
Figure 12.h*k(10) values as function of energy (according to the ICRU-57 Report and using collision air kerma in “kerma approximation”)
DOI: 10.1051/ 00004 (2016)
,
124 12400004
EPJ Web of Conferences epjconf/2016
Figure 13.hk,p(10) values as function of energy (according to the ICRU-57 Report and using collision air
kerma in “kerma approximation”)
The coefficients using collision air kerma are given in Table 9.
Table 9.h*k(10) and hk,p(10) values using collision air kerma
Photon energy (MeV)
h*k(10) using collision air kerma (Sv/Gy)
hk.p(10) using collision air kerma
(Sv/Gy)
0.01 0.008 0.008
0.02 0.610 0.611
0.04 1.442 1.505
0.06 1.759 1.905
0.08 1.749 1.912
0.1 1.665 1.815
0.2 1.405 1.498
0.3 1.304 1.372
0.4 1.249 1.306
0.5 1.216 1.263
0.6 1.194 1.233
0.8 1.165 1.195
1.0 1.146 1.173
1.5 1.126 1.144
2 1.117 1.130
3 1.107 1.120
4 1.105 1.112
5 1.104 1.108
6 1.101 1.106
8 1.099 1.105
10 1.098 1.102
11 1.098 1.101
12 1.096 1.098
13 1.097 1.097
14 1.099 1.100
DOI: 10.1051/ 00004 (2016)
,
124 12400004
EPJ Web of Conferences epjconf/2016
Table 9 continue.h*k(10) and hk,p(10) values using collision air kerma
15 1.103 1.103
16 1.103 1.101
17 1.103 1.103
18 1.101 1.105
19 1.104 1.107
20 1.107 1.111
Finally, the mean CC’s over the whole spectrum produced by the LINAC were calculated us-ing two assumptions: the first takus-ing into account the collision air kerma and air kerma approx-imation as in ICRU 57, and the second accounting for the full transport of secondary particles (therefore in line with the definition of the dose equivalent, that is to say taking into account the energy really absorbed locally). These mean conversion coefficients from Kair to H*(10) and
Hp(10) for the energy spectrum of the LINAC radiation protection beam are given in Table 10.
Table 10. Mean values of conversion coefficients obtained from mono-energetic conversion coefficients for the radiation protection beam
Calculation hypotheses
total tissue kerma and collision air kerma (according to ICRU-57)
Figures 12 and 13
absorbed dose in tissue and total air kerma
Figures 10 and 11
h*k(10) (Sv/Gy) 1.103 0.535
hk,p(10) (Sv/Gy) 1.108 0.544
These mean coefficients have been compared to mono-energetic conversion coefficients. The values in Table 10 are close to those for a beam of 6 MeV, for which we have: h*k(10) = 1.076
Sv/Gy and hk,p(10) = 1.080 Sv/Gy, confirming our evaluation of the mean equivalent energy of
the radiation protection beam. These results validate our choice of the target designed and built for the LINAC, as regards the initial objective, which is to create a radiation protection photon beam with similar characteristics as those of a mono-energetic beam of 6 to 7 MeV.
8 Conclusions
In this work, a reference high-energy photon beam for radiation protection was designed and produced using a LINAC operated in electron mode and tuned to generate 18 MeV electrons. An additional target/filter was added at the output of the LINAC head. This target/filter is made of a combination of copper and graphite materials, in order to harden the spectrum and de-crease the dose equivalent rate. The new radiation field has a mean energy in terms of fluence of 6.17 MeV. The kerma rate is homogenous on a 30 cm × 30 cm area at a distance of 1 m from the target. A dedicated primary standard based on cavity ionization chamber has been constructed allowing the absolute measurement of the air kerma in the new high-energy photon beam. The measured air kerma rate lies between 0.2 and 0.036 Gy/h at 1.45 m and 3.45 from the target respectively. The standard uncertainty is equal to 2.3%.
Monte Carlo simulations were used to calculate the conversion coefficients from air kerma to dose equivalents quantities above 10 MeV up to 20 MeV. The results show a good agreement with the ICRU 57 data taking into account the kerma approximation for the calculations and the collision air kerma rather than the total air kerma. This demonstrates that the conversion coeffi-cients published in ICRU 57 were related to collision air kerma. Using these results the conver-sion coefficients for the whole LINAC spectrum were calculated. Taking into account that the LINAC produced pulsed radiation, this new radiation field can be used to calibrate any passive dosimeters and ionization chambers. Despite the fact that for Geiger-Muller and proportional counters the instantaneous dose rate is too high, leading to a saturation of detectors, calibra-tions of passive dosimeters in a high-energy photon beam are now available at LNE-LNHB.
DOI: 10.1051/ 00004 (2016)
,
124 12400004
EPJ Web of Conferences epjconf/2016
References.
1. International Standard ISO 4037-1:1996, ISO 4037-2:1997, ISO 4037-3:1999 „X and gamma reference radiation for calibrating dosemeters and doserate meters and for determining their response as a function of photon energy”
2. Calibration and Measurement Capabilities – Ionizing Radiation. Complete CMCs in Ionizing Radiation for Germany. The BIPM key comparison database, February 2013 http://kcdb.bipm.org/AppendixC/country_list_search_RI.asp?CountSelected=PTB;10;-;6;-&branch=1&quantity=10&source=6&country_sel=DE accessed on April 23, 2014)
3. Calibration and Measurement Capabilities – Ionizing Radiation. Complete CMCs in Ionizing Radiation for Russian Federation. The BIPM key comparison database, July 2004 (http://kcdb.bipm.org/AppendixC/country_list_search_RI.asp?CountSelected=VNIIM;8;-;6;-&branch=1&quantity=8&source=6 accessed on April 23, 2014)
4. F. Delaunay, M. Donois, J. Gouriou, E. Leroy, A. Ostrowsky, „New LNHB primary standard for 60Co air kerma” Metrologia (2010), Vol. 47, pp. 652-658
5. ICRU Report No. 57 „Conversion Coefficients for use in Radiological Protection against External Radiation” (1998)
6. ICRU Report No. 44 „Tissue Substitutes in Radiation Dosimetry and Measurement” (1989) 7. J. Mazurier, Ph. D. Thesis „Adaptation of Monte Carlo code PENELOPE for absorbed dose
metrology: characterization of high energy X photon beams and calculation of correction factors of reference dosemeters”, 1999
8. D. Dusciac, M. Boudiba, J.-M. Bordy, J. Daures, „Etude pour l’établissement d’une référence de faisceaux photoniques de haute énergie pour la radioprotection”, Congrès de la Société Française de Radioprotection (SFRP), Bordeaux, June 2013
9. ICRU Report No. 39 „Determination of Dose Equivalents Resulting from External Radiation Sources” (1985)
10. ICRU Report No. 47 „Measurement of Dose Equivalents from External Photon and Electron Radiations” (1992)
11. J. R. Greening „Fundamentals of Radiation Dosimetry”, Second Edition, CRC Press (1985) 12. X-team 5, MCNP — A General Monte Carlo N-Particle Transport Code, Version5, rapport
LA-UR-03-1987 (2003)
13. Salvat F., Fernandez-Varea J.-M., Acosta E. et Sempau J., “PENELOPE, A code system for Monte Carlo simulation of electron and photon transport”, Proceedings of a Workshop/Training course, OECD/NEA, 5-7 novembre 2001, NEA/NSC/DOC(2001)19, ISBN:92-64-18475-9, http://www.oecdnea.org/tools/abstract/detail/nea-1525/.
14. LLNL Evaluated Photon Data Library (EPDL), UCRL-50400, Vol. 6, Rev. 5 (1997)
15. J. Daures, J. Gouriou, J. M. Bordy, „Monte Carlo determination of the conversion coefficients Hp(3)/Ka in a right cylinder phantom with ‚PENELOPE’ code. Comparison with ‚MCNP’ simulations” Radiation Protection Dosimetry (2011), Vol. 144, No. 1–4, pp. 37–42
DOI: 10.1051/ 00004 (2016)
,
124 12400004
EPJ Web of Conferences epjconf/2016