Article 1
Si-disordering in MgAl
2O
4-spinel at high
P
-
T
2
conditions, with implication to Si-Mg disorder in
3
Mg
2SiO
4-ringwoodite
4
Liping Liu1,2, Xi Liu1,2*, Xinjian Bao1,2, Qiang He3, Wei Yan1,2,4, Yunlu Ma1,2, 5
Mingyue He4, Renbiao Tao5 and Ruqiang Zou6 6
1School of Earth and Space Sciences, Peking University, Beijing 100871, China 7
2Key Laboratory of Orogenic Belts and Crustal Evolution, Ministry of Education of China, 8
Beijing 100871, China
9
3Institute of Fluid Physics, China Academy of Engineering Physics, Mianyang 659000, 10
China
11
4School of Gemmology, China University of Geosciences (Beijing), Beijing 100083, China 12
5Geophysical Laboratory, Carnegie Institution of Washington, Washington, D.C. 20015, 13
U.S.A.
14
6Beijing Key Lab of Theory and Technology for Advanced Battery Materials, Department 15
of Material Science and Engineering, College of Engineering, Peking University, Beijing
16
100871, China
17 18
*Corresponding Author: Xi Liu
19
Email: [email protected] Tel: 86-10-6275-3585 Fax: 86-10-6275-2996
20
Abstract: A series of Si-bearing MgAl2O4-spinels were synthesized at 1500-1650 °C
21
and 3-6 GPa. These spinels had SiO2 contents up to ~1.03 wt%, and showed a
22
substitution mechanism of Si4+ + Mg2+ = 2Al3+. Unpolarized Raman spectra were
23
collected from polished single grains, and displayed a set of well-defined Raman
24
peaks at ~610, 823, 856 and 968 cm-1 which had not been observed before. Aided
25
with the Raman features of natural Si-free MgAl2O4-spinel, synthetic Si-free
26
MgAl2O4-spinel, natural low quartz, synthetic coesite, synthetic stishovite and
27
synthetic forsterite, we infer that these Raman peaks should belong to the SiO4
28
groups. The relations between the Raman intensities and SiO2 contents of the
29
Si-bearing MgAl2O4-spinels suggest that at some P-T conditions some Si must adopt
30
the M-site. Unlike the SiO4 groups with very intense Raman signals, the SiO6 groups
31
are largely Raman-inactive. We have further found that the Si cations primarily
32
appear on the T-site at P-T conditions ≤ ~3-4 GPa and 1500 oC, but attain a random
33
distribution between the T-site and M-site at P-T conditions ≥ ~5-6 GPa and
34
1630-1650 oC. This Si-disordering process observed for the Si-bearing
35
MgAl2O4-spinels hints that similar Si-disordering might happen to the
36
(Mg,Fe)2SiO4-spinels (ringwoodite), the major phase in the lower part of the mantle
37
transition zone of the Earth and the index mineral for the very strong shock stage
38
experienced by extraterrestrial materials. The likely consequences have been
39
explored.
40
Keywords: 4-coordinated Si; 6-coordinated Si; MgAl2O4-spinel; Mg2SiO4-ringwoodite;
41
Raman spectroscopy; Si-disordering
42 43
1. Introduction 44
Spinel (Sp; AB2O4) sensu lato plays a crucial role in Earth sciences. The so-called
45
2-3 Sp, A = 2+ cations and B = 3+ cations, is ubiquitous in most terrestrial rocks [1,2].
46
With significant compositional complexity and wide P-T stability field, it
47
participates many phase equilibria, which can be calibrated as geothermometers,
48
geobarometers and oxybarometers [3-5], and therefore has many geological
49
implications. Taking the chromian Sp as an example, it has been widely used as a
50
"petrological litmus paper" to classify upper mantle peridotites, explore melt
51
compositional characteristics of the upper mantle, probe crystallization processes of
52
basaltic magmas, and estimate P-T conditions of diamond formation [6-9].
53
Additionally, the 2-3 Sp is widely observed on some extraterrestrial planets,
54
asteroids and meteorites [10-14]. Furthermore, it is even found as one of the major
55
phases in some lunar rocks or lunar meteorites [15,16], implying some special
56
features of the magma's evolution history of the Moon.
57
Less frequently observed, the so-called 4-2 Sp (A = 4+ cations and B = 2+ cations)
58
is also geologically important, with the (Mg,Fe)2SiO4-Sp (or ringwoodite; Rw) being
59
the most distinct example. It has been accepted that Rw with an Mg# of ~89 (Mg# =
60
100Mg/(Mg+Fe); molar ratio) is the most abundant phase in the lower part of the
61
mantle transition zone (LP-MTZ; ~520-660 km). The physical-chemical properties of
62
the Rw thus have significant implications in building the mineralogical models of
63
the Earth's deep interior, constraining the origins of the 520-km and 660-km seismic
64
discontinuities, and exploring the rheological behavior and convection process of
65
the MTZ [17-21]. Recent discovery of a terrestrial Rw crystal included in a diamond
66
confirms the superior role that Rw plays [22]. In comparison, extraterrestrial Rw has
67
been commonly documented in L ordinary chondrites ([23]; and references therein),
68
and less frequently recorded in H ordinary chondrites [24,25], LL ordinary
69
chondrites [14,26], CV carbonaceous chondrite [27], and CB carbonaceous chondrite
70
[28]. Furthermore, it has been observed in some lunar meteorites [29,30] and many
71
Martian meteorites (for Rw in the shergottite, see Boonsue & Spray [31], Baziotis et
72
al. [32], Greshake et al. [33], Walton [34], Walton et al. [35], Ma et al. [36,37], and
73
Miyahara et al. [38]; for Rw in the chassigny, see Fritz & Greshake [12]). Rw has
74
been proposed as the index mineral for the very strong shock stage experienced by
75
the meteorites (S6; [39]), and its discoveries have set important constraints on the
76
shock P-T conditions, shock durations, and sizes of the impactors, which may be
77
combined with the radiometric ages of the shock events to provide valuable
78
knowledge for the theoretical evolution models of the early solar system [23,40,41].
One distinct feature of the structure of Sp is its order-disorder phenomenon. Sp
81
has the space group Fd m, and has two symmetrically different metal sites
82
(tetrahedral and octahedral sites, with 1/8 of the former and 1/2 of the latter
83
occupied by cations; T-site and M-site hereafter), so that its structural formula is
84
usually written as [4]A[6]B2O4. The cations on these two sites readily switch positions,
85
and Sp becomes disordered, leading to a more general formula [4](A1-xBx)[6](AxB2-x)O4,
86
where x is the inversion parameter (x = 0 normal Sp; x = 1 inverse Sp; x = 0.667
87
completely-disordered Sp). This order-disorder process is complicated, and
88
influences many elastic, thermodynamic and thermochemical properties [19,42-46].
89
The order-disorder status of the 2-3 MgAl2O4-Sp, the archetype of all spinels,
90
can be significantly affected by T, P, composition, and even grain size. The
91
MgAl2O4-Sp is generally a normal Sp at ambientcondition, but becomes partially or
92
even fully disordered as T and P increase [42,43,45,47-57]. Its inversion parameter x
93
increases as its grain size decreases [58]. Additionally, there have been some
94
preliminary discussions on the effect of composition [42,53]. In contrast, the
95
order-disorder issue of the 4-2 Mg2SiO4-Sp (Rw) is still hotly debated, and
96
convincing evidence to the presence of 6-coordinated Si remains at large. From
97
knowledge on ionic radius systematics and thermodynamic considerations
98
[19,59,60], a small amount of structural disorder was suggested, with x reaching
99
~0.02-0.04 for the P-T conditions of the LP-MTZ. However, high-resolution 29Si MAS
100
NMR data indicated no 6-coordinated Si [61], a result potentially affected by a fast
101
structural reequilibrating during sample-quenching process. Nevertheless, the Rw
102
grains in the highly-shocked L6-type ordinary chondrites NWA 1662 and NWA 463,
103
with distinct and different colors, showed clues of structural inversion [62], which
104
was partially preserved presumably due to much larger cooling rates. Considering
105
the large influence of the x parameter on the elastic constants, elastic anisotropy,
106
and seismic velocities [19,46,63], the Mg-Si order-disorder process deserves more
107
investigation, which is the focus of this study.
108
In Sp, the size of a cation has a profound influence in determining its site
109
preference, with larger ions to prefer the T-site of the 2-3 Sp, but to prefer the M-site
110
of the 4-2 Sp [59]. With a relatively small size difference between the Mg and Al
111
cations in the MgAl2O4-Sp, the cation disorder achieved at high P-T conditions can
112
be partially preserved [42,45,48,50,51,53]. In contrast, the relatively large size
113
difference between the Mg and Si cations in the Rw may strengthen this
114
size-dependent site preference, and accelerate the cation-redistribution process
115
during cooling, so that the cation disorder attained at high P-T conditions may be
116
easily lost, leading to null signals for cation disorder, as experimentally observed
117
[61,64]. To circumvent this obstacle, we have taken an indirect approach by doping
118
the MgAl2O4-Sp with some Si, and examined if Si can be disordered. It has been
119
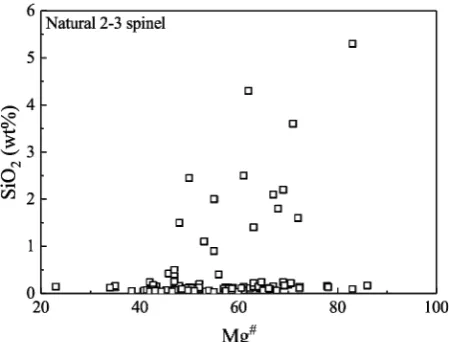
expected that silicon can readily enter the MgAl2O4-Sp, for the SiO2 in natural 2-3 Sp
120
reaches up to ~5.3 wt% (Fig. 1). In this study, we first synthetized the Si-bearing
121
MgAl2O4-Sp at high P. We then analyzed the experimental products by Raman
122
spectroscopy, a powerful method to study cation-disordering [49,57]. To facilitate
data interpretation, natural Si-free MgAl2O4-Sp (N-Sp), natural low quartz (N-Qz),
124
and synthetic Si-free MgAl2O4-Sp, coesite (Coe), stishovite (St) and forsterite (Fo)
125
were similarly analyzed. Here we report the first experimental evidence for the
126
6-coordinated Si in the Sp structure.
127
128
Figure 1. SiO2 (wt%) vs Mg# of some natural 2-3 spinels. Mg#, 100Mg/(Mg+Fe) in
129
molar ratio. Data sources are Sigurdsson et al. [65], Sobolev & Nikogosian [66],
130
Kamenetsky et al. [67], Franz & Wirth [68], and Chistyakova et al. [69].
131
2. Experimental and analytical methods
132
High-P experiments were conducted on a cubic press at the High-Pressure
133
Laboratory of Peking University [70] and a multi-anvil press at the Geophysical
134
Laboratory, Carnegie Institution of Washington [71]. With the experimental
135
charges encapsulated in sealed Pt tubes, a series of Si-bearing MgAl2O4-Sp were
136
synthesized in the system CaO-MgO-Al2O3-SiO2-K2O-CO2 at 3-6 GPa and 1500-1650
137
oC by employing conventional electrical resistance heating technique (Table 1). In
138
addition, we used the high-P experimental techniques to separately synthesize
139
Si-free MgAl2O4-Sp, Coe and St (Table 1). The P and T uncertainties in our high-P
140
experiments should be better than ~0.5 GPa and 50 oC [70-72].
141
Table 1. Experimental conditions, phase assemblages, and compositions of spinels and quartz (wt%) 142
Exp. # Pa Ta ta Phase assemblage MgO Al2O3 SiO2 Total
143
LMD565 3 1500 36 Sp(8)b+Melt 28.66(25)c 70.23(53) 0.39(5) 99.29(72) 144
LMD564 4 1500 36 Sp(8)+Melt 29.26(15) 70.29(18) 0.65(7) 100.22(33) 145
LMD563 4 1550 24 Sp(7)+Melt 28.44(22) 70.92(33) 0.30(7) 99.68(35) 146
LMD558 4 1550 36 Sp(5)+Fo+Melt 29.01(30) 69.98(60) 0.76(3) 99.75(86) 147
LMD578 5 1630 12 Sp(13)+Grt+Melt 28.94(18) 70.22(25) 0.76(7) 99.92(36) 148
LMD568 6 1650 12 Sp(13)+Grt+Melt 29.13(26) 69.27(59) 1.03(7) 99.45(78) 149
LMD659e 5 1500 12 Coe+Melt -- -- -- -- 151
PL1316e 14 1400 8 St -- -- -- -- 152
153
Natural spinel N-Sp(10) 28.05(18) 70.81(22) 0.01(1) 100.03(39) 154
Natural quartz N-Qz(10) 0.00(1) 0.13(9) 100.95(51) 101.17(57) 155
aP, pressure in GPa; T, temperature in oC; t, time in hour. 156
bNumber in the parenthesis after the name of the phase is the number of successful EMP analyses 157
performed on that phase. Sp, spinel; Melt, silicate melt; Fo, forsterite; Grt, garnet; Coe, coesite; St, 158
stishovite; Qz, quartz. 159
cNumber in the parenthesis is the analytical uncertainty reported as one standard deviation. 28.66(25) 160
read as 28.66 ± 0.25. 161
dStarting material is a mixture of dried high purity MgO and Al2O3 powders, weighted out according 162
to the stoichiometry of the MgAl2O4 spinel. 163
eStarting material is a dried high purity SiO2 powder, with some water added later. 164
165
The compositions of the crystalline phases from the high-P experiments were
166
obtained by using a JXA-8100 electron microprobe (EMP) in wavelength dispersive
167
mode (WDS). For all the EMP analyses, the beam current was 10 nA, the
168
accelerating voltage 15 kV, the beam spot size 1 μm, and the counting time 40 s.
169
Calibration was based on optimization to some standards provided by the SPI
170
Corporation (USA), with diopside for Mg and Ca calibrations, jadeite for Si, Al and
171
Na calibrations, chromium oxide for Cr calibration, hematite for Fe, sanidine for K,
172
rutile for Ti, rhodonite for Mn, and nickel silicide for Ni. Data correction was
173
performed with the PRZ method. The results are shown in Table 1 (the CaO and
174
K2O contents below the detection limits).
175
Two natural gem-quality mineral samples were employed in this study as well:
176
one was a red, Si-free Sp crystal (N-Sp) with an octahedral shape from Mogok
177
(Burma), and the other was a clear low Qz crystal (N-Qz) from Donghai (China).
178
Both were similarly analyzed for compositions with the EMP in the WDS mode.
179
Besides the components shown in Table 1, extra components in the N-Sp included
180
0.06(3)% TiO2, 0.95(6)% Cr2O3 and 0.10(1)% FeO, leading to the chemical formula
181
(Mg0.993Fe0.002Ti0.001)(Al1.983Cr0.018)O4 (all iron assumed as Fe2+). Extra components in
182
the N-Qz were below the detection limits.
183
Unpolarized Raman spectra were collected from 100 to 1350 cm-1 with a
184
Renishaw inVia Reflex system in a back-scattering geometry at ambient P-T
185
conditions. A 532 nm laser with an emission power of ~50 mW and a 50×
186
long-distance objective were used in all analyses. Other analytical conditions were
187
~1 μm light spot, 1 cm-1 spectral resolution, and 20 successive scans for every
188
analysis (10 s for each scan). For every high-P product, multiple analyses were
189
conducted on well-polished and arbitrarily-selected Sp, Coe, St and Fo grains with
190
unknown orientations. In comparison, the Raman spectrum of the N-Sp was
collected from the (111) plane whereas that of the N-Qz was from the (001) plane.
192
The Raman data were processed by using the PeakFit V4.12 software (SPSS Inc.).
193
In addition, we analyzed one fragment of the N-Sp for its order-disorder state
194
by single-crystal XRD method. Data were collected using an Agilent Technologies
195
Rigaku micro-focused diffractometer (Mo Kα radiation; λ = 0.71073 nm), and
196
processed using the SHELXT software included in the SHELXTL package. From the
197
single-crystal XRD data we directly obtained an x value of 0.129, probably with
198
relatively large uncertainty due to the similar scattering factors of Mg and Al.
199
Following the method of Carbonin et al. [73], with the bond distances from Lavina
200
et al. [74] and with x = 0.129 as one of the input variables, further, we calculated a
201
new x value, which was in turn used as an input in the next round of crystal
202
structural analysis. The final cycles of the least-squares refinement, including
203
atomic coordinates and anisotropic thermal parameters for the atoms [I > 2sigma(I)],
204
converged at R1 = 0.0164, wR2 = 0.0730 and S = 1.065, and yielded x = 0.162 (see
205
Supplementary Material for the details). Using the empirical equation proposed by
206
Andreozzi & Princivalle [55],
207
x = 21.396 - 80.714u (1),
208
where u is the oxygen positional parameter in the Sp structure (u = 0.26329(24) for
209
our N-Sp), alternatively, we constrained the x value as 0.145. x = 0.145 is preferred
210
in this study.
211
3. Results and discussions
212
3.1 Synthetic MgAl2O4-Sp and its SiO2 213
In total, nine high-P experiments with long durations were conducted (Table 1):
214
six of them for synthesizing Si-bearing MgAl2O4-Sp, one for Si-free MgAl2O4-Sp,
215
one for Coe, and one for St. In the synthesizing experiments for the Si-bearing
216
MgAl2O4-Sp, a CO2-rich melt phase with intense quench-modification texture was
217
always observed. Some other crystalline phases like Fo and garnet (Grt) were
218
occasionally detected. The crystalline phases in all these experiments had large
219
grain sizes up to ~600 μm, showed sharp grain boundaries and attained
220
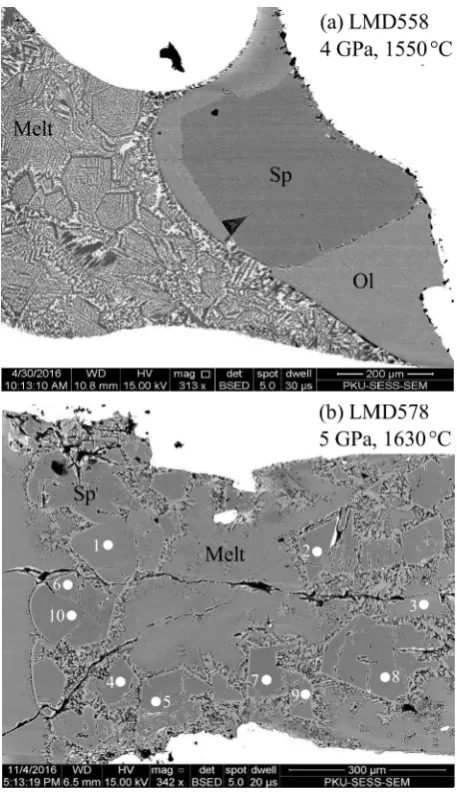
homogeneous chemical compositions. Typical electron back-scatter images from
221
some of these experiments are shown in Fig. 2. In the experiments for the Si-free
222
MgAl2O4-Sp, Coe and St, a melt phase was clearly observed in LMD659 only (Table
223
1). The grain boundaries of the Si-free MgAl2O4-Sp, Coe and St were well defined,
224
their grain sizes large (up to ~100 μm in diameter), and their compositions expected
225
to be homogeneous.
227
Figure 2. Typical electron back-scatter images: (a) LMD558 at 4 GPa and 1550 oC; (b)
228
LMD578 at 5 GPa and 1630 oC. On the exposed sample surface of LMD558, we
229
observed just one large Sp grain, surrounded by olivine compositionally
230
approximating Fo (Mg2.034(30)Ca0.004(0)Si0.973(15)Al0.011(1)O4; five EMP analyses). In contrast,
231
many Sp grains were found on the exposed sample surface of LMD578, coexisting
232
with Grt grains (not shown in (b); Mg2.765(66)Ca0.294(67)Al1.968(18)Si2.995(11)O12, based on 10
233
EMP analyses). The white spots numbered from 1 to 10 in (b) represent the
234
positions, where the Raman spectra shown in Fig. 7b were taken.
235 236
With up to ~1 wt% SiO2 (Table 1), the compositions of the Si-bearing
237
MgAl2O4-Sp are shown in Fig. 3. A primary observation here is that one Si4+ and one
238
Mg2+ substitute for two Al3+,
239
Si4+ + Mg2+ = 2Al3+ (2).
240
In detail, the (Sipfu) values seem slightly lower than the (Mgpfu-1) values, which
241
perhaps relates to the compositional characteristics of the coexisting phase(s).
242
Nevertheless, the effects of P, T and coexisting phases on this cation substitution
243
reaction are not clear, but presently under a thorough experimental investigation.
The cation radii of Mg (rMg), Al (rAl) and Si (rSi) are very different, rMg = 0.585 Å > rAl =
245
0.39 Å > rSi = 0.275 Å on the T-site and rMg = 0.715 Å > rAl = 0.53 Å > rSi = 0.40 Å on the
246
M-site at ambient conditions [59]. Since larger ions prefer the T-site of the 2-3 Sp, the
247
Si-free MgAl2O4-Sp should generally adopt a normal Sp structure, as verified by
248
some studies on natural Sp with compositions close to the MgAl2O4 formula (x =
249
~0.02-0.04 in Schmocker & Waldner [47]; x = 0.05 in Maekawa et al. [51]). By the
250
same token, Si in the MgAl2O4-Sp should occupy the M-site. However, existing
251
single-crystal XRD studies on natural 2-3 Sp locate Si on the T-site [73,75-77]. The
252
coupled substitution of Si and Mg for 2Al as observed in our high-P synthetic
253
MgAl2O4-Sp and the site-occupation knowledge to be revealed by our Raman
254
spectroscopic data should shed light on the Si distribution.
255
256
Figure 3. Sipfu and Mgpfu-1 vs (2-Alpfu)/2 of synthetic spinels from our high-P
257
experiments. pfu stands for per formula unit.
258 259
3.2 Raman features of nearly normal MgAl2O4-Sp 260
There are two chemical formula units per primitive unit cell of normal
261
MgAl2O4-Sp (14 atoms), which leads to three acoustic modes and 39 optic modes
262
according to group theory. Five Raman-active fundamental vibrations, A1g + Eg +
263
3T2g, are predicted [78]. Theoretical calculations yield the A1g at ~762 cm-1, Eg at ~408
264
cm-1, and T2g at ~667 cm-1 (T2g(2)), ~557 cm-1 (T2g(3)) and ~317 cm-1 (T2g(1); [79-85]). The
265
intensity of these Raman modes decreases in the order of Eg > T2g(2) > A1g > T2g(1) > T2g(3)
266
[83]. Except the weakest T2g(3) peak, all other four peaks were routinely observed on
267
natural MgAl2O4-Sp with very low and insignificant amounts of impurities like SiO2,
268
TiO2, Cr2O3, FeO and/or ZnO [49,57,78,86,87].
269
Our N-Sp displays four sharp peaks at ~312, 407, 664 and 766 cm-1, compatible
270
with the Raman features established for normal MgAl2O4-Sp (Fig. 4). Furthermore,
271
two weak and broad peaks are observed at ~222 and 715 cm-1, which are attributable
272
to the slightly-disordered structural feature (x = 0.145). The small peak at ~715 cm-1
273
was also evident in the Raman spectra of the natural MgAl2O4-Sp studied by
274
Chopelas & Hofmeister [78] and by Cynn et al. [86]. Both samples attained some
structural disorder: using Equation (1), the x value of the former sample is
276
calculated as ~0.144 (u = 0.2633); the x value of the latter sample was claimed as
277
~0.02, which might have been slightly underestimated (more discussion later). On
278
the other hand, it was not observed for the natural MgAl2O4-Sp studied by Cynn et
279
al. [49], Van Minh & Yang [87] or Slotznick & Shim [57], implying x values at least
280
smaller than ~0.145. No Raman spectra previously collected on unannealed natural
281
MgAl2O4-Sp showed the weak peak at ~222 cm-1. The sample studied by Chopelas &
282
Hofmeister [78] had an x value much comparable to our N-Sp, so that a weak peak
283
at ~222 cm-1 should be expected. Chopelas & Hofmeister [78], however, did not
284
report any Raman data below ~250 cm-1.
285
286
Figure 4. Raman features of Si-free N-Sp, and synthetic Si-free MgAl2O4-Sp from
287
LMD487.
288 289
In-situ high-T Raman spectroscopic investigations on natural MgAl2O4-Sp were
290
conducted by Cynn et al. [49,86], Van Minh & Yang [87], and Slotznick & Shim [57].
291
The weak peak at ~715 cm-1 evidently emerged or intensified at high T, and
292
persisted to ambient T after cooling, so that it could be confidently attributed to the
293
high-T structural disorder process. Theoretical investigations have confirmed this
294
attribution [81,83]. In comparison, the even weaker Raman peak at ~222 cm-1 was
295
detected at high T by Slotznick & Shim [57] only, and similarly attributed to the
296
high-T structural disorder process. Additionally, it was observed by Cynn et al. [86]
297
on the natural MgAl2O4-Sp after rather than before their high-T Raman
298
spectroscopic experiments.
299
The two Raman peaks at ~222 and 715 cm-1 directly observed on our N-Sp (x =
300
~0.145) may provide a convenient and inexpensive method to quantify the disorder
301
extent of natural 2-3 Sp. Recording rich genetic conditions such as chemical
302
environment, geological setting, and cooling history [77,88], natural 2-3 Sp
303
commonly have x values ranging from 0 to ~0.23 ([89]; and references therein). The
304
x parameters are usually constrained by applying single-crystal XRD method,
305
powder neutron diffraction or nuclear magnetic resonance spectroscopy, which is
306
often instrumentally unavailable, technically challenging, requires large quantity of
homogeneous sample, and/or costs too much in terms of funds and time. Raman
308
spectroscopy is however right to the opposite. The Raman feature at ~715 cm-1 has
309
high intensity, and is well separated from the A1g band at ~766 cm-1, so that it can be
310
readily used to estimate the disorder extent (Fig. 4). With fixed analytical conditions
311
in the Raman spectroscopic experiments, the intensity ratio of these two peaks
312
should reflect the inversion extent according to the following equation [86]:
313
x = 1/[1 + c(I715/I766)] (3),
314
where c is an unknown coefficient presumably dependent to the analytical setups,
315
and I represents either the peak height or integrated area. With the peak height data
316
(or integrated area data) of our N-Sp, I715 = 1672(437) and I766 = 30257(548) cps (or I715
317
= 22995(5993) and I766 = 664010(7038) cps cm-1), c is estimated as 0.33(9) (or 0.20(6)).
318
Applying this value to the Raman data of the unannealed natural MgAl2O4-Sp of
319
Cynn et al. [86] leads to an x value of ~0.06 (or 0.09). Cynn et al. [86] obtained x =
320
0.02 by assuming c = 1. We prefer the larger x value, simply because a disorder
321
extent of 0.02 in the MgAl2O4-Sp structure may not be high enough to bring forth
322
the Raman peak at ~715 cm-1.
323
3.3 Mg-Al order-disorder state of synthetic MgAl2O4-Sp 324
The Mg-Al order-disorder states of our synthetic MgAl2O4-Sp can be estimated
325
using the results from the in-situ observations at high P-T conditions made by
326
Méducin et al. [45], as shown in Fig. 5.
327
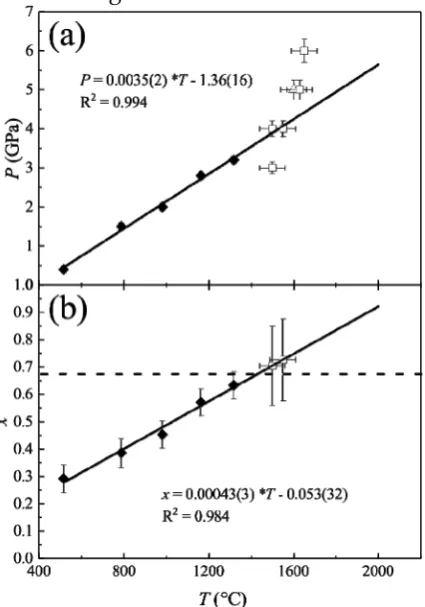
328
Figure 5. (a) Comparison of P-T conditions of our high-P Sp-synthesizing
329
experiments and those of the heating-up experiments closely approaching Mg-Al
redistribution equilibrium at T≥ 500 oC from Méducin et al. [45]. The P and T values
331
of the five experiments from Méducin et al. [45] were highly correlated, as shown
332
by the solid line P = 0.0035(2)*T - 1.36(16). (b) x-T relation of those five experiments
333
from Méducin et al. [45], as shown by the solid line x = 0.00043(3)*T - 0.053(32).
334
Filled diamonds are for the five experiments from Méducin et al. [45], whereas
335
empty triangle is for our experiment synthesizing Si-free MgAl2O4-Sp and empty
336
squares are for our experiments synthesizing Si-bearing MgAl2O4-Sp. The broken
337
line in (b) is shown for a hypothetic fully-disordered MgAl2O4-Sp with x = 0.667.
338 339
There has been excellent agreement on the T effect on the Mg-Al disorder
340
process of the MgAl2O4-Sp at ambient P: x increases as T increases
341
[42,47,48,50,51,53-57]. As to the P effect at ambient T, discrepancy exists presumably
342
because the order-disorder reaction could not be readily activated and adequately
343
approach its equilibrium during the course of a conventional high-P study
344
[52,90,91]. Thanks to Méducin et al. [45] who conducted an investigation at
345
simultaneously high-P and high-T conditions (up to 3.2 GPa and 1318 oC), the P
346
effect at relatively high T has been well established: x increases as P increases. It is
347
thus clear that our synthetic MgAl2O4-Sp formed at high P-T conditions should
348
attain large degrees of cation disorder, which should be well preserved due to the
349
quick quench process in the cubic press experiments (T decreased to < 600 oC in ~20
350
seconds).
351
Claimed by Méducin et al. [45], the heating-up experiments at T≥ 500 oC closely
352
reached their cation order-disorder equilibrium, with the P almost linearly
353
correlating with the T (Fig. 5a). Since both P and T promote Mg-Al disorder at
354
simultaneously high-P and high-T conditions, the effects of P and T can be lumped
355
together and adequately accounted for by using just one independent variable.
356
Here we have chosen T (Fig. 5b). Coincidently, our synthesizing experiments at 4
357
GPa and 1500 to 1550 oC (Table 1) plot rather near the P-T locus defined by those
358
heating-up experiments at T≥ 500 oC (Fig. 5a), suggesting that, with a short-distance
359
extrapolation, the x values of the MgAl2O4-Sp from our experiments at 4 GPa can be
360
accurately estimated. Using the equation shown in Fig. 5b, the derived x values are
361
from 0.70(15) to 0.73(15), so that the true x values should be close to 0.667 (random
362
Mg-Al distribution). In addition, the x values of our synthetic MgAl2O4-Sp at 5 and
363
6 GPa should also be ~0.667 due to the even higher experimental P and T (Fig. 5a).
364
Furthermore, the x values obtained for the P-T conditions of 2.8 GPa and 1163 oC,
365
and 3.2 GPa and 1318 oC by Méducin et al. (2004) were 0.571(49) and 0.633(50),
366
respectively, implying that the x of our MgAl2O4-Sp at a similar P of 3 GPa but a
367
much higher T of 1500 oC (LMD565; Table 1) should be close to 0.667 as well.
368
Assuming no effect of the additional Si with abundances ≤ ~0.025 pfu (Fig. 3),
369
we conclude that our synthetic MgAl2O4-Sp should achieve a nearly random Mg-Al
370
distribution.
3.4 Raman features of fully-disordered MgAl2O4-Sp 374
The Raman spectrum of our synthetic Si-free MgAl2O4-Sp (LMD487) is
375
compared to that of our N-Sp in Fig. 4. It similarly shows six peaks at slightly
376
different energies, with all peaks being significantly broadened though. Compatible
377
with the observations made by Cynn et al. [49,86] and Slotznick & Shim [57], the A1g,
378
Eg and T2g(1) modes shift slightly to lower wavenumbers whereas the T2g(2) mode
379
shifts slightly to higher wavenumbers, as x increases from ~0.145 to 0.667. In
380
addition, the Eg band becomes not only very broad, but highly asymmetric as well,
381
indicating a possible hiding Raman peak. According to Caracas & Banigan [84], a
382
very intense Raman feature should occur at the lower wavenumber side of the Eg
383
peak when the MgAl2O4-Sp disorders. Moreover, the two weak, broad, and Mg-Al
384
disorder-related peaks at ~715 and 222 cm-1 become much more distinct in the
385
Raman spectrum of the synthetic Si-free MgAl2O4-Sp. All these are diagnostic
386
features for a high degree of Mg-Al disorder.
387
With Equation (3) and adopting x = 0.667, the peak height data (or integrated
388
area data) of our synthetic Si-free MgAl2O4-Sp, I723 = 7148(215) and I765 = 10986(228)
389
cps (or I723 = 181810(5451) and I765 = 240020(6329) cps cm-1), lead to a c value as 0.32(2)
390
(or 0.38(2)), which is again much smaller than the assumed value of 1 in Cynn et al.
391
[86]. Combining this result with that determined by the Raman data of our N-Sp,
392
0.33(9) or 0.20(6), the c coefficient appears generally constant for a large range of x,
393
supporting the constant c assumption made by Cynn et al. [86]. To confirm this,
394
more investigation on the MgAl2O4-Sp with different disorder extents using jointed
395
experimental methods to simultaneously obtain Raman spectroscopic data,
396
chemical compositional data and crystal structural data like what we have done in
397
this study is highly desirable.
398
3.5 Raman features of Si-bearing fully-disordered MgAl2O4-Sp 399
The octahedra in the Sp structure share six edges with six neighboring
400
octahedra, resulting in an extensively edge-linked structure in three dimensions
401
[92]. In comparison, the tetrahedra are fully isolated to each other, with their four
402
oxygen atoms linking to four neighboring octahedra. If Si occupied the M-site of the
403
MgAl2O4-Sp, its Raman signals would be much analogous to those of St, which
404
similarly places Si in edge-shared octahedra [93]. If Si occupied the T-site,
405
alternatively, its Raman signals would resemble those of Fo because Si in Fo also
406
adopts isolated T-site and forms separate SiO4 group, with the oxygen atoms shared
407
by neighboring octahedral [94]. On the other hand, Si atoms in low Qz [95] and Coe
408
[96] are 4-coordinated, but the SiO4 tetrahedra are fully polymerized into a
409
three-dimensional framework, so that the Raman features of low Qz and Coe
410
should be very different to those of potential SiO4 groups in the Sp structure.
411
Apart from those six bands previously described, the Si-bearing MgAl2O4-Sp
412
shows a new set of well-defined Raman bands at ~610, 823, 856 and 968 cm-1 (Fig. 6).
413
These peaks are distinctly different to the Raman features of St, Coe and N-Qz, but
414
highly resemble those of Fo. Furthermore, a less well-defined peak with low
intensity occasionally appears at ~920 cm-1, and perfectly matches the relatively
416
weak 920 cm-1 Raman peak of Fo (Fig. 6). Accordingly, we tend to attribute these
417
five peaks to potential separate SiO4 groups in our Si-bearing, fully Mg-Al
418
disordered MgAl2O4-Sp, and assign the peaks at ~968, 920 and 856 cm-1 to the
419
asymmetric stretching of the SiO4 groups, the peak at ~823 cm-1 to the symmetric
420
stretching, and the peak at ~610 cm-1 to the bending. It follows that at least some Si
421
atoms adopt the T-site.
422
423
Figure 6. Raman features of synthetic Si-bearing MgAl2O4-Sp from our high-P
424
experiments. As comparisons, Raman spectra of N-Qz, synthetic Coe, St and Fo
(LMD558; Table 1) are shown as well. For the purpose of illustration, some portions
426
of the Raman spectra of St, Coe and N-Qz have been expanded and shown as insets
427
whereas the entire Raman spectrum of Fo has been compressed by a factor of 60.
428
LMD563(0.30), Exp. # followed by the SiO2 content of the Sp. To illustrate clearly,
429
only one Raman spectrum is shown for each synthetic phase, although multiple
430
Raman spectra have been collected.
431 432
Furthermore, two weak and diffusive Raman peaks have been occasionally
433
observed at ~560 and 1010 cm-1 for our Si-bearing MgAl2O4-Sp (Fig. 6), with the
434
former attributable to the usually-undetected fifth fundamental Raman band of the
435
MgAl2O4-Sp (T2g(3)) and the latter likely featured as a combination band/overtone.
436
The intensities of the Raman peaks attributable to the SiO4 groups show
437
interesting behavior. Considering the very low SiO2 contents in the MgAl2O4-Sp
438
from LMD563 and LMD565 (0.30(7) wt% and 0.39(5) wt%, respectively; Table 1), the
439
low intensities of the new Raman peaks at ~610, 823, 856 and 968 cm-1 can be readily
440
explained by the small amounts of the SiO4 group (Fig. 6). As the SiO2 contents
441
increase, one would anticipate these peaks to grow if some of the added Si entered
442
the T-site. Surprisingly, the Raman spectra of our MgAl2O4-Sp with higher SiO2
443
contents, from 0.65(7) to 1.03(7) wt%, show distinctly divergent behaviors (Fig. 6),
444
with the new Raman peaks at ~610, 823, 856 and 968 cm-1 intensifying for the
445
MgAl2O4-Sp synthesized at relatively low P-T conditions (4 GPa and 1500 oC for
446
LMD564, and 4 GPa and 1550 oC for LMD558; Table 1) but increasing little for the
447
MgAl2O4-Sp synthesized at relatively high P-T conditions (5 GPa and 1630 oC for
448
LMD578, and 6 GPa and 1650 oC for LMD568). Evidently, some of the Si atoms
449
added into the MgAl2O4-Sp did take the T-site at relatively low P-T conditions, but
450
most them did not at relatively high P-T conditions. It follows that some Si atoms in
451
the MgAl2O4-Sp from LMD578 and LMD568 must have adopted the M-site and
452
formed SiO6 groups (Fig. 6).
453
The SiO6 groups seem Raman-inactive. With similar amounts of SiO2, the
454
MgAl2O4-Sp from LMD558 shows much stronger Raman peaks for its SiO4 groups
455
than that from LMD578 (Fig. 7), suggesting that the former generally contains more
456
SiO4 groups, but the latter contains more SiO6 groups. In both cases, no new Raman
457
peaks can be confidently identified, implying that the SiO6 groups in the
458
MgAl2O4-Sp are by and large Raman-inactive. Different crystallographic
459
orientations unlikely affect this conclusion. As shown in Fig. 7a, the two sets of
460
unpolarized Raman spectra for the MgAl2O4-Sp in LMD558 (Set A and Set B), taken
461
from the only crystal shown in Fig. 2a but with crystallographic orientations
462
normal to each other, do display some variations in the intensities of the Raman
463
peaks for the SiO4 groups, but overall exhibit very similar patterns. Furthermore,
464
the 10 unpolarized Raman spectra taken from 10 randomly-selected MgAl2O4-Sp
465
grains in LMD578 do not show much variation in their overall appearance as well
466
(Fig. 7b).
468
Figure 7. Raman spectra of MgAl2O4-Sp with almost identical amounts of SiO2 from
469
LMD558 (a) and LMD578 (b). The two sets of Raman spectra (A1, A2, A3 and A4 as
470
Set A, and B1, B2, B3 and B4 as Set B) shown in (a) were collected from the only Sp
471
grain shown in Fig. 2a, but with their orientations normal to each other. After
472
obtaining the Raman spectra of Set A, we reprocessed the sample to make a new
473
exposure normal to the previous one and then collected the Raman spectra of Set B.
474
Ten Raman spectra shown in (b) were acquired from ten different Sp grains (see Fig.
475
2b for the positions). Due to data compression, the weak Raman peaks for the SiO4
476
groups of the MgAl2O4-Sp from LMD578, visible in Fig. 6, are now barely
477
discernable in (b).
478 479
3.6 Si-disordering in fully-disordered MgAl2O4-Sp 480
In the MgAl2O4-Sp with SiO2 contents as low as ~0.65-0.76 wt%, the Raman
481
peaks for the minor SiO4 groups can be as intense as those for the major (Mg,Al)O4
482
groups (Fig. 6 and Fig. 7a), so that the relationships among the Raman intensity,
483
SiO2 content, Si disorder state and P-T condition are worth of further exploration.
484
We can write the formula [4](Mg0.333Al0.667)[6](Al1.333Mg0.667)O4 for a Si-free Mg-Al
485
fully-disordered MgAl2O4-Sp (x = 0.667). Ignoring the effect of small amounts of Si,
486
one obtains [4](Mg0.333Al0.667Siy)[6](Al1.333Mg0.667Siz)O4 for the Si-containing Mg-Al
487
fully-disordered MgAl2O4-Sp. The Si disorder state is then defined as y = [Siy]/([Siy]
488
+ [Siz]) = [Siy]/[Sitotal], with y = 1 indicating all Si on the T-site, y = 0 all Si on the
489
M-site, and y = 0.333 a Si random distribution. Under certain analytical conditions
in the Raman spectroscopic experiments, the intensity of a Raman peak caused by
491
one type of structural unit i (SiO4 here) is proportional to its abundance ([i]; [Siy]
492
here), Ii = ci × [i] ([86]; ci is a constant), leading to
493
ISiO4 =cSiO4×[Siy]=cSiO4×y×([Siy]+[Siz]) (4),
494
where [Siy] + [Siz] = Sitotal = 0.0237 × SiO2 wt% for the cases with small amounts of
495
SiO2. With the SiO4 groups represented by the Raman peaks at ~823 and 856 cm-1
496
and the (Mg,Al)O4 groups by those at ~725 and 766 cm-1, we obtain
497
ISiO
4
I(Mg,Al)O
4
= I823+I856 I725+I766 =
cSiO
4×y×0.0237×SiO2wt%
I725+I766 (5). 498
The term cSiO4×0.0237
I725+I766 is essentially a constant (C), so that Equation (5) can be 499
briefed as
500
I823+I856
I725+I766 =C×y×SiO2wt% (6). 501
Evidently, the variable I823+I856
I725+I766 of the Mg-Al fully-disordered MgAl2O4-Sp with 502
certain y should be linearly correlated with the SiO2, and the curve should pass
503
through the origin (the case of zero SiO2).
504
Without knowing the y value, it is impossible to obtain the value of the
505
constant C, which in turn impairs the application of Equation (6). Nevertheless, for
506
the two extreme cases with all Si entering the T-site (y = 1) and Si attaining a full
507
disorder distribution (y = 0.333), the ratio of the two slopes (C and 0.333C,
508
respectively) should be 3, which in fact represents the maximum ratio of any two
509
slopes.
510
Our experimental data are summarized in Table 2, and shown in Fig. 8. Both
511
LMD563 and LMD558 ran at 4 GPa and 1550 oC, so that they formed a special
512
group (Group 2) acquiring similar Si order-disorder states (identical y values).
513
These two experimental data, plus the zero SiO2 case, then define a curve for this
514
particular y, with its slope as S2 = 0.703(248). The uncertainty of the slope is
515
somehow large, reflecting the limited accuracy of the data.
517
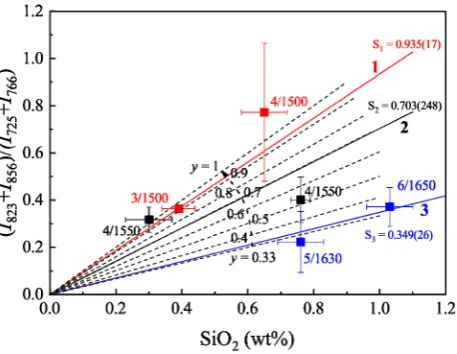
Figure 8. I823+I856
I725+I766 vs SiO2 content of our synthetic Si-bearing MgAl2O4-Sp. Note 518
that the analytical conditions in the Raman spectroscopic experiments were
519
identical, and all the MgAl2O4-Sp generally had the maximum amount of Mg-Al
520
disorder (x = 0.667). The experimental P-T conditions are indicated along the
521
symbols; 4/1500, for example, should be read as 4 GPa and 1500 oC. The experiments
522
have been divided into three groups, with Group 1 containing LMD565 and
523
LMD564 (red squares), Group 2 containing LMD563 and LMD558 (black squares),
524
and Group 3 containing LMD578 and LMD568 (blue squares). Aided with the
525
origin (the zero SiO2 case), the experiments in each group have been used to
526
determine the relationship between the I823+I856
I725+I766 and SiO2 content. Using C = 527
1.02(14), Equation (6) is shown as the pencil of broken lines radiating from the
528
origin, with different y values ranging from 0.33 to 1.
529 530
Table 2. Ratio ofintegrated area of the Raman peaks at ~823 and 856 cm-1 for the SiO4 group to those 531
at ~725 and 766 cm-1 for the (Mg,Al)O4 group 532
Exp. # P/T/SiO2a #b (I823+I856)/(I725+I766) 533
LMD565 3/1500/0.39(5)c 3 0.36(1) 534
LMD564 4/1500/0.65(7) 3 0.77(29) 535
LMD563 4/1550/0.30(7) 3 0.32(5) 536
LMD558 4/1550/0.76(3) 8 0.40(10) 537
LMD578d 5/1630/0.76(7) 4 0.22(13) 538
LMD568 6/1650/1.03(7) 3 0.37(8) 539
aP, GPa; T, oC; SiO2, SiO2 content (wt%) in our synthetic Sp. 540
bNumber of Raman spectra collected. 541
deviation; 0.39(5) read as 0.39 ± 0.05. 543
dTen Raman spectra were collected (Fig. 7a), but only four of 544
them were used here. Since the Raman spectra were 545
numerically dominated by those without visible peaks for 546
the SiO4 groups, we selected four Raman spectra, with the 547
SiO4 Raman peaks ranging from the lowest to the highest, to 548
derive our result in order to avoid possible data bias. Of 549
course, this procedure might have led to new data bias. 550
The curve constrained by the experiments of Group 2 divides the rest four
551
experiments into two groups, with one group including LMD565 and LMD564
552
conducted at relatively low P-T conditions (Group 1 with larger y) whereas the
553
other group including LMD578 and LMD568 conducted at relatively high P-T
554
conditions (Group 3 with smaller y). Due to the good linear relations (Fig. 8), we
555
have attempted weighted linear least-squares fit and obtained S1 = 0.935(17) for the
556
experiments of Group 1 and S3 = 0.349(26) for the experiments of Group 3. The
557
assumption behind this practice is that the y values of the MgAl2O4-Sp from the
558
experiments in either Group 1 or Group 3 are constant. Whether this assumption is
559
justified or not is unimportant, since one can always draw a line through the origin
560
and one single experimental data, and subsequently define a slope for that
561
particular case. The key observation here is that the ratio between S1 and S3 is
562
2.68(21), a value close to 3. This means that the curve defined by the experiments of
563
Group 1 generally approximates the case of all Si residing on the T-site (y = 1), and
564
the curve defined by the experiments of Group 3 closely approaches the case of a
565
fully random Si distribution (y = 0.333). It thus follows that with small variations of
566
P and T, from 3-4 GPa to 5-6 GPa, and from 1500 to 1630-1650 oC, Si in the Mg-Al
567
fully-disordered MgAl2O4-Sp drastically changes from a fully-ordered distribution
568
on the T-site to a completely random distribution.
569
With the y values for the Mg-Al fully-disordered MgAl2O4-Sp from LMD565,
570
LMD564, LMD578 and LMD568, we have calculated the constant C, and obtained
571
0.93(15), 1.19(58), 0.88(59) and 1.08(31), respectively. Indeed, the constant C is
572
constant, averagely 1.02(14), which then allows us to add into Fig. 8 a set of curves
573
with fixed y values to show the relationship between the I823+I856
I725+I766 and SiO2. 574
Some interesting points emerge from Fig. 8. Firstly, the Raman peaks of the
575
minor SiO4 group are very prominent, compared to those of the major (Mg,Al)O4
576
group. For ~1.1 wt% SiO2 fully-ordered on the T-site (y = 1), for example, the
577
Raman peaks at ~823 and 856 cm-1 are generally as intense as the Raman peeks at
578
~725 and 766 cm-1. Secondly, the behavior of the Raman peaks of the SiO4 group
579
strongly correlates with the SiO2 content, relatively weak and changing little for the
580
SiO2-poor MgAl2O4-Sp but strong and varying significantly for the SiO2-rich
581
MgAl2O4-Sp. Thirdly, the Si-disordering process is independent to the SiO2 content,
582
but controlled by the formation P and T of the MgAl2O4-Sp. With the P-T
583
conditions change from ~3-4 GPa and 1500 oC to ~5-6 GPa and 1630-1650 oC, the Si
cations radically change from fully ordering on the T-site (y = 1) to randomly
585
distributing between the T-site and M-site (y = 0.333). For the MgAl2O4-Sp with
586
similar SiO2 contents, finally, the ones displaying relatively strong Raman peaks at
587
~823 and 856 cm-1 should have formed in a relatively low P-T environment, and
588
vice versa.
589
4. Implications
590
Electrostatic lattice energy calculations and consideration of the structure of the
591
Sp group of minerals suggest that the larger Mg cations prefer the T-site and the
592
smaller Al cations prefer the M-site, resulting in a generally normal MgAl2O4-Sp at
593
ambient P and T [59]. This principle seems inapplicable to the minor components.
594
The present study indicates that at P-T conditions ≤ ~3-4 GPa and 1500 oC, covering
595
the P-T range of the top upper mantle of the Earth [97], the even smaller Si cations
596
incorporated by the MgAl2O4-Sp structure appear on the T-site, rather than on the
597
anticipated M-site (y = 1; Fig. 8). This result is compatible with existing
598
single-crystal XRD studies on terrestrial Sp, which locate Si on the T-site
599
[73,75-77,98]. The current study further shows that presenting as SiO4 groups in the
600
Sp, a small amount of SiO2 like ~1 wt% exhibits very intense Raman peaks at ~823
601
and 856 cm-1, and can completely alter the stereotypical overall appearance of the
602
Raman spectra established with some SiO2-poor natural 2-3 Sp. Since Si readily
603
enters the 2-3 Sp structure, this result should have important application in
604
identifying the Sp phase, particularly for the circumstances where direct
605
petrographic observation cannot be made. A Raman spectrometer will be launched
606
shortly as part of the ExoMars analytical laboratory and deployed on the Martian
607
surface to investigate the mineralogical and biological aspects of the Mars [99,100].
608
Considering the wide spreading of the 2-3 Sp on the Earth, the Moon, and the
609
extraterrestrial planets, asteroids and meteorites, it will have high chance to
610
encounter some Sp and collect in-situ Raman spectra. A correct interpretation of
611
these Raman spectra must critically evaluate the effect of Si.
612
Si starts to enter the M-site of the MgAl2O4-Sp at P-T conditions ≥ ~3-4 GPa and
613
1500 oC, and become fully disordered at P-T conditions ≥ ~5-6 GPa and 1630-1650
614
oC (Fig. 8). However, the 6-coordinated Si may not be easily observed in natural
615
MgAl2O4-Sp. High-P experimental studies have showed that Al-rich 2-3 Sp is not a
616
stable phase for the upper mantle at P > ~3 GPa [101]. On the other hand, adding
617
Cr may stabilize the 2-3 Sp to much higher P [4], and encapsulating the 2-3 Sp in
618
diamonds may lead to the same result [102]. The Cr-rich 2-3 Sp inclusions in
619
diamonds are thus the best targets to look for the 6-coordinated Si.
620
The almost random Si distribution observed for our Si-bearing MgAl2O4-Sp at
621
P-T conditions ≥ ~5-6 GPa and 1630-1650 oC strongly hints that at some high P-T
622
conditions the Si cations in the (Mg,Fe)2SiO4-Sp (Rw) might be disordered to large
623
extents. Mg2SiO4-Rw has been conventionally regarded as a normal 4-2 spinel with
624
nearly all Si taking the T-site. The single-crystal XRD data of Sasaki et al. [64] and
625
high-resolution 29Si NMR data of Stebbins et al. [61] did not show any convincing
evidence for 6-coordinated Si. In contrast, ~4% Si was inferred to appear on the
627
M-site, based on the systematic deviations of the Si-O bond length determined by
628
new single-crystal XRD data from an average value in silicates [60]. Consideration
629
of the bond length systematics and experimentally-measured cation distributions
630
led to a similar conclusion [59]. However, all these conclusions were drawn from
631
the experimental data collected on quenched samples or based on some crystal
632
structural features established for ambient P. In the former cases, the cation
633
disorder information of the Rw at high P might be completely lost. In analogy to the
634
well-known partial preservation of the high-T equilibrium state of the Al-Mg
635
disorder in the MgAl2O4-Sp after quenching [42,53], reordering the Si and Mg
636
cations in the Mg2SiO4-Sp presumably happens fast and proceeds towards its
637
completion as the high-P synthesizing experiment quenches. In the latter cases, the
638
bond length systematics and structural features established for ambient P might not
639
be applicable to the high-P structures. As pointed out by Méducin et al. [45], P has a
640
significant impact on the order-disorder process of the MgAl2O4-Sp, especially in
641
the T range of 477-1227 oC. Some high-P single-crystal XRD investigations have
642
been conducted up to ~28.9 GPa at ambient T, but could not shed light on the Si
643
disorder issue, partially due to the low experimental T potentially unable to trigger
644
the order-disorder reaction, and partially due to the low data resolution caused by
645
the similar X-ray scattering factors of Mg and Si [103,104].
646
The most likely evidences in the literature to the presence of 6-coordinated Si in
647
the Rw came from a high-P Raman spectroscopic investigation on synthetic
648
Mg2SiO4-Rw [105] and a spectroscopic study on some meteoritic Rw [62]. At P > ~30
649
GPa, a weak and diffusive Raman peak appeared and was interpreted as the
650
signature for the presence of Si-O-Si linkages and/or partial increase in the
651
coordination of Si [105]. We propose that this peak might belong to the MgO4
652
groups in the Mg2SiO4-Rw, which would in turn indicate the presence of the SiO6
653
groups resulted from the position exchange of the Si and Mg cations. According to
654
Chopelas et al. [106], the MgO6 groups in the normal Mg2SiO4-Rw are Raman-silent,
655
and the SiO4 groups are responsible for all the Raman peaks. Since the
656
order-disorder process in the Sp is non-convergent (i.e., the symmetry of the Sp is
657
maintained at any inversion), no new Raman peaks should be expected from the
658
SiO6 groups in the disordered Mg2SiO4-Rw, exactly like what we have observed for
659
the Si-bearing MgAl2O4-Sp (Figs. 6, 7). On the line of the study about the meteoritic
660
Rw, Taran et al. [62] used a range of analytical methods including optical
661
absorption spectroscopy to investigate some synthetic (Mg,Fe)2SiO4-Rw, and two
662
compositionally homogenous but doubly-colored meteoritic Rw grains (Grain 1,
663
one part being colorless and the other part blue; Grain 2, one part being blue and
664
the other part dark blue) from two L6-type ordinary chondrites NWA 1662 and
665
NWA 463. They proposed that for the meteoritic Rw, the part with no color was
666
inverse Rw, other parts with various colors were Rw with different amounts of
667
cation inversion. In order to confirm their hypothesis, more investigation should be
668
conducted on the meteoritic Rw, which represent the best natural specimen to
669
study high-P structural features including the Mg-Si order-disorder state due to
much larger quench rates. Rw with various colors have been documented in many
671
meteorites such as the L ordinary chondrites [107-111], LL ordinary chondrites
672
[14,26], and Martian meteorites like the shergottites [32,34,37]. If the relationship
673
among the color, composition, inverse magnitude, P and T can be adequately
674
quantified, a fine scale for accurately estimating the shock P-T conditions may be
675
derived, which may serve well the theoretical evolution models of the early solar
676
system.
677
If the Rw in the LP-MTZ attained substantially higher degrees of inverse than
678
those experimentally observed so far, the mineralogical model of the upper mantle
679
and the nature of the 520-km and 620-km seismic discontinuities would need
680
further careful examination. Some empirical and theoretical studies have
681
demonstrated that the cation disorder process in the Rw leads to significantly larger
682
thermal expansion coefficients, smaller bulk modulus, and smaller shear modulus
683
[19,44,46,63]. As a result, a 12.5% Si-Mg disorder can decrease the seismic velocities
684
by ~3-5% [19,46]. Direct experimental investigations on the cation inversion of the
685
Rw at the P-T conditions of the LP-MTZ are therefore of high priority.
686
Acknowledgements: This study was financially supported by the Strategic Priority
687
Research Program (B) of Chinese Academy of Sciences (Grant No. XDB18000000),
688
by the DREAM project of MOST, China (Grant No. 2016YFC0600408), and by the
689
Program of the Data Integration and Standardization in the Geological Science and
690
Technology from MOST, China (Grant No. 2013FY1109000-3).
691
Author Contributions: Xi Liu (designing the project). Liping Liu (writing the initial
692
draft of the work). Xi Liu (writing the final paper). Xi Liu, Liping Liu and Xinjian
693
Bao (interpreting the results). Liping Liu, Qiang He and Renbiao Tao (conducting
694
high-P experiments). Liping Liu, Wei Yan, Yunlu Ma and Mingyue He (collecting
695
Raman spectra). Xinjian Bao, Liping Liu and Ruqian Zou (collecting and
696
interpreting the single-crystal X-ray data). Liping Liu (performing EMP analyses).
697
Mingyue He (helping in checking the draft of the paper). All authors discussed the
698
results and commented on the manuscript.
699
Conflicts of Interests: The authors declare no conflict of interests.
700
References
701
1. Evans, B.W.; Frost, B.R. Chrome-spinel in progressive metamorphism-a preliminary analysis. 702
Geochim. Cosmochim. Acta1975, 39, 959-972. 703
2. Barnes, S.J.; Roeder, P.L. The range of spinel compositions in terrestrial mafic and ultramafic 704
rocks. J. Petrol.2001, 42, 2279-2302. 705
3. Fabries, J. Spinel-olivine geothermometry in peridotites from ultramafic complexes. Contrib. 706
Mineral. Petrol.1979, 69, 329-336. 707
4. O’Neill, H.St.C. The transition between spinel lherzolite and garnet lherzolite, and its use as a 708
geobarometer. Contrib. Mineral. Petrol.1981, 77, 185-194. 709
5. Ballhaus, C.; Berry, R.F.; Green, D.H. High pressure experimental calibration of the 710
olivine-orthopyroxene-spinel oxygen barometer: Implications for the oxidation state of the 711
upper mantle. Contrib. Mineral. Petrol.1991, 107, 27-40. 712
peridotites and spatially associated lavas. Contrib. Mineral. Petrol.1984, 86, 54-76. 714
7. Liang, Y.; Elthon, D. Evidence from chromium abundances in mantle rocks for extraction of 715
picrite and komatiite melts. Nature1990, 343, 551-553. 716
8. Liu, X.; O'Neill, H.St.C. The effect of Cr2O3 on the partial melting of spinel lherzolite in the 717
system CaO-MgO-Al2O3-SiO2-Cr2O3 at 1.1 GPa. J. Petrol.2004, 45, 2261-2286. 718
9. Zhang, Y.; Liu, X.; Xiong, Z.; Zhang, Z. Compressional behavior of MgCr2O4 spinel from 719
first-principles simulation. Sci. China Earth Sci. 2016, 59, 989-996. 720
10. Xie, X.; Chen, M.; Wang, D. Shock-related mineralogical features and P-T history of the Suizhou 721
L6 chondrite. Eur. J. Mineral.2001, 13, 1177-1190. 722
11. Wang, A.; Kuebler, K.E.; Jolliff, B.L.; Haskin, L.A. Raman spectroscopy of Fe-Ti-Cr-oxides, case 723
study: Martian meteorite EETA 79001. Am. Mineral.2004, 89, 665-680. 724
12. Fritz J.; Greshake, A. High-pressure phases in an ultramafic rock from Mars. Earth Planet. Sci. 725
Lett. 2009, 288, 619-623. 726
13. Lenaz, D.; Princivalle, F.; Schmitz, B. First crystal-structure determination of chromites from an 727
acapulcoite and ordinary chondrites. Mineral. Mag.2015, 79, 755-765. 728
14. Hu, J.; Sharp, T.G. High-pressure phases in shock-induced melt of the unique highly shocked 729
LL6 chondrite Northwest Africa 757. Meteorit. Planet. Sc.2016, 51, 1353-1369. 730
15. Pieters, C.M.; Besse, S.; Boardman, J.; Buratti, B.; Cheek, L.; Clark, R.N.; Combe, J.P.; Dhingra, 731
D.; Goswami, J.N.; Green, R.O.; Head, J.W.; Isaacson, P.; Klima, R.; Kramer, G.; Lundeen, S.; 732
Malaret, E.; McCord, T.; Mustard, J.; Nettles, J.; Petro, N.; Runyon, C.; Staid, M.; Sunshine, J.; 733
Taylor, L.A.; Thaisen, K.; Tompkins, S.; Whitten, J. Mg-spinel lithology: A new rock type on the 734
lunar farside. J. Geophys. Res. Atmo.2011, 116, 287-296. 735
16. Gross, J.; Treiman, A.H. Unique spinel-rich lithology in lunar meteorite ALHA81005: Origin 736
and possible connection to M3 observations of the farside highlands. J. Geophys. Res.2011, 116, 737
E10009. 738
17. Ringwood, A.E. Phase transformations and their bearing on the constitution and dynamics of 739
the mantle. Geochim. Cosmochim. Acta1991, 55, 2083-2110. 740
18. Li, B.; Liebermann, R.C. Indoor seismology by probing the Earth's interior by using sound 741
velocity measurements at high pressures and temperatures. P. Natl. Acad. Sci. USA.2007, 104, 742
9145-9150. 743
19. Panero, W.R. Cation disorder in ringwoodite and its effects on wave speeds in the Earth's 744
transition zone. J. Geophys. Res.2008, 113, B10204. 745
20. Stixrude, L.; Lithgow-Bertelloni, C. Thermodynamics of mantle minerals - II. Phase equilibria. 746
Geophys. J. Int.2011, 184, 1180-1213. 747
21. Liu, X.; Xiong, Z.; Chang, L.; He, Q.; Wang, F.; Shieh, S.R.; Wu, C.; Li, B.; Zhang, L. Anhydrous 748
ringwoodites in the mantle transition zone: Their bulk modulus, solid solution behavior, 749
compositional variation, and sound velocity feature. Solid Earth Sci.2016, 1, 28-47. 750
22. Pearson, D.G.; Brenker, F.E.; Nestola, F.; McNeill, J.; Nasdala, L.; Hutchison, M.T.; Matveev, S.; 751
Mather, K.; Silversmit, G.; Schmitz, S.; Vekemans, B.; Vincze, L. Hydrous mantle transition zone 752
indicated by ringwoodite included within diamond. Nature2014, 507, 221-224. 753
23. Tomioka, N.; Miyahara, M. High-pressure minerals in shocked meteorites. Meteorit. Planet. Sc. 754
2017, 52, 2017-2039. 755
24. Chen, M.; Xie, X. The shock effects of olivine in the Yanzhuang chondrite. Acta Mineral. Sin. 756
1993, 13, 109-116. 757
25. Kimura, M.; Chen, M.; Yoshida, T.; El Goresy, A.; Ohtani, E. Back-transformation of 758
high-pressure phases in a shock melt vein of an H-chondrite during atmospheric passage: 759
Implications for the survival of high-pressure phases after decompression. Earth Planet. Sci. Lett. 760
2003, 217, 141-150. 761
26. Bischoff, A. Discovery of purple-blue ringwoodite within shock veins of an LL6 ordinary 762
chondrite from Northwest Africa. 33rd Lunar and Planetary Science Conference, Houston, 763
2002. 764
27. Hollister, L.S.; Bindi, L.; Yao, N.; Poirier, G.R.; Andronicos, C.L.; MacPherson, G.J.; Lin, C.; 765