Contents lists available atScienceDirect
Results in Physics
journal homepage:www.elsevier.com/locate/rinp
Application of graphene oxide based Micro
fi
ber-Knot resonator for relative
humidity sensing
S.R. Azzuhri
a, I.S. Amiri
b,c,⁎, A.S. Zulkhairi
d, M.A.M. Salim
d,e, M.Z.A. Razak
f, M.F. Khyasudeen
g,
H. Ahmad
d, R. Zakaria
d, P. Yupapin
baDepartment of Computer System & Technology, Faculty of Computer Science & Information Technology, University of Malaya (UM), Malaysia bComputational Optics Research Group, Advanced Institute of Materials Science, Ton Duc Thang University, Ho Chi Minh City, Viet Nam cFaculty of Applied Sciences, Ton Duc Thang University, Ho Chi Minh City, Viet Nam
dPhotonics Research Centre, University of Malaya (UM), Malaysia
eLaser Centre, Ibnu Sina Institute for Scientific & Industrial Research, Universiti Teknologi Malaysia (UTM), Malaysia fInstitute of Microengineering and Nanoelectronics (IMEN), Universiti Kebangsaan Malaysia (UKM), Malaysia gFaculty of Electrical Engineering, Universiti Teknologi MARA (UITM), Malaysia
A R T I C L E I N F O
Keywords:
Microfiber Resonator Humidity sensor
A B S T R A C T
A relative humidity (RH) sensor is proposed and demonstrated using a micro-knot resonator (MKR) enhanced with a layer graphene oxide (GO) coating. The MKR is fabricated by means of tapering a standardfiber, with the GO coating added by the drop-cast method. The proposed sensor is tested for an RH range of between 0% and 80% at 20% intervals, and the configurations with and without the GO coating achieve sensitivities of 0.0104 nm/% and 0.0095 nm/%, respectively. The MKR configuration without the GO coating has a linear response correlation coefficient of 0.9098 and a resolution of 0.1%, while the configuration with the GO coating has a linear response correlation coefficient of 0.9548 and a resolution of 0.096% which is better. The proposed sensor has multiple applications, especially in the area of climate and atmospheric measurement and monitoring.
Introduction
Since its successful isolation from graphite in 2004 by mechanical exfoliation[1], graphene has become key material in realizing a mul-titude of new and novel photonics applications. These new abilities stem from the unique optical and electrical characteristics of graphene, such as the ability to exhibit the quantum Hall effect at room tem-perature[2–4], an ambipolarfield effect and new optical properties [5–8]. While graphene and its derivatives such as graphene oxide (GO) initially made in-roads in thefield of communications, there has also been substantial interest in sensing applications[9,10]. The extremely large surface area made possible by its 2-D structure is advantageous towards making these materials highly sensitive to changes in the surrounding environment. Furthermore, these materials can be easily produced on a large scale at low cost, making them even more ad-vantageous for use in the sensing industry [11–18]. GO in particular possess certain advantages over conventional graphene for sensing applications, as it retains its high sensitivity but is easier and less costly to fabricate. This is primarily due to the inclusion of oxygen functional groups such as carboxyl, hydroxyl and epoxy groups into the hexagonal
crystalline structure of graphene, making it robust and easier to manage [19]. This was exemplified by the work of Dikin et. al. who created GO paper with remarkable mechanical properties using stacks of single GO sheets[20]. Furthermore, graphene oxide can easily be reduced in so-lution and as a thinfilm, which does not require an expensive equip-ment[21]. GO also exhibits a strongly anisotropic complex dielectric function, which is beneficial to photonics waveguide based polariser and sensor applications[22–26].
The application of graphene and GO as a sensor in optical systems has been well demonstrated[27,28]. Gaston et. al.[29]proposed and successfully demonstrated a humidity sensor using a side-polishedfiber (SPF) with a polyvinyl-alcohol (PVA) overlay. Yao et al.[30]on the other hand reported a GO silicon with a bi-layer adaptable structure as a stress-based humidity sensor which exhibited minimal hysteresis, with a quick response and recovery time. However, both these ap-proaches had certain limitations; the GO silicon bi-layer adaptable structure based sensor required a working voltage of 5 V, complicating the operation and overall effectiveness of the sensor, while the SPF based sensor can be difficult to fabricate, requiring significant time and care, as well as having a limited exposure interaction length[31].
https://doi.org/10.1016/j.rinp.2018.05.009
Received 25 March 2018; Received in revised form 1 May 2018; Accepted 2 May 2018
⁎Corresponding author at: Ton Duc Thang University, Ho Chi Minh City, Viet Nam. E-mail address:[email protected](I.S. Amiri).
URL:https://scholar.google.com/citations?hl=en&user=rM8jFG4AAAAJ&view_op=list_works&sortby=pubdate(I.S. Amiri).
Available online 05 May 2018
2211-3797/ © 2018 The Authors. Published by Elsevier B.V. This is an open access article under the CC BY-NC-ND license (http://creativecommons.org/licenses/BY-NC-ND/4.0/).
An interesting alternative to this would be the micro-knot resonator (MKR), which can be a prime candidate in the development of a cost-effective, easy to fabricate and simple to use optical sensors for climate and environmental monitoring. The MKR is essentially a taperedfiber with a waist region of several hundred nanometers to several micro-meters in diameter that is formed as a loop[32]. This configuration allows the evanescentfield of a propagating signal to interact with the surroundings of the MKR. The MKR possesses a number of key ad-vantages over similar narrow-waist fibers, in particular its excellent diameter uniformity and sidewall smoothness [8]. YuWu et al. have fabricatedfiber-optic interferometric humidity sensors based on silica/ polymer MKR. The silica microfibers used in this work were fabricated byflame-heated taper-drawing of a single-modefiber. The authors have reported a large humidity sensitivity and∼88 pm/10% RH for the si-lica and polymer MKR, at the range from 20%-RH to 96%-RH, and 17%-RH to 98%-17%-RH respectively[33]. Jong Cheol Shin et al. have fabricated the MKR with tie and loop diameters of 2 and 70 µm respectively with a polyvinyl alcohol overlay, which is highly sensitive to the concentration of RH. They have reported that the RH sensitivity of the proposed MKR-based RH sensor strongly depends on the mode order (m), which were measured to be −0.22, −0.44, −0.65, −0.87μm−1· %−1, respec-tively, where the multiple interference fringes depending on the mode orders are superimposed in the transmission spectrum [34]. In re-ference [35], the authors have improved the few modes 4 µm MKR sensitivity by coating the device with a polyvinyl alcohol (PVA) which can absorb the humidity efficiently. The improvement could be ob-tained via optimizing the diameter of the device.
By combining the MKR with a sensitive 2-D material coating, the sensitivity and responsivity of the MKR based sensor can be increased substantially. In this work, an MKR sensor utilizing a GO coating for the measurement of relative humidity (RH) is proposed and demonstrated. Humidity sensing is an integral part of many activities, including the monitoring of structures and manufacturing processes[36]. While hu-midity sensing and measurement can be made through conventional electronic sensors, certain limitations, including high fabrication and operation cost as well as maintenance requirements and an inability to be deployed in corrosive and explosive environments which restricts its use[37]. In this regard, optical based sensors such as the MKR can be used to overcome these limitations, and therefore offer significant po-tential for the development of large-scale sensor grids for environ-mental and climate monitoring.
Experimental setup
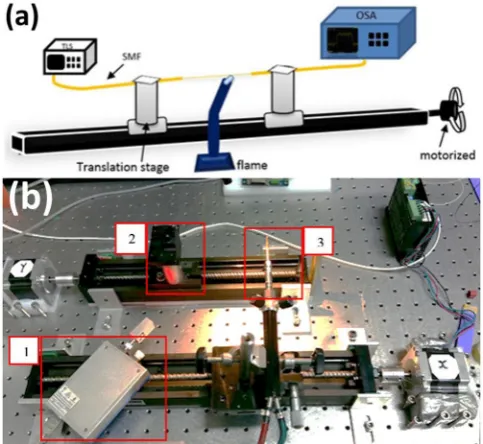
The MKR used in this work is fabricated from a taperedfiber, which is obtained using the flame-heating technique on a single-modefiber (SMF). The schematic of theflame-brush assembly is shown inFig. 1(a), while Fig. 1(b) provides the image of the actual setup. The SMF is commercially available, with the center region stripped of its protective polymer coating and cleaned thoroughly with propanol. The SMF is then secured byfiber holders onto two translation stages on a motor-ized rail, with both translation stages allowed to move along the rail opposite to each other. The center region of the SMF is placed such that it lies directly above the mouth of the torch. As the SMF is heated by the flame, it becomes soft and stretchable. At this juncture, the SMF is slowly stretched by the two translation stages as they move in opposing directions, creating a narrow waist region. The stretching process is monitored by measuring the loss of power of an amplified spontaneous emission (ASE) signal travelling through the SMF. The ASE source is assembled from a 980 nm laser diode and a 12 m long erbium doped fiber with an absorption rate of 5.0 dB/m at 1531 nm. The ASE source is then connected to one end of the SMF, with other end connected to a Thorlabs PM100USB optical power meter (OPM).
Flame brushing technique is easy to setup, provide high accuracy and does not require an expensive equipment or tedious setting. It is found that the shape of the taper should follow the adiabaticity criteria
and has a longer transition length to achieve low loss characteristic. As theflame brush heats and softens the SMF, the translation stages make micro-transitions of 0.25 mm in opposing directions, gently stretching the fiber before returning to the start position. This is done for 20 iterations, after which the process repeats, only this time with the stages stretching further to 50 mm for 40 iterations. The process repeats for a final time, with the stages moving 1.0 mm in each direction for 40 iterations.Fig. 2shows the Graph of number of iterations versus SMF stretching, whileFig. 3shows the schematic of the SMF before and after the stretching process.
It is important to note that in the fabrication of thefiber, the core diameter remains unchanged, and only the cladding stretches until it becomes so thin that the core is essentially exposed at the tapered waist region. The cladding diameter at the untapered regions remains un-changed, while the cladding in the transition region forming a slope. The region near the tapered waist and nearest the untapered region are seen to have diameters of 8.0 and 125.0 µm respectively, as shown in thefigure. The tapered SMF structure allows the evanescentfield that emits from the signal propagating through the core to interact with the surrounding environment, as the cladding region is now too narrow to confine the evanescentfield. The evanescentfield can now interact with Fig. 1.(a) Schematic of the taper fabrication setup. (b) Actual taper fabrication assembly. The ASE light source is boxed at the bottom left of the image (1), with one translation stage (2) and the torch (3) indicated in the center top region of the image. Note that one stage has been temporarily removed to allow the setup of the system to be seen clearly, and this stage, as well as the OPM are not shown in the image.
its surrounding, and any change in the propagating signal can be re-lated to the changing parameter in the environment. The MKR itself is created by simply looping the fabricated taperedfiber so that it forms a ring at the tapered region. It must be noted that although the tapered fiber is still structurally strong, significant care needs to be taken to ensure that the taperedfiber does not break. In this work, a ring with a diameter of 3.02 µm is obtained. The microscopic image capture of the MKR is given in Fig. 4. The untapered part of the MKR assembly is spliced to pigtails and can then be connected to conventional fiber components and devices.
The radius of taperedfiber can be approximated by the equation:
∫
= ⎛
⎝ ⎞ ⎠
r x r dx
L
( ) exp 1 2
0
(1) wherer0is the radius of thefiber core before tapering andLis the hot
zone length with a distance ofx, wherex can be calculated from Eq. (2):
= + ∝
L x( ) L0 x (2)
where the∝is constant which varies between−1 and 1, andL0being
the length of thefiber before tapering. The radius of the tapered can be obtained as in reference[38]as follows:
⎜ ⎟
= ⎛ ⎝
+∝ ⎞ ⎠
− ∝
r x r x
L
( ) 0 1
0 1 2
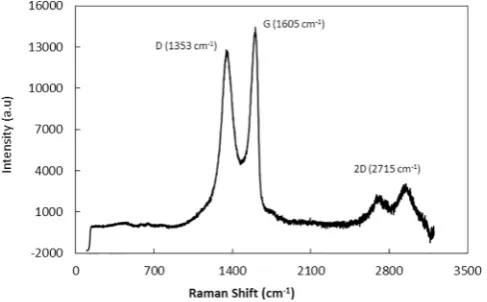
(3) The GO nanoparticles used in this work are obtained commercially in the form of an aqueous solution. The Raman spectrum of the GO nanoparticles is given inFig. 5.
Three Raman peaks are obtained at 1353 cm−1, 1605 cm−1 and
2715 cm−1, corresponding to the D, G and 2D peaks. These peaks verify
that the sample consists of GO nanoparticles, with little to no impurities present. The ratio of IGto I2D, at approximately 1:4 indicates that the
GO nanoparticles are stacked up in multiple layers[39,40]. The setup of the MKR as a humidity sensor is given inFig. 6. Once formed, the MKR is left in place and the translation stages locked to prevent accidental movements that might damage the MKR. The ASE source is now replaced with a Yokogawa AQ2200-136 tunable light source, and the OPM is substituted with an Anritsu model MS9740A optical spectrum analyzer (OSA). A simple, homemade con-tainment chamber is assembled around the MKR, and water vapor is introduced into the chamber by injecting nitrogen gas into a container containing water, which is then channelled into the chamber. The RH range is measured from an approximate value of 20% to 80% at 20% intervals using a hygrometer, which also acts as the reference source.
Results and discussion
The MKR fabricated in this work is tested as a humidity sensor with and without the GO coating. This is done to ascertain the performance of the MKR under both configurations, as well as to gauge the im-provement in performance as a result of the GO layer. In order to ensure that as little as possible changes or modifications are made to the ex-periment setup, which could in turn affect the measurements obtained, the MKR isfirst tested without the GO coating. Subsequently, the GO coating is added by simply drop-casting the GO solution on the MKR, and the entire experiment repeated. This ensures that the two confi g-urations are as similar as possible, and thus provide a more accurate comparison.
Fig. 3.Schematic of SMF before and after stretching by the taper fabrication assembly.
Fig. 4.Microscope image of the MKR, with a diameter of 3.02 µm.
Fig. 7shows the response of the MKR in both configurations against an increasing RH, from 20% to 80% at step-jumps of 20% each time. It can be seen from thefigure that the extinction ratio of the transmission spectrum for the MKR with the GO coating increases from around−41 to−27 dBm as the RH value increases as compared to an increase of only 10 dB for the MKR with no coating. This is attributed to the GO layer exhibiting high levels of hygroscopity[41], thus as the RH in-creases more and more water molecules are absorbed by the GO matrix. This in turn causes the refractive index of the GO layer to increase, such that it can better confine the evanescentfield of the test signal propa-gating through the core of the MKR. In the case of the MKR with no
coating, the change in the refractive index of the air as a result of the rising RH is still detectable, but as this change is less distinct only a small shift is observed in the extinction ratio. This clearly indicates that the addition of the GO coating increases the MKR sensitivity sig-nificantly, and therefore enhancing its performance substantially. The transmission spectrum obtained when using the MKR with no coating has a Q-factor of approximately 6307 and a free spectral range (FSR) of about 0.24 nm, while the GO coated MKR has a transmission spectrum Q-factor and FSR approximately 10,365 and 0.156 nm respectively.
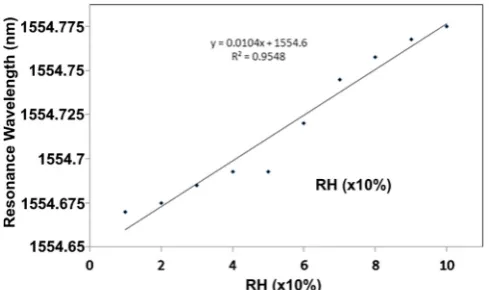
Figs. 8 and 9 provide the response of the resonance wavelength Fig. 6.Experimental setup of the RH sensor.
Fig. 7.Transmission spectrum of MKR (a) without GO coating and (b) with GO coating.
Fig. 8.Resonance wavelength shift against rising RH for the MKR without the
towards the changing RH levels for the uncoated and GO coated MKR configurations respectively. FromFig. 8, it can be seen that the un-coated MKR has a regression coefficient of determination (R2) of
0.9098, with a computed sensitivity of 0.0095 nm/%RH. On the other hand, the GO coated MKR has an R2value of 0.9548 and a sensitivity of
0.0104 nm/%RH, as shown in Fig. 9 the MKR sensor with the GO coating in this work demonstrates the ability to obtain measurements along a smaller range, which has comparable sensitivity value with others previously observed[42–46]. In this manner, the measurement ranges demonstrated by Zheng et al. and Alvarez et al.[47]for similar works are 51–78% RH and 0–15% RH, respectively.
According to the definition of humidity sensitivity of the sensor, the resolution can be calculated using following equation as[48]
=
R R
Sensitivity
Sensor
Wavelength
(4) where, theRsensoris the resolution of the MKR sensor, theRwavelengthis
the wavelengths resolution due to the RH variations. As it can be seen from Figs. 8 and 9, the wavelength shift of 0.1 nm observed for the 100% RH changes. Therefore, the wavelength resolution (Rwavelength) is
0.001 nm. Using the Eq.(4), the sensor resolutions (Rsensor) for the MKR
without and with the GO coating are 0.1% and 0.096% respectively, where the MKR coated with GO shows a higher sensitivity and therefore a better resolution.
Fig. 10shows the response of the optical power towards the change in RH value.
It can be seen from the figure that for the MKR without a GO coating, there is only a gradual change, with the power barely dropping from just above−30.5 dBm at a RH value of 0% to slightly less than −30.5 dBm as the RH value approaches 90%. On the other hand, the MKR coated with the GO nanoparticles experiences a drastic reduction in the power of the propagating signal, with the power dropping rapidly from approximately −30.7 dBm at an RH value of 0% to around −31.3 dBm at an RH value of 60%. After this, the signal power reduces at a slower rate as the RH increases, with the power dropping only slightly to−31.4 dBm as the RH value approaches 90%. This behavior is attributed to the GO particles becoming saturated with water mole-cules, and thus not able to host more molecules even as the RH in-creases. Table 1 summarizes the performance characteristic of the
proposed MKR humidity sensor for both configurations.
Overall, it can be seen that the use of the GO layer on the MKR significantly increases its performance as a sensor, in particular with an increase in sensitivity and better linearity. The GO coated MKR sensor has many potential sensing applications, most notably in climate and atmospheric parameter measurement.
Conclusion
In this work, an MKR based optical sensor is used as a RH sensor and its performance compared in two different cases, namely with and without a GO coating. The MKR is fabricated using a tapered fiber which is then looped into a knot. The MKR isfirst tested without the GO coating, and subsequently, the GO coating is added by the drop-casting liquid technique. The MKR is capable of detecting changes in the RH levels and has a regression coefficient of determination and sensitivity of 0.9098 and 0.0095 nm/%RH respectively for the uncoated MKR as well as a regression coefficient of determination and sensitivity of 0.9548 and 0.0104 nm/%RH respectively for the coated case. The proposed MKR sensor would have many potential sensing applications, particularly in measuring climate and atmospheric related parameters.
Acknowledgements
This work was supported by the research grants LRGS (2015)/ NGOD/UM/KPT, GA010-2014 (ULUNG) and BR002-2016.
Appendix A. Supplementary data
Supplementary data associated with this article can be found, in the online version, athttp://dx.doi.org/10.1016/j.rinp.2018.05.009.
References
[1] Novoselov KS, Geim AK, Morozov SV, Jiang D, Zhang Y, Dubonos SV, et al. Electric field effect in atomically thin carbonfilms. Science 2004;306:666–9.
[2] Novoselov KS, Jiang Z, Zhang Y, Morozov S, Stormer HL, Zeitler U, et al. Room-temperature quantum Hall effect in graphene. Science 2007;315:1379. [3] Zhang Y, Tan Y-W, Stormer HL, Kim P. Experimental observation of the quantum
Hall effect and Berry's phase in graphene. Nature 2005;438:201.
[4] Jiang Z, Zhang Y, Stormer H, Kim P. Quantum Hall states near the charge-neutral Dirac point in graphene. Phys Rev Lett 2007;99:106802.
[5] Mikhailov S, Ziegler K. New electromagnetic mode in graphene. Phys Rev Lett 2007;99:016803.
[6] Jablan M, Buljan H, SoljačićM. Plasmonics in graphene at infrared frequencies. Phys Rev B 2009;80:245435.
[7] Koppens FH, Chang DE, Garcia de Abajo FJ. Graphene plasmonics: a platform for strong light–matter interactions. Nano letters 2011;11:3370–7.
[8] Vakil A, Engheta N. Transformation optics using graphene. Science 2011;332:1291–4.
[9] Amiri I, Ariannejad M, Abdullah HY, Yupapin P. Spectral detection of graphene and graphene oxide with SU-8 based asymmetry tripled-Arm Mach Zehnder. Optik-Int J Light Electron Optics 2018;154:93–9.
[10] Pornsuwancharoen N, Amiri I, Suhailin F, Aziz M, Ali J, Singh G, et al. Micro-current source generated by a WGM of light within a stacked silicon-graphene-Au waveguide. IEEE Photonics Technol Lett 2017;29:1768–71.
[11] Schedin F, Geim A, Morozov S, Hill E, Blake P, Katsnelson M, et al. Detection of individual gas molecules adsorbed on graphene. Nature Mater 2007;6:652. [12] Al-Mashat L, Shin K, Kalantar-zadeh K, Plessis JD, Han SH, Kojima RW, et al.
Graphene/polyaniline nanocomposite for hydrogen sensing. J Phys Chem C 2010;114:16168–73.
[13] Robinson JT, Perkins FK, Snow ES, Wei Z, Sheehan PE. Reduced graphene oxide molecular sensors. Nano Lett 2008;8:3137–40.
[14] Lu G, Ocola LE, Chen J. Reduced graphene oxide for room-temperature gas sensors. Nanotechnology 2009;20:445502.
[15] Lu G, Ocola LE, Chen J. Gas detection using low-temperature reduced graphene oxide sheets. Appl Phys Lett 2009;94:083111.
[16] Fowler JD, Allen MJ, Tung VC, Yang Y, Kaner RB, Weiller BH. Practical chemical sensors from chemically derived graphene. ACS Nano 2009;3:301–6.
[17] Jeong HY, Lee D-S, Choi HK, Lee DH, Kim J-E, Lee JY, et al. Flexible room-tem-perature NO 2 gas sensors based on carbon nanotubes/reduced graphene hybrid films. Appl Phys Lett 2010;96:213105.
[18] Kulkarni GS, Reddy K, Zhong Z, Fan X. Graphene nanoelectronic heterodyne sensor for rapid and sensitive vapour detection. Nature Commun 2014;5:4376. [19] Stankovich S, Piner RD, Chen X, Wu N, Nguyen ST, RuoffRS. Stable aqueous Fig. 10.Output optical power of MKR with and without graphene as a function
of relative humidity.
Table 1
Performance of MKR with and without coating.
Performance parameter Without GO layer With GO layer
Sensitivity 0.0095 nm/%RH 0.0104 nm/%RH
Linear response correlation coefficient 90.98% 95.48%
dispersions of graphitic nanoplatelets via the reduction of exfoliated graphite oxide in the presence of poly (sodium 4-styrenesulfonate). J Mater Chem 2006;16:155–8. [20] Dikin DA, Stankovich S, Zimney EJ, Piner RD, Dommett GH, Evmenenko G, et al. Preparation and characterization of graphene oxide paper. Nature 2007;448:457. [21] Compton OC, Nguyen ST. Graphene oxide, highly reduced graphene oxide, and
graphene: versatile building blocks for carbon‐based materials. Small 2010;6:711–23.
[22] Lim W, Yap Y, Chong W, Pua C, Huang N, De La Rue R, et al. Graphene oxide-based waveguide polariser: From thinfilm to quasi-bulk. Optics Express
2014;22:11090–8.
[23] Amiri I, Soltanian M, Alavi S, Ahmad H. Multi wavelength mode-lock soliton gen-eration usingfiber laser loop coupled to an add-drop ring resonator. Opt Quant Electron 2015;47:2455–64.
[24] Soltanian M, Amiri I, Alavi S, Ahmad H. All optical ultra-wideband signal genera-tion and transmission using mode-locked laser incorporated with add-drop mi-croring resonator. Laser Phys Lett 2015;12:065105.
[25] Ahmad H, Amiri I, Zulkifli A, Hassan H, Safaei R, Thambiratnam K. Stable dual-wavelength erbium-dopedfiber laser using novel fabricated side-polished arc-shapedfiber with deposited ZnO nanoparticles. Chin Optics Lett 2017;15:011403. [26] Alavi S, Amiri I, Soltanian M, Penny R, Supa’at A, Ahmad H. Multiwavelength
generation using an add-drop microring resonator integrated with an InGaAsP/InP sampled grating distributed feedback. Chin Optics Lett 2016;14:021301. [27] Amiri IS, Ariannejad M, Ghasemi M, Naraei P, Kouhdaragh V, Seyedi S, et al.
Simulation of microring resonatorfilters based ion-exchange buried waveguide using nano layer of graphene. J Opt 2017;46:506–14.
[28] Ahmad H, Ghasemi M, Amiri I, Ariannejad M, Norizan SF, Latif AA, et al. Gold cone metasurface MIC sensor with monolayer of graphene and multilayer of graphite. Plasmonics 2017;12:497–508.
[29] Gaston A, Lozano I, Perez F, Auza F, Sevilla J. Evanescent wave optical-fiber sensing (temperature, relative humidity, and pH sensors). IEEE Sens J 2003;3:806–11. [30] Yao Y, Chen X, Guo H, Wu Z, Li X. Humidity sensing behaviors of graphene
oxide-silicon bi-layerflexible structure. Sens Actuators B 2012;161:1053–8.
[31] Gastón A, Pérez F, Sevilla J. Opticalfiber relative-humidity sensor with polyvinyl alcoholfilm. Appl Optics 2004;43:4127–32.
[32] Soltanian MRK, Sharbirin AS, Ariannejad M, Amiri I, De La Rue R, Brambilla G, et al. Variable waist-diameter Mach-Zehnder tapered-fiber interferometer as hu-midity and temperature sensor. IEEE Sens J 2016;16:5987–92.
[33] Wu Y, Zhang T, Rao Y, Gong Y. Miniature interferometric humidity sensors based on silica/polymer microfiber knot resonators. Sens Actuators B 2011;155:258–63. [34] Shin JC, Yoon M-S, Han Y-G. Relative humidity sensor based on an optical
microfiber knot resonator with a polyvinyl alcohol overlay. J Lightwave Technol 2016;34:4511–5.
[35] Le ADD, Han Y-G. Relative humidity sensor based on a few-mode microfiber knot resonator by mitigating the group index difference of a few-mode microfiber. J Lightwave Technol 2017.
[36] Yeo T, Sun T, Grattan K. Fibre-optic sensor technologies for humidity and moisture measurement. Sens Actuators A 2008;144:280–95.
[37] Correia SF, Antunes P, Pecoraro E, Lima PP, Varum H, Carlos LD, et al. Opticalfiber relative humidity sensor based on a FBG with a di-ureasil coating. Sensors 2012;12:8847–60.
[38] Harun S, Lim K, Tio C, Dimyati K, Ahmad H. Theoretical analysis and fabrication of taperedfiber. Optik-Int J Light Electron Optics 2013;124:538–43.
[39] Ferrari AC. Raman spectroscopy of graphene and graphite: disorder, electro-n–phonon coupling, doping and nonadiabatic effects. Solid State Commun 2007;143:47–57.
[40] Graf D, Molitor F, Ensslin K, Stampfer C, Jungen A, Hierold C, et al. Raman imaging of graphene. Solid State Commun 2007;143:44–6.
[41] Wang Y, Shen C, Lou W, Shentu F. Fiber optic humidity sensor based on the gra-phene oxide/PVA compositefilm. Opt Commun 2016;372:229–34.
[42] Harith Z, Irawati N, Batumalay M, Rafaie H, Yun II G, Harun S, et al. Relative humidity sensor employing opticalfibers coated with ZnO nanostructures. Indian J Sci Technol 2015;8.
[43] Batumalay M, Harith Z, Rafaie H, Ahmad F, Khasanah M, Harun S, et al. Tapered plastic opticalfiber coated with ZnO nanostructures for the measurement of uric acid concentrations and changes in relative humidity. Sens Actuators A 2014;210:190–6.
[44] Lim WH, Yap YK, Chong WY, Ahmad H. All-optical graphene oxide humidity sen-sors. Sensors 2014;14:24329–37.
[45] Ahmad H, Rahman M, Sakeh S, Razak M, Zulkifli M. Humidity sensor based on microfiber resonator with reduced graphene oxide. Optik-Int J Light Electron Optics 2016;127:3158–61.
[46] Irawati N, Rahman HA, Yasin M, Al-Askari S, Hamida BA, Ahmad H, et al. Relative humidity sensing using a PMMA doped agarose gel microfiber. J Lightwave Technol 2017;35:3940–4.
[47] B Wang, F Zhang, F Pang, T Wang, An opticalfiber humidity sensor based on optical absorption In: Asia communications and photonics conference and exhibition; 2011, p. 83112A.