©FUNPEC-RP www.funpecrp.com.br Genetics and Molecular Research 18 (2): gmr18204
F.L. da Silva, I.R. Carvalho, V.J. Szareski, C. Troyjack, S.M. Dellagostin1, F. Lautenchleger2, A.B.N. Martins1, H.E. Rodrigues3, D. Boeno4, S.M. Fachi4, T. Pedó1, F.A. Villela1 and V.Q. Souza3
1
Universidade Federal de Pelotas, Capão do Leão, RS, Brasil
2
Universidade Estadual do Centro-Oeste, Guarapuava, PR, Brasil
3
Universidade Federal do Pampa, São Gabriel, RS, Brasil
4
Universidade Federal de Santa Maria, Santa Maria, RS, Brasil
Corresponding author: I.R. Carvalho E-mail: [email protected]
Genet. Mol. Res. 18 (2): gmr18204 Received November 05, 2018 Accepted May 27, 2019 Published May 28, 2019
DOI http://dx.doi.org/10.4238/gmr18204
©FUNPEC-RP www.funpecrp.com.br Genetics and Molecular Research 18 (2): gmr18302
Key words:Triticum aestivum; Univariate and multivariate regression; Inter-relations
INTRODUCTION
The use of pastures during the winter keeps the soil covered and contributes to crop rotation (Fontaneli et al., 2000). Dual purpose cereals provide grain that can be used for animal and human food and they supply green fodder for animals (Del Duca et al., 1999).
Dual-purpose wheat genotypes show high phytomass yield, a long vegetative phase, tolerance to trampling, high tillering potential and fast establishment, as well as forage and grain production (Martin et al., 2010; Szareski et al., 2016a; Carvalho et al., 2016a). This type of wheat is grown in several countries, including the United States of America, Uruguay and Argentina (Fontaneli, 2007; Hastenpflug, 2009; Kavalco et al., 2017). Research shows bromatological characteristics with crude protein around 27% and 69% total digestible nutrients (Hastenpflug et al., 2011; Carvalho et al., 2016b; Silveira et al., 2018).
There are several practices that aim at higher productivity; these include cutting regimes. Martin et al. (2013), showed that the number of cuts changes the interrelationships between production characters. For Mello et al. (2003), the interval between cuts affects forage production, nutritive value and the potential for regrowth. Determining effects are attributed to precipitation and air temperature (Szareski et al., 2016b). Production behavior is dependent on climatic variables, relationships between the characters of interest, and characteristics of the genotypes (Cruz et al., 2014; Carvalho et al., 2017; Szareski et al., 2018).
In this context, canonical correlations allow us to group variables of interest and determine associations between groups to enable indirect character selection (Cruz et al., 2012). For Carvalho et al. (2015), canonical correlations show that there are modifications in the inter-relations of the morphological characters and the yield of grains according to cutting management. For Balbinot et al. (2005), multiple regressions using stepwise analysis can be important tools for researchers, in order to select which attributes are determinant for the dependent character of interest. Along this line, we evaluated the correlation between yield, meteorological and bromatological characters in five genotypes of dual purpose wheat submitted to different cutting managements.
MATERIAL AND METHODS
The experiments were carried out in the agricultural crop years 2014 and 2015, in
fields at 27o39'56"S latitude and 53o42'94"W longitude, with an altitude of 490 meters. The
soil is classified as Ferric Aluminum Red Latosol (Oxisol) and the climate is characterized by Köppen as subtropical Cfa (Moreno, 1961). The experimental design was a randomized block, organized in a factorial scheme, with five genotypes of dual-purpose wheat (BRS Tarumã, BRS Umbu, BRS Figueira, BRS Guatambu and BRS 277), three cutting managements (one, two and three cuts), with three replicates.
Genetics and Molecular Research 18 (2): gmr18204 ©FUNPEC-RP www.funpecrp.com.br
250 kg.ha-1 of NPK in the formulation (10-20-20), and for top-dressing, a total of 90 kg.ha-1
of nitrogen in the form of urea, applied at the stage of full tillering (Carvalho et al 2015). The criterion used to perform the cuts was that the plants of the experimental unit had an average height of 30 cm, which was done manually, leaving them 10 cm high (remaining) to enable regrowth of the plants. The evaluations were carried out in the central lines of each experimental unit, leaving 0.50 meters at each end, in order to reduce border effects. For the evaluation of the characters of agronomic interest 10 random plants were sampled. Control of insect pests and diseases was carried out in a preventive way.
The number of ears per square meter (NEM), grain yield (YIELD), number of grains per ear (NGE), grain mass per ear (GME) (Carvalho et al., 2015), hectoliter weight (HW), dry matter productivity (DMP), fresh matter (FM), dry matter (DM), neutral detergent fiber (NDF), crude protein (PTN), lipids (LIP), acid detergent fiber (ADF), lignin (LIG), hemicellulose (HEM), cellulose (CEL), mineral material (MM), total carbohydrates (TC), non-fibrous carbohydrates (NFC), maximum air temperature (TMAX), minimum air temperature (TMIN), maximum air humidity (HMAX), minimum air humidity (HMIN), precipitation (PREC) and incident solar radiation (RAD) were recorded, according to the methodology of Carvalho et al. (2015).
The data were submitted to analysis of individual variance for each cut management, in order to examine the homogeneity and linearity of the variances. Subsequently, the data of each cut management were submitted to Pearson's linear correlation analysis, canonical correlations and predictions. The linear correlation (Steel et al., 1997) was based on the association between LIP, NDF, ADF, LIG, HEM, CEL, MM, TC, NFC, TMAX, TMIN, HMAX, HMIN, PREC and RAD stratified for each management cut.
For the establishment of canonical groups, the characters were separated into forage and yield components. In group I, neutral detergent fiber (NDF), crude protein (PTN), fresh matter (FM) and dry matter yield (DM) were established, group II was composed of number of ears per square meter (NEM), hectoliter weight (HW), thousand grains mass (TGM), grain yield (YIELD), number of grains per ear (NGE) and grain mass per ear (GME).
Subsequently, a predictor model based on Stepwise multiple regression was developed
considering the statistical model: Ŷ = A+B+C+D+E+ F, where: Ŷ: dependent character
(NDF, CEL, TC, NFC, MM, HEM); A: data source (intercept); B, C, D, E and F: multiple
angular coefficients; TMAX, TMIN, HMAX, HMIN, PREC and RAD are considered as explanatory characteristics of the stochastic model.
RESULTS AND DISCUSSION
The linear correlations for the first cut (Table 1) gave 28 significant associations, among these 15 correlations were positive and 13 negative. A positive correlation of NDF with ADF, HEM with CEL, ADF with LIG, as well as CEL with HMIN, MM with TMIN and TMAX. TMAX and TMIN are associated, as well as HMAX and HMIN; rainfall influences HMIN. Negative associations of LIP with ADF and CEL were found, NDF with NFC. HEM and TC were inversely related to TMAX and TMIN, and HMAX and HMIN were associated with RAD.
©FUNPEC-RP www.funpecrp.com.br Genetics and Molecular Research 18 (2): gmr18302
Table 1. Pearson’s linear correlation for 16 bromatological and meteorological characters in five dual purpose wheat genotypes submitted to one cut.
LIP NDF ADF LIG HEM CEL MM PTN TC NFC T_MAX T_MIN H_MAX H_MIN PREC RAD
LIP(1) - -0.15 -0.58* -0.35 -0.38 -0.55* -0.30 -0.31 -0.06 -0.08 -0.19 -0.18 -0.11 -0.09 -0.27 -0.15
NDF - -0.61* -0.4 -0.61* -0.51* -0.20 -0.19 -0.11 -0.84* -0.44 -0.45 -0.17 -0.07 -0.16 -0.40 ADF - -0.57* -0.24 -0.93* -0.48 -0.38 -0.24 -0.60* -0.26 -0.24 -0.09 -0.06* -0.21 -0.14 LIG - -0.07 -0.27 -0.11 -0.00 -0.01 -0.32 -0.03 -0.03 -0.32 -0.32 -0.63* -0.21
HEM - -0.29 -0.23 -0.14 -0.09 -0.43 -0.81* -0.80* -0.12 -0.03 -0.01 -0.34
CEL - -0.52* -0.50 -0.26 -0.54 -0.32 -0.29 -0.07 -0.09 -0.03 -0.03
MM - -0.41 -0.89* -0.63* -0.53* -0.54* -0.00 -0.04 -0.01 -0.11
PTN - -0.08 -0.19 -0.00 -0.00 -0.10 -0.09 -0.08 -0.10
TC - -0.62* -0.53* -0.54* -0.01 -0.04 -0.05 -0.14
NFC - -0.06 -0.64 -0.12 -0.08 -0.09 -0.39
T_MAX - -0.99* -0.08 -0.01 -0.08 -0.23
T_MIN - -0.02 -0.07 -0.03 -0.17
H_MAX - -0.98* -0.77* -0.83*
H_MIN - -0.78* -0.82*
PREC - -0.60*
RAD -
* Pearson's linear correlation coefficients (n = 90) significant at 5.00% error probability. (1)LIP: percentage of lipids;
NDF: percentage of neutral detergent fiber; ADF: percentage of acid detergent fiber; LIG: percentage of lignin; HEM: percentage of hemicellulose; CEL: percentage of cellulose; MM: percentage of mineral matter; PTN: percentage of crude protein; TC: percentage of total carbohydrates; NFC: percentage of non-fibrous carbohydrates; T_MAX: maximum temperature; T_MIN: minimum temperature; H_MAX: maximum humidity; H_MIN: minimum humidity; PREC: precipitation; RAD: solar radiation.
For the second cut (Table 2), there were 31 significant correlations 18 of these being positive and 13 were negative. LIP was positively associated with TMIN, NDF with ADF, HEM with CEL, TC with TMAX and TMIN, ADF with CEL and TC, HEM with TC, TMAX and TMIN, MM with PTN; CT was positively associated with TMAX and TMIN, HMAX and HMIN. Negative trends were found between NDF with PTN and NFC, ADF with MM, HEM with PTN and NFC, CEL with PTN, MM with TC, TMAX and TMIN, PTN with TC, TMIN, as well as RAD with HMIN.
Table 2. Pearson's linear correlation for 16 bromatological and meteorological characters in five dual purpose wheat genotypes submitted to two cuttings.
LIP NDF ADF LIG HEM CEL MM PTN TC NFC T_MAX T_MIN H_MAX H_MIN PREC RAD
LIP(1) - -0.28 -0.3 0.25 -0.21 -0.43 -0.09 -0.11 -0.21 -0.21 -0.48 -0.53* -0.07 -0.12 -0.31 -0.26
NDF - -0.77* 0.11 -0.93* -0.74* -0.51 -0.58* -0.73* -0.77* -0.63* -0.59* -0.23 -0.21 -0.14 -0.41 ADF - 0.25 -0.49 -0.89* -0.56* -0.47 -0.73* -0.44 -0.47 -0.44 -0.13 -0.09 -0.10 -0.44 LIG - -0.00 -0.16 -0.47 -0.11 -0.22 -0.03 -0.30 -0.29 -0.11 -0.10 -0.23 -0.10
HEM - -0.50 -0.38 -0.52* -0.59* -0.81* -0.6* -0.56* -0.24 -0.23 -0.14 -0.31
CEL - -0.35 -0.54* -0.65* -0.47 -0.34 -0.32 -0.19 -0.14 -0.00 -0.41
MM - -0.29* -0.86* -0.05 -0.59* -0.61* -0.05 -0.11 -0.21 -0.39
PTN - -0.62* -0.26 -0.51 -0.53* -0.17 -0.07 -0.27 -0.02
TC - -0.14 -0.51* -0.52* -0.05 -0.01 -0.15 -0.37
NFC - -0.45 -0.38 -0.28 -0.32 -0.07 -0.25
T_MAX - -0.98* -0.17 -0.11 -0.17 -0.25
T_MIN - -0.08 -0.01 -0.22 -0.14
H_MAX - -0.98* -0.30 -0.54*
H_MIN - -0.21 -0.57*
PREC - -0.31
RAD -
* Pearson's linear correlation coefficients (n = 90) significant at 5.00% error probability. (1)LIP: percentage of lipids;
Genetics and Molecular Research 18 (2): gmr18204 ©FUNPEC-RP www.funpecrp.com.br
For the third cut (Table 3), there were 15 significant associations, being eight positive and seven negative. The NDF positively influenced ADF, LIG and HEM, TMAX was associated with the TMIN, as well as HMAX with HMIN. Negative trends were found between LIP and CEL, LIG with PREC, MM with TC and NFC. HMAX and HMIN decreased as a function of RAD. There were similarities between the three cutting treatments, in the trends for NDF, ADF and HEM.
Table 3. Pearson linear correlation for 16 bromatological and meteorological characters in five dual purpose wheat genotypes submitted to three cuttings.
LIP NDF ADF LIG HEM CEL MM PTN TC NFC T_MAX T_MIN H_MAX H_MIN PREC RAD
LIP(1) - 0.00 -0.23 -0.01 -0.16 -0.79* -0.47 -0.27 -0.41 -0.33 -0.39 -0.36 -0.29 -0.23 -0.09 -0.05
NDF - -0.66* -0.54* -0.82* -0.12 -0.01 -0.04 -0.01 -0.58 -0.07 -0.07 -0.15 -0.13 -0.44 -0.20 ADF - -0.59* -0.11 -0.55* -0.03 -0.25 -0.04 -0.43 -0.06 -0.09 -0.1 -0.12 -0.36 -0.02 LIG - -0.27 -0.13 -0.16 -0.02 -0.10 -0.24 -0.20 -0.17 -0.47 -0.48 -0.56* -0.38
HEM - -0.25 -0.03 -0.25 -0.05 -0.44 -0.04 -0.02 -0.12 -0.08 -0.31 -0.29
CEL - -0.34 -0.47 -0.18 -0.07 -0.16 -0.11 -0.34 -0.26 -0.27 -0.04
MM - -0.23 -0.91* -0.74* -0.02 -0.00 -0.14 -0.11 -0.44 -0.06
PTN - -0.57* -0.43 -0.04 -0.00 -0.38 -0.36 -0.04 -0.08
TC - -0.80* -0.04 -0.07 -0.22 -0.20 -0.31 -0.01
NFC - -0.08 -0.10 -0.08 -0.08 -0.01 -0.11
T_MAX - -0.99* -0.19 -0.21 -0.21 -0.17
T_MIN - -0.20 -0.25 -0.23 -0.24
H_MAX - -0.97* -0.03 -0.51*
H_MIN - -0.05 -0.60*
PREC - -0.32
RAD -
* Pearson's linear correlation coefficients (n = 90) significant at 5.00% error probability. (1)LIP: percentage of lipids;
NDF: percentage of neutral detergent fiber; ADF: percentage of acid detergent fiber; LIG: percentage of lignin; HEM: percentage of hemicellulose; CEL: percentage of cellulose; MM: percentage of mineral matter; PTN: percentage of crude protein; TC: percentage of total carbohydrates; NFC: percentage of non-fibrous carbohydrates; T_MAX: maximum temperature; T_MIN: minimum temperature; H_MAX: maximum humidity; H_MIN: minimum humidity; PREC: precipitation; RAD: solar radiation.
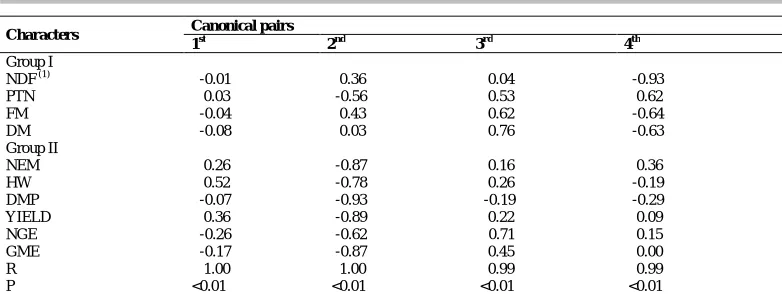
The estimates of the correlation coefficients of the canonical pairs between the bromatological characters (Group I) and those related to the components of wheat yield (Group II), revealed in the management of one cut (Table 4) and two cuts (Table 5) significance for four canonical pairs; management with three cuts (Table 6) revealed significance for three canonical pairs. Management with one cut revealed for the 1st canonical pair a correlation coefficient of r = 1.00 between groups (Table 4). The greatest accumulation of DM (Group I) determined HW, YELD, TGM and NGE. The second canonical pair gave a correlation coefficient of r = 1.00 (Table 4), where FM influences NEM, HW, YELD, NGE and GME. The third canonical pair had a correlation coefficient of r = 0.99 (Table 4), where NDF (Group I) determines TGM, NGE and GME (Group II). The fourth canonical pair revealed a correlation coefficient of r = 0.99 (Table 4) and indicates that PTN (Group I) favors an increase in NEM, NGE, but it minimizes HW, TGM and YELD.
©FUNPEC-RP www.funpecrp.com.br Genetics and Molecular Research 18 (2): gmr18302
a decrease in PTN (Group I) to minimize NEM, HW, and TGM and YELD, as well as NGE and GME (Group II).
Table 4. Estimates of correlations and canonical pairs between forage characters (Group I) and grain yield (Group II) in five genotypes of dual-purpose wheat submitted to one cut.
Characters Canonical pairs
1st 2nd 3rd 4th
Group I
NDF (1) <-0.16 <-0.54 -<0.81 <-0.06
PTN -<0.36 <-0.05 <-0.60 <-0.70
FM -<0.25 <-0.71 -<0.63 <-0.13
DM -<0.58 <-0.58 -<0.13 <-0.01
Group II
NEM <-0.26 <-0.74 <-0.61 <-0.07
HW -<0.36 <-0.87 <-0.32 <-0.01
DMP -<0.30 <-0.84 -<0.14 <-0.42
YIELD <-0.23 <-0.97 <-0.03 <-0.03
NGE <-0.11 <-0.85 -<0.46 <-0.18
GME <-0.03 <-0.94 -<0.24 <-0.19
R -<1.00 <-1.00 -<0.99 <-0.99
P -<0.01 -<0.01 -<0.01 -<0.01
R = canonical correlation. P = significance. (1)NDF= Neutral detergent fiber; PTN= Crude protein; FM= Fresh matter, in
grams; DM= Dry matter, in grams; NEM= Number of ears per m2; HW= Hectoliter weight, in g cm-3; DMP= Dry matter
productivity; YIELD= Yield grain, in Kg ha-1; NGE= Number of grains per ear, in units; GME= Grain mass per ear, in
grams.
Table 5. Estimates of correlation and canonical pairs between forage characters (Group I) and grain yield (Group II) in five dual purpose wheat genotypes submitted to two cuttings.
Characters Canonical pairs
1st 2nd 3rd 4th
Group I
NDF (1) <-0.01 <
-0.36 -<0.04 <-0.93
PTN -<0.03 <-0.56 -<0.53 -<0.62
FM <-0.04 <-0.43 -<0.62 <-0.64
DM <-0.08 <-0.03 -<0.76 <-0.63
Group II
NEM -<0.26 <-0.87 -<0.16 -<0.36
HW -<0.52 <-0.78 -<0.26 <-0.19
DMP <-0.07 <-0.93 <-0.19 <-0.29
YIELD -<0.36 <-0.89 -<0.22 -<0.09
NGE <-0.26 <-0.62 -v 0.71 -<0.15
GME <-0.17 <-0.87 -<0.45 -<0.00
R -<1.00 <-1.00 -<0.99 -<0.99
P <0.01 -<0.01 -<0.01 -<0.01
R = canonical correlation. P = significance. (1)NDF= Neutral detergent fiber; PTN= Crude protein; FM= Fresh matter, in
grams; DM= Dry matter, in grams; NEM= Number of ears per m2; HW= Hectoliter weight, in g cm-3; DMP= Dry matter
productivity; YIELD= Yield grain, in Kg ha-1; NGE= Number of grains per ear, in units; GME= Grain mass per ear, in
Genetics and Molecular Research 18 (2): gmr18204 ©FUNPEC-RP www.funpecrp.com.br
The third canonical pair had a correlation coefficient of r = 0.99 (Table 5), where the increment of FM (Group I) determines NEM, HW, YELD, NGE and GME (Group II). The fourth canonical pair presented a correlation coefficient of r = 0.99 (Table 5), and revealed that a lower level of NDF (Group I) favors a decrease in HW and TGM, and favors an increase in NEM andYELD (Group II).
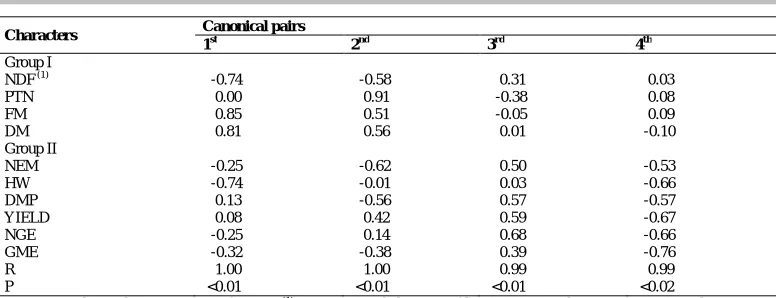
Management with three cuts for the first canonical pair (r = 1.00) and justifies the associations between the groups of characters (Table 6). The increase in FM (Group I) determines TGM and YELD (Group II). The second canonical pair (r = 1.00) showed that an increase in PTN (Group I) affected YELD and NGE, inversely related to the magnitude of NEM, HW, TGM and GME (Group II). The third canonical pair (r = 0.99) shows relationships between the groups of characters (Table 6). An increase in NDF (Group I) negatively influences NEM, HW, TGM and YELD (Group II).
Table 6. Estimates of correlation and canonical pairs between forage characters (Group I) and grain yield (Group II) in five dual purpose wheat genotypes submitted to three cuttings.
Characters Canonical pairs
1st 2nd 3rd 4th
Group I
NDF (1) <-0.74 <-0.58 -<0.31 <-0.03
PTN <-0.00 <-0.91 <-0.38 <-0.08
FM <-0.85 <-0.51 <-0.05 <-0.09
DM <-0.81 <-0.56 -<0.01 <-0.10
Group II
NEM <-0.25 <-0.62 -<0.50 <-0.53
HW <-0.74 <-0.01 -<0.03 <-0.66
DMP <-0.13 <-0.56 -<0.57 <-0.57
YIELD -<0.08 <-0.42 -<0.59 <-0.67
NGE <-0.25 <-0.14 -<0.68 <-0.66
GME <-0.32 <-0.38 -<0.39 <-0.76
R -<1.00 <-1.00 -<0.99 <-0.99
P -<0.01 -<0.01 -<0.01 -<0.02
R = canonical correlation. P = significance. (1)NDF= Neutral detergent fiber; PTN= Crude protein; FM= Fresh matter, in
grams; DM= Dry matter, in grams; NEM= Number of ears per m2; HW= Hectoliter weight, in g cm-3; DMP= Dry matter
productivity; YIELD= Yield grain, in Kg ha-1; NGE= Number of grains per ear, in units; GME= Grain mass per ear, in
grams.
The predictive model was established with the purpose of finding out which explanatory characteristics are determinant for the bromatological components in each cut management, according to data source estimates (NDF, CEL, TC, NFC, MM and HEM) and climatic conditions, as linear associations are specific to the characters measured (Table 7). For the NDF content with one and three cuts, there was a significance of the predictor model. In the first cut, NDF was determined by increasing the TMAX and reducing the TMIN and RAD. Under the conditions of the third cut, NDF was expressed due to HMIN, PREC and RAD.
©FUNPEC-RP www.funpecrp.com.br Genetics and Molecular Research 18 (2): gmr18302
the MM accumulated in the forage from the second cut, this can be potentiated by TMAX and PREC. The treatment with three cuts reveals that HEM was associated with decreases in HMIN, PREC and RAD in the crop canopy.
Table 7. Predictive model based on multiple linear regression for bromatological characters and dual-purpose wheat yield submitted to different cutting managements (one, two or three cuttings).
Character Cuts Dependent characters for bromatological and yield aspects
NDF
1 Y= 44.70564 +9.48327(T_MAX) -9.67379(T_MIN) -0.01062(RAD) R2= 0.70*
2 -
3 Y= 92.01976 -0.29206(H_MIN) -11.7488(PREC) -0.01177(RAD) R2= 0.53*
CEL
1 Y= 9.25212 +6.99383(T_MAX) -6.76567(T_MIN) -0.00621(RAD) R2= 0.50*
2 -
3 -
TC
1 Y= 70.51687 -0.3675(T_MIN) +0.15867(H_MIN) +0.00556(RAD) R2= 0.51*
2 -
3 -
NFC
1 Y= 26.58501 -9.29129(T_MAX) +0.14786(H_MIN) +0.01576(RAD) R2= 0.52*
2 -
3 -
MM
1 -
2 Y= 13.08692 +5.34587(T_MAX) -5.76863(T_MIN) +5.25758(PREC) -0.005(RAD) R2= 0.73*
3 -
HEM
1 -
2 -
3 Y= 59.09873 -0.2111(H_MIN) -7.20533(PREC) -0.00923(RAD) R2= 0.44*
* significant at 5% by the t-test. NDF= neutral detergent fiber; CEL= cellulose; TC= total carbohydrates; NFC= non-fibrous carbohydrates; MM= mineral matter; HEM= hemicellulose; T_MAX= maximum temperature; T_MIN= minimum temperature; H_MIN= minimum humidity; PREC= precipitation; RAD= solar radiation.
CONCLUSIONS
Grain yield and bromatological components of the forage are affected by meteorological factors and cut management.
Neutral and acid detergent fiber, hemicellulose, mineral matter and total carbohydrates are influenced by maximum and minimum air temperature, as well as incident solar radiation. The canonical interrelationships and the predictive models developed for the morphological, bromatological and grain yield attributes are specific for each cut management (one, two or three cuttings) used in dual purpose wheat.
REFERENCES
Balbinot JR, Backes RL, Alves AC, Ogliari JB, et al. (2005). Contribuição de componentes de rendimento na
produtividade de grãos em variedades de polinização aberta de milho. Rev. Bras. Agro. 11: 161-166.
Carvalho IR, Nardino M, Souza VQ, Lazzari R, et al. (2016a). Phenotypic associations for forage and bromatologic traits
in dual-purpose wheat. Aust. Basic Appl. Sci. 10: 188-196.
Carvalho IR, Nardino M, Demari G, Szareski VJ, et al. (2016b). Biometry and Genetic Breeding of dual purpose wheat.
Int. J. Curr. Res. 8: 34539-34545.
Carvalho IR, Souza VQ, Nardino M, Follmann DN, et al. (2015). Correlações canônicas entre caracteres morfológicos e
componentes de produção em trigo de duplo propósito. Pesq. Agropec. Bras. 50: 690-697. Doi:
http://dx.doi.org/10.1590/S0100-204X2015000800007.
Carvalho IR, Nardino M, Follmann DN, Demari GH, et al. (2017). Path analysis of grain yield associated characters in
Genetics and Molecular Research 18 (2): gmr18204 ©FUNPEC-RP www.funpecrp.com.br
Carvalho IR (2015). Modelos biométricos aplicados ao melhoramento genético de trigo de duplo propósito. pp. Dissertation (Master in Agronomy), Universidade Federal de Santa Maria, Santa Maria.
Cruz CD, Carneiro PCS and Regazzi AJ (2014). Modelos biométricos aplicados ao melhoramento de plantas. v 2. 3 edn. UFV, Viçosa.
Cruz CD, Regazzi AJ and Carneiro PCS (2012). Modelos biométricos aplicados ao melhoramento genético. UFV, Viçosa.
Del Duca LJA, Guarienti EM, Fontaneli RS and Zanotto DL (1999) Influência de cortes simulando pastejo na
composição química de grãos de cereais de inverno. Pesq. Agro. Bras. 34: 1607- 1614.
Fontaneli RS, Santos HP, Ambrosi I, Ignaczak JC, et al. (2000). Sistemas de produção de grãos com pastagens anuais de inverno, sob plantio direto. Embrapa trigo, Passo Fundo. Circular Técnica, 6.
Fontaneli RS (2007). Trigo de duplo propósito na integração lavoura-pecuária. Rev Plant Dir, Aldeia Norte Editora, Passo Fundo.
Hastenpflug M, Braida JA, Martin TN, Ziech MF, et al. (2011). Cultivares de trigo de duplo propósito submetidos ao
manejo nitrogenado e a regimes de corte. Arq. Bras. Med. Vet. Zoot. 63: 196-202. Doi:
http://dx.doi.org/10.1590/S0102-09352011000100029
Hastenpflug M (2009). Desempenho de cultivares de trigo duplo propósito sob doses de adubação nitrogenada e regimes de corte, Pato Branco Dissertation (Master in Agronomy, Plant Production), Universidade Tecnológica Federal do Paraná- UTFPR.
Kavalco SAF, Carvalho IR, Nardino M, Follmann DN, et al. (2017). Dual-purpose wheat subjected to different seed
treatments.Australian J. Bas. and Appl. Sci. 11(9): 45-51. Doi: http://dx.doi.org/10.1590/0103-8478cr20151582.
Martin TN, Simionatto CC, Bertoncelli P, Ortiz S, et al. (2010). Fitomorfologia e produção de cultivares de trigo de
duplo propósito em diferentes manejos de corte e densidades de semeadura. Cinc. Rural. 40: 1695-1701. Doi:
http://dx.doi.org/10.1590/S0103-84782010000800004.
Martin TN, Stork L, Benin G, Simionatto CC, et al. (2013). Importância da relação entre caracteres em trigo duplo
propósito no melhoramento da cultura. Biosci. J. 29: 1932-1940.
Mello R, Nörnberg JL, Rocha MG and David DB (2003). Análise produtiva e qualitativa de um híbrido de sorgo
interespecíficos submetido a dois cortes. Rev. Bras. Milho Sorgo. 2: 20-33.
Moreno JA (1961). Clima do Rio Grande do Sul. Secretaria de Agricultura, Porto Alegre.
Silveira DC, Bonetti LP, Faccioli MWF, Carvalho IR, et al. (2018). Sobressemeadura de aveia preta em azevém nativo
sob diferentes doses de nitrogênio e épocas de cortes. Tecnol. Ciên. Agropec. 12: 31-35. Steel RGD, Torrie JH,
Dickey DA (1997). Principles and procedures of statistics: a biometrical approach. 3rd edn. McGraw Hill Book, New York.
Szareski VJ, Carvalho IR, Nardino M, Demari GH, et al. (2016a). Seeding rate and physiological quality of dual purpose
wheat seeds. Afri. J. Agri. Res. 11: 4367-4374.
Szareski VJ, Carvalho IR, Nardino M, Demari GH, et al. (2016b) Ethyl Methane Sulfonate and its effects on
morphological traits of dual-purpose wheat. Int. J. Curr. Res. 8: 39707-39713.
Szareski VJ, Carvalho IR, Kehl K, Levien AM, et al. (2018). Phenotypic and predicted genetic approaches for genotype