VOLUME 7 | ISSUE 1 | 2012 | 218
Structure validity of the Three-Factor Eating
Questionnaire-R18 in Greek population
ELENI KAVAZIDOU1 , MILTIADIS PROIOS1, IOANNIS LIOLIOS2, GEORGE DOGANIS1, KATERINA
PETROU2, AGATHOKLIS TSATSOULIS2, ANNA TSILIGIROGLOU-FACHANTIDOU1
1Department of Physical Education and Sport Science, Aristotle University of Thessaloniki, Thermi, Thessaloniki, Greece
2Endocrinology Clinic of Regional Academic Hospital of Ioannina, Medical School, University of Ioannina, Greece
ABSTRACT
Kavazidou E, Proios M, Liolios I, Doganis G, Petrou K, Tsatsoulis A, Tsiligiroglou-Fachantidou A. Structure validity of the Three-Factor Eating Questionnaire-R18 in Greek population. J. Hum. Sport Exerc. Vol. 7, No. 1, pp. 218-226, 2012. The aim of the present study was to examine the factor structure of the TFEQ-R18. The project was conducted in Greek population; thus, the questionnaire was translated in Greek language. 495 males and females aged between 12-45 years old participated in the present study. There were used a series of CFA techniques for structure analysis. Confirmatory and exploratory analyses were conducted. Several criteria were used to test the hypotheses factor structures of the AIMS. The results of CFA’s showed that the R-18 item instrument had adequate psychometric properties for measuring three dimensions of eating behavior of the Greek population However these results \revealed that an R-16 item instrument was better adapted to the Greek population. The present study provided encouraging preliminary evidence supporting selected psychometric properties of the TFEQ-R18. This instrument seems to be a valid measure of the tendencies of cognitive restraint, uncontrolled eating and emotional eating of Greek population. Key words: TFEQ-R18, QUESTIONNAIRE, EATING BEHAVIOR, FACTOR STRUCTURE, GREEK POPULATION.
1 Corresponding author. Laboratory of Sports Hygiene and Nutrition, Department of Physical Education and Sport Science.
Aristotle University of Thessaloniki. Thermi, Thessaloniki, Greece. Email: [email protected]
Submitted for publication November 2010. Accepted for publication January 2012.
JOURNAL OF HUMAN SPORT & EXERCISE ISSN 1988-5202
© Faculty of Education. University of Alicante
219 | 2012 | ISSUE 1 | VOLUME 7 © 2012 University of Alicante
INTRODUCTION
Modern evidence confirms that among normal, obese and eating disordered populations different eating behavior patterns are expressed. These are consistent with restraint theory, purge opportunity and the forbidden foods hypothesis (Maus et al., 1988; Guertin, 1999).
There are different viewpoints concerning the methodology and the concept of evaluating psychological parameters of eating attitudes. As a result, several questionnaires have been developed and validated so as to examine eating behaviors (Karlsson et al., 2000; Belissle, 2009).
The most reliable questionnaires are the “Three Factor Eating Questionnaire (TFEQ)”, “Dutch Eating Behavior Questionnaire (DEBQ)” and “Restraint Scale (RS)” instruments. These instruments differ in the sense that TFEQ and RS or DEBQ and RS do not show strong relevance. Whereas TFEQ and DEBQ seem to be strongly related (Herman & Polivy, 1975; Stunkard & Messick, 1985; Van Strien et al., 1986; Belissle, 2009).
TFEQ and DEBQ have been frequently used and adapted to different populations (Hyland et al., 1989; Van Strien & Oosterveld, 2008; Bellisle, 2009). TFEQ has been studied much further in comparison to the other two questionnaires and has been adapted to normal & clinical population, to different age-groups, nations and cultures (Stunkard & Messick, 1985; French & Jeffery, 1994; Shearin et al., 1994; Karlsson et al., 2000; Atlas et al., 2002; De Lauzon et al., 2004; Bardone-Cone & Boyd, 2007; Bas et al., 2008; Yeomans et al.,
2008; Bas & Donmez, 2009). It focuses in psychological factors of eating behavior that influence the development and clinical expression of body adiposity and the status of dietary habits (Wagenknecht et al.,
2007). TFEQ continues to be widely used (Belissle, 2009).
The first version of “Three Factor Eating Questionnaire”, also known as Eating Inventory, or Stunkard-Messick Eating Questionnaire (SMEQ) was constructed in 1985 to measure three dimensions of human eating behavior in English population, with cognitive and behavioral components (Stunkard & Messick,
1985; Hyland et al., 1989; Wagenknecht et al, 1999). It is a 51-item self-assessment questionnaire, splited to 3 subscales: a 21-item dietary restraint scale (TFEQ-R), a 16-item dietary disinhibition scale (TFEQ-D) and a 14-item hunger scale (TFEQ-H). The instrument contains 36 items with a yes=no response format, 14 items on a 1 - 4 response scale and one vertical rating (Karlsson et al., 2000).
TFEQ has been validated for normal adult population (Hyland et al., 1989), adolescents (Simmons at al.,
2002) and different race populations (Bardone-Cone & Boyd, 2004). It has been translated in many languages, as English, French, Swedish, German, Dutch, Czech, Turkish and Finnish (Stunkard & Messick,
1985; Westerterp-Plantenga et al., 1999; Karlsson et al., 2000; De Lauzon et al., 2004; Wagenknecht et al.,
2007; Keskitalo et al., 2008; Bas et al., 2008; Belissle, 2009).
VOLUME 7 | ISSUE 1 | 2012 | 220 al. (2000), support that the revised instrument is a more reliable and flexible tool, appropriate for multivariation and large scale studies.
To this day, studies that have examined the factor structure of the TFEQ-R18 have been based mostly on multitrait/multi-item scaling analysis excluding factor analysis (exploratory and confirmatory analysis), examining only the relation of items for every scale separately and not the possible relation of a scale item to other scale items.
There seems to be an exception in a new study which used the exploratory factor analysis, supporting the factor structure of the TFEQ-R18 (Angle et al., 2009). Nevertheless the confirmatory analysis has been omitted from this study as well, the most appropriate in this case as there exists a priori knowledge of the number of factors (Stevens, 1996). The absence of factor analysis in examining the factor structure of the TFEQ-R18, demonstrates the significance of this present study which makes use of the above analyses.
According to de Lauzon et al. (2004) psychometric analysis of the TFEQ-R18 has shown that the items of each subscale exceed the minimum desired level for items’ convergent validity (r≥0.40, corrected for overlap). Correlations between cognitive restraint items and the other 2 scales are low (r<0.35) and
therefore all cognitive restraint items succeed in the discriminant validity test. Cronbach α for each of the 3
subscales is above 0.70 and below 0.90, as recommended for individual assessment. These coefficients are similar to those found in the study of Karlsson et al. (2000), applied in Swedish obese population.
In the present research the revised version of TFEQ was selected to be translated in Greek language, while a) TFEQ seems to be more flexible instrument among different cultures and societies and b) the revised version boosts both the convergent and discriminant validity of the primary version (51-items) and moreover is a practical tool for multivariate researches (Westerterp-Plantenga et al., 1999; Karlsson et al.,
2000; De Lauzon et al., 2004; Bas & Donmez, 2008). The purpose of the present study was to examine the factor structure of the TFEQ-R18.
MATERIAL AND METHODS
Participants
In the present study, 495 males and females aged between 12-45 years old participated. Out of the 495 individuals who agreed to participate in the study, 13 individuals were excluded from the final analysis because of many missing data in questionnaires’ items. 278 of them were students from the Aristotle University of Thessaloniki (M = 22.5, SD = 2.778) and 204 were pupils from Ioannina’s Technical Schools of Secondary Education (M = 17.77, SD = 6.154). They were orally informed about the aim of the present study and consent was solicited from them. The questionnaires were distributed twice, in a period of 2 weeks. The questionnaire completion lasted between 15-20 minutes.
Three-factor Eating Questionnaire-R18
221 | 2012 | ISSUE 1 | VOLUME 7 © 2012 University of Alicante
TFEQ-R18 refers to current dietary practice and assesses 3 different aspects of eating behaviour: restrained eating (conscious restriction of food intake in order to control body weight or to promote weight loss), uncontrolled eating (tendency to eat more than usual due to a loss of control over intake accompanied by subjective feelings of hunger), and emotional eating (inability to resist emotional cues). It is consisted of 18 items, where 9 concern uncontrolled eating, 6 restrained eating and 3 emotional eating. It responds to a 1 to 4 score system and total scores range between 18 and 72 points. As higher the score the more depended to cognition, stress or emotion the eating patterns appear.
Data Analysis
Our goal in the current study was to use CFA techniques to examine the structure of the TFEQ-R18. Nonetheless previous research results have shown that the Cognitive Restraint factor tends to split up in two or several components (Allison et al., 1992; Karlsson et al., 2000; Ricciardelli & Williams, 1997). All these have prompted us to examine this subject matter. For this reason an exploratory factor analysis (EFA) was computed using the varimax procedure on SPSS 15.0. One such analysis is designed when the correlation between the observed and latent variables is uncertain (Byrne, 2001).
Concerning the models, these were tested using confirmatory factor analyses with maximum likelihood (ML) parameter estimates in AMOS 5.0 (Arbuckle, 2003). CFAs were applied because there was a priori knowledge of the number of factors at the initial stages of the questionnaire development (Stevens, 1996). The sample size in this study was adequate to estimate the various models based on criterion, the ratio of the total sample size to the number of freely estimated parameters should be greater than 10:1 and approximating 20:1 (Kline, 2005).
Several criteria were used to test the hypotheses factor structures of the AIMS. The traditional measure of fit for CFAs models is the x2 goodness of fit test statistic. Non-significant values suggest a good fit, since they indicate only a minor discrepancy between the observed and the estimated covariance matrix. However, there is now general agreement that the x2 statistic is sensitive to sample size and violations of multivariate normality (Bollen & Long, 1992). The comparative fit index (CFI) and goodness-of-fit index (GFI) are two indexes that values greater than roughly 0.90 may indicate reasonably good fit of the researcher’s model (Hu & Bentler, 1999).
In addition, the root mean square error of approximation (RMSEA) is included here as a measure of fit. The RMSEA ≤ 0.05 indicates close approximate fit; values between .05 and .08 suggest reasonable error of approximation and RMSEA ≥ 0.10 suggests poor fit (Brown & Cudeck, 1993).
RESULTS
Pre-analysis tests for the suitability of this data set for factor analysis were computed as recommended by Comrey (1978) The Kaiser-Meyer-Olkin (KMO) measure of sampling adequacy was 0.86 and the Bartlett test of sphericity was significant at p<0.001, indicating the suitability of this data for factor analytic procedures. The ratio in these cases was 482:18 or 26.8:1, covering the preconditions determined by some factor analysts (e.g., Gorsuch, 1983; Nunnally, 1978).
VOLUME 7 | ISSUE 1 | 2012 | 222 loading more than 0.40 were considered to load one factor (Hikin, 1995). Both varimax and oblique rotations produced the same solution that appeared to represent the four-factor accounted for 55.09 per cent of the total variance. This was not the predicted solution for this study. The newfound factor came up from the separation of the Cognitive Restraint into two different subfactors. There was a high correlation between the two subfactors.
The internal consistency estimate (alpha reliability) in this study was computed separately for the three subscales of the TFEQ-R18 (Cronbach, 1951). All scales had an alpha above or very close to the recommended criterion of 0.70, except of the new factor, which had an alpha of 0.41.
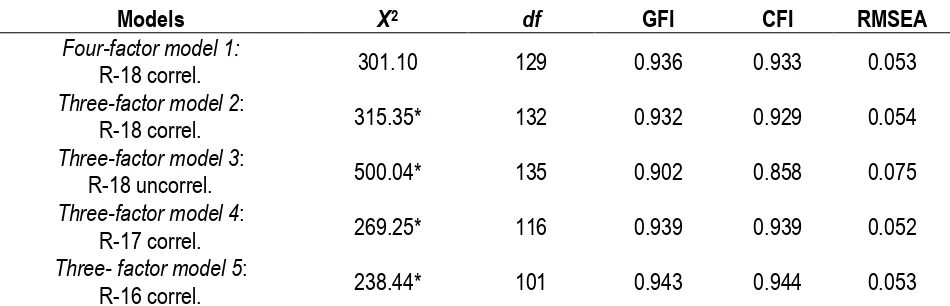
The AMOS program was used to test whether the data fit to each model (Arbuckle, 2003). Values of goodness-of fit indices for CFAs of (a) a correlated three-factor model (Mc), (b) an uncorrelated three-factor model, and (c) a correlated four-factor model are shown below (Table 1).
Table 1. Goodness of fit for the TFEQ-R18 in the Greek population.
Models X2 df GFI CFI RMSEA
Four-factor model 1:
R-18 correl. 301.10 129 0.936 0.933 0.053
Three-factor model 2:
R-18 correl. 315.35* 132 0.932 0.929 0.054
Three-factor model 3:
R-18 uncorrel. 500.04* 135 0.902 0.858 0.075
Three-factor model 4:
R-17 correl. 269.25* 116 0.939 0.939 0.052
Three- factor model 5:
R-16 correl. 238.44* 101 0.943 0.944 0.053
Note: *p<0.01, GFI= goodness-of-fit index, CFI= comparative fit index, RMSEA=root mean square error of approximation.
223 | 2012 | ISSUE 1 | VOLUME 7 © 2012 University of Alicante
Thus, the analysis was repeated excluding initially the item “(15) How frequently do you avoid ‘stocking up’ on tempting foods?” (model 4) and in continuity the item “(14) How often do you feel hungry” (model 5). Although the chi-square value was significant, all fit indices indicated satisfactory fit of both models, with model 5 developing a greater improvement in conformity indices. The estimated alpha coefficients of the cognitive restraint, uncontrolled eating and emotional eating was 0.76, 0.83 and 0.83, respectively. An association emerged between the emotion eating and uncontrolled eating (r= 0.52, p<0.01) and cognitive restraint (r= 0.21, p<0.01).
DISCUSSION
This study objective was to examine the structural validity of the Three-Factor Eating Questionnaire-R18 on Greek population. The results showed that the R-18 item instrument had adequate psychometric properties for measuring three dimensions of eating behavior of the Greek population. However these results revealed that an R-16 item instrument was better adapted to the Greek population.
Even though we originally intended the use of the confirmatory analysis alone for the three-factor solution of the R-18 instrument, previous references have led us to firstly use an exploratory factor analysis. The results of the EFA were not supportive of the three-factor solution of the TFEQ-R18 (e.g., Angle et al.,
2009; de Lauzon et al., 2004; Karlsson et al., 2000). These revealed items 15 and 16 of the cognitive restraint factor charging on a different agent and by that suggesting a four-factor solution. This outcome reinforces the assertion that Cognitive restraint factor tends to split up in two in two or several components (Allison at al., 1992; Ricciardelli & Williams, 1997). The newly-found factors which have arisen from the cognitive restraint scale separation were found strongly correlated. There was a reference of a similar result in a previous study. Karlsson’s colleagues claimed that when items correlate intensely they cannot be included in scales of different meanings.
The confirmatory analysis’ results have nonetheless confirmed the previous result revealing the existence of another solution (of the four-factor) concerning the eating behavior study of the Greek population. However, the outcome of the low internal consequence of the fourth factor in this study casts a shadow over the fourth factor model appropriateness.
In contrast this study results support that the TFEQ-R18 is a valid and reliable instrument (Angle et al.,
2009; De Lauzon, 2004; Karlsson at al., 2000). Nevertheless, in the item-scale correlation of items study for every scale separately, item 15 was strongly evident whereas item 16 of cognitive restraint scale was found inferior. A resembling reference on item 15 particularly, has been previously made (de Lauzon et al., 2004). Moreover, items 15 and 16 proved defective due to the standardized residual covariances matrix screening.
VOLUME 7 | ISSUE 1 | 2012 | 224 CONCLUSIONS
The present study provided encouraging preliminary evidence supporting selected psychometric properties of the Three-Factor Eating Questionnaire R-18. Additionally, TFEQ-R18 is favored to be a psychometrically sound and valid measure of the tendencies of cognitive restraint, uncontrolled eating and emotional eating of Greek population.
REFERENCES
1. ALLISON DA, KALINSKY LB, GORMAN BS. A comparison of the psychometric properties of three measures of dietary restraint. Psychological Assessment. 1992; 4:391-398. doi
Back to text]
2. ANGLÉ S, ENGBLOM J, ERIKSSON T, KAUTIAINEN S, SAHA M-T, LINDFORS P, LEHTINEN M, RIMPELÄ A. Three factor eating questionnaire-R18 as a measure of cognitive restraint, uncontrolled eating and emotional eating in a sample of young Finnish females. International Journal of Behavioral Nutrition and Physical Activity. 2009; 6:41. doi [Back to text]
3. ARBUCKLE J. Amos 5 [Computer Software]. Chicago: Smallwaters Corporation; 2003. [Back to text]
4. ATLAS JG, SMITH GT, HOHLSTEIN LA, MCCARTHY DM, KROLL, LS. Similarities and differences between Caucasian and African college women on eating and dieting exoectancies, bulimic symptoms, dietary restraint, and disinhibition. International Journal of Eating Disorders. 2002; 32(3):326-34. doiBack to text]
5. BARDONE-CONE AM, BOYD CA. Psychometric Properties of eating disorder instruments in Black and White young women: internal consistency, temporal stability, and validity. Psychological
Assessment. 2007; 19(3):356-362. doiBack to text]
6. BAS M, BOZAN N, CIGERIM N. Dieting, dietary restraint, and binge eating disorder among overweight adolescents in Turkey. Journal of Adolescence. 2008; 43(171):635-48. Back to text]
7. BAS M, DONMEZ S. Self-efficacy and restrained eating in relation to weight loss among overweight men and women in Turkey. Applet. 2009; 52(1):209-16. Back to text]
8. BELLISLE F. [Assessing various aspects of the motivation to eat that can affect food intake and body weight control]. Journal Encephale. 2009; 35(2):182-5. doi [Back to text]
9. BENTLER PM. EQS: Structural equations program manual. Encino, CA: Multivariate Software, Inc; 1995. [Back to text]
10. BOLLEN KA, LONG JS. Tests for structural equation models. International Journal of Social Research Methodology. 1992; 21:123-131. Back to text]
11. BROWN MW, CUDECK R. Alternative ways of assessing model fit. In: Bollen KA, Long JS, editors. Testing structural equation models (p. 136-162). Newbury Park, CA: Sage Publication, Inc; 1993. [Back to text]
12. BYRNE BM. Structural equation modeling with AMOS. Basic concepts, applications, and programming. Mahwah, NJ: Lawrence Erlbaum; 2001. [Back to text]
13. CATTELL RB. The scientific use of factor analysis in behavioral and life sciences. New York: Plenum Press; 1978. [Back to text]
225 | 2012 | ISSUE 1 | VOLUME 7 © 2012 University of Alicante
15. COMREY A. Common methodological problems in factor analytical studies’. Journal of Consulting and Clinical Psychology. 1978; 46:648-659. doiBack to text]
16. CRONBACH LJ. Coefficient alpha and the internal structure of tests. Psychometrika. 1951;
16:296-334. doiBack to text]
17. DE LAUZON B, ROMON M, DESCHAMPS V, LAFAY JB, KARLSSON J, DUCIMETIERE P, CHARLES MA & THE FLEURBAIX LAVENTIE VILLE SANTE STUDY GROUP (FLVS). The Three-Factor Eating Questionnaire-R18 is able to distinguish among different eating patterns in a general population. Journal of Nutrition. 2004; 134(9):2372-80. Back to text]
18. FRENCH SA, JEFFERY RW. Consequences of dieting to lose weight: effects on physical and mental health. Journal of Health Psychology. 1994; 13(3):195-212. doi
Back to text]
19. GORSUCH RL. Factor analysis. Hillsdale, NL: Lawrence Erlbaum; 1983. [Back to text]
20. GUERTIN TL. Eating behavior of bulimics, self-identified binge eaters, and non-eating-disordered individuals: what differentiates these populations? Clinical Psychology Review. 1999; 19(1):1-23.
doiBack to text]
21. HERMAN CP, POLIVY J. Anxiety, restraint, and eating behavior. Journal of Abnormal Psychology.
1975; 84:666-672. doiBack to text]
22. HINKIN TR. A review of scale development practices in the study of organizations. Journal
Management. 1995; 21(5):967-988. doiBack to text]
23. HU L, BENTLER PM. Cutoff criteria for fit indexes in covariances structure analysis: Conventional criteria versus new alternatives. Structural Equation Modeling. 1999; 6(1):1-55.
doiBack to text]
24. HYLAND ME, IRVINE SH, THACKER C, DANN PL, DENNIS I. Psychometric analysis of the Stunkard-Messick Eating Questionnaire (SMEQ) and comparison with the Dutch Eating Behavior Questionnaire (DEBQ). Current Psychology: Research and Reviews. 1989; 8:228-233. [Back to text]
25. KARLSSON J, PERSSON LO, SJOSTROM L, SULLIVAN M. Psychometric properties and factor structure of the Three-Factor Eating Questionnaire (TFEQ) in obese men and women. Results from the Swedish Obese Subjects (SOS) study. International Journal of Obesity and Related Metabolic Disorders. 2000; 24:1715-1725. doiBack to text]
26. KESKITALO K, TUORILA H, SPECTOR TD, CHERKAS LF, KNAAPILA A, KAPRIO J, SILVENTOINEN K, PEROLA, M. The Three-Factor Eating Questionnaire, body mass index, and responses to sweet and salty fatty foods: a twin study of genetic and environmental associations. The American Journal of Clinical Nutrition. 2008; 88(2):263-71. Back to text]
27. Kline RB. Principles and practice of structural equation modeling (2nd ed). New York: The Guilford Press; 2005. [Back to text]
28. MAUS N, PAUL T, PUDEL V, WESTENHÖFER J. Behavioural factors involved in the control of food intake in man. [Review]. International Journal for Vitamin and Nutrition Research. 1988; 8(3):356-66. Back to text]
29. NUNNALLY J. Psychometric theory (2nd ed). New York: McGraw Hill; 1978. [Back to text]
30. RICCIARDELLI LA, WILLIAMS RJ. A two-factor model of dietary restraint. Journal of Clinical
Psychology. 1997; 53:123-131. doi
Back to text]
31. SHEARIN EN, RUSS MJ, HULL JW, CLARKIN JF, SMITH GP. Construct validity of the Three-Factor Eating Questionnaire: flexible and rigid control subscales. International Journal of Eating
Disorders. 1994; 16(2):187-198. doi
VOLUME 7 | ISSUE 1 | 2012 | 226 32. SIMMONS JR, SMITH GT, HILL KK. Validation of eating and dieting expectancy measures in two
adolescenet samples. International Journal of Eating Disorders. 2002; 31(4):461-473.
doiBack to text]
33. STEVENS J. Applied multivariate statistics for the social sciences. Mahwah, NJ: Lawrence Erbaum; 1996. [Back to text]
34. STUNKARD AJ, MESSICK S. The Three-Factor Eating Questionnaire to Measure Dietary Restraint, Disinhibition and Hunger. Journal of Psychosomatic Research. 1985; 29(1):71-83.
doiBack to text]
35. VAN STRIEN T, FRIJTERS JER, BERGERS GPA, DEFARES, PB. The Dutch Eating Behavior Questionnaire (DEBQ) for assessment of restrained, emotional, and external eating behavior.
International Journal of Eating Disorders. 1986; 5:295-315. doi
Back to text]
36. VAN STRIEN T, OOSTERVELD P. The children's DEBQ for assessment of restrained, emotional, and external eating in 7- to 12-year-old children. International Journal of Eating Disorders. 2008; 41(1):72-81. doiBack to text]
37. WAGENKNECHT M, HAINER V, KUNESOVÁ M, BELLISLE F, PARÍZKOVÁ J, BRAUNEROVÁ R, HILL M, LAJKA J. [Relationships between the "eating inventory" factors, socioeconomic status, anthropometric body adiposity indexes and health risks in Czech population]. Casopis Lekaru Ceskych. 2007; 146(3):284-6, 287-91. Back to text]
38. WESTERTERP-PLANTENGA MS, ROLLAND V, WILSON SA, WESTERTERP KR. Satiety related to 24 h diet-induced thermogenesis during high protein/carbohydrate vs. high fat diets measured in a respiration chamber. European Journal of Clinical Nutrition. 1999; 53:495-502.
doiBack to text]
39. YEOMANS MR, LEITCH M, MOBINI S. Impulsivity is associated with the disinhibition but not restraint factor from the Three Factor Eating Questionnaire. Appetite. 2008; 50(2-3):469-76. Back to text]