DEVELOPMENT AND VALIDATION OF STABILITY
INDICATING RP-HPLC METHOD FOR
LEVONORGESTREL IN PHARMACEUTICAL DOSAGE
FORM.
1*DIXIT HETAL B., 2SINGH SHWETA D., 3BALDANIYA SUNIL L., 4SHAH DIMAL
A., 5MEHTA FALGUN A., 6CHHALOTIYA USMANGANI K.
1
Department of Pharmceutical Analysis, IndukakaIpcowala College of Pharmacy, New VallabhVidyanagar, Gujarat, India.
Date Received:
25-Jun -2014
Date of Accepted:
5-Jul -2014
Date Published:
13-Jul-2014
553
Abstract:
Reverse Phase-High Performance Liquid Chromatography (RP-HPLC) method have been developed and validated for the estimation of levonorgestrel in Bulk drug and Pharmaceutical dosage form. The developed method is rapid, accurate, precise, simple and economical. The separation was carried out using Hypersil ODS C-18 (125 mm × 4.6 mm 5 µ particle size) , in isocratic mode, with mobile phase containing Acetonitrile: water (50:50, v/v). The flow rate is 1 ml / min and effluents are monitored at 243 nm. Chromatogram showed peak at a retention time of 4.3 min for levonorgestrel. The method is validated for system suitability, linearity, precision, accuracy specificity, ruggedness, robustness, LOD and LOQ. The calibration plot showed good linear relationship with r2 = 0.9999, in the concentration range of 1.2 -9.0 µg/ml. LOD and LOQ were found to be 0.12 µg/ml and 0.38 µg/ml. Accuracy was found to be between 98.88-100.37 %. The drug undergoes degradation in acid, alkali, oxidation, etc. conditions. It can be employed as a stability indicating method.
Keywords:
Levonorgestrel (LNG), Stability indicating method, Validation and Rp-HPLC
.
Introduction
Levonorgestrel (13β-ethyl-17β -hydroxy-18,19-dinor-17α-pregn-4-en-20-yn-3-one)is aContraceptive having molecular weight 312.45[1-5]. It is used for the treatment of menopausal and postmenopausal disorders and alone or in combination with other hormones as an oral contraceptive. It binds to the progesterone and estrogen receptors. Target cells include the female reproductive tract, the mammary gland, the hypothalamus, and the pituitary. Once bound to the receptor, progestins like levonorgestrel will slow the frequency of release of gonadotropin releasing
hormone (GnRH) from the hypothalamus and blunt the pre-ovulatory LH (luteinizing hormone) surge[6, 7]
554
INSTRUMENTS, MATERIAL AND REAGENTS
INSTRUMENTS:
HPLC(DionexUltiMate3000) is used with column
Hypersil ODS C-18 (125 mm × 4.6 mm 5 µ particle size)
.DAD-3000RS detector was used. Analytical balance was New Classic MF (model - ML203E/A01, Switzerland). Filter of 0.45 µ Nylon Membrane Filter was used. The OsworldPhotostability Chamber (Model:
OPSH S/G-4) and The Osworld Stability
Chamber(model -OSC S/G-4) was used.
MATERIAL:
Levonorgestrel (API) was obtained as a gift sample from Famy Care Ltd., Ahmedabad.
REAGENTS: All the reagents used were of AR grade.
Selection of Detection Wavelength
In the present study, drug solution of LNG (10µg/ml)
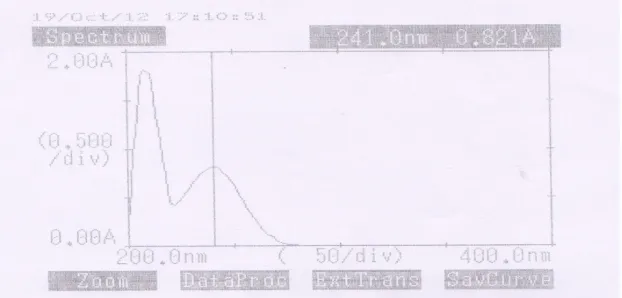
was prepared in methanol. This drug solution was then scanned in the UV region of 200-400 nm and the overlain spectrum was recorded(Fig. 1).
The drug solution LNG (6 µg/ml) was prepared in
diluent and chromatogram was taken by HPLC with PDA detector in 3D region of 200-400 nm to check absorbance maximum of LNG (Fig. 2).
Selection of chromatographic condition
Proper selection of the HPLC method depends upon the nature of the sample (ionic, ionizable or neutral molecule), its molecular weight and solubility. The drug selected for the present study is polar in nature and hence either reversed phase or ion-pair or ion-exchange chromatography can be used. Reversed phase HPLC was selected for the initial separations because of its simplicity and suitability.
To optimize the chromatographic conditions, the effect of chromatographic variables such as mobile phase pH, flow rate, and solvent ratio were studied. The resulting chromatograms were recorded and the chromatographic parameters such as capacity factor, asymmetric factor and column efficiency were calculated. The conditions that gave the best resolution, symmetry and capacity factor were selected for estimation.
Selection of Mobile phase
The standard solution LNG (6µg/ml) was
chromatographed with different mobile
phasecomposition at a flow rate of 1ml/min.
1) Methanol : water (50:50, v/v)
2) Methanol : water (60:40, v/v)
3) Methanol : water (70:30, v/v)
4) Acetonitrile : water (30:70, v/v)
5) Acetonitrile: water (50:50, v/v)
Selection of flow rate of mobile phase
After numbers of trial (from 0.9 to 1.1 ml/min), flow rate of mobile phase 1 ml/min was selected.
Preparation of Mobile Phase
HPLC grade water and acetonitrile were taken in separate reservoir (bottle), degassed and used as mobile phase in ratio of (50:50, v/v) in binary system.
Preparation of standard stock solution (LNG 60µg/ml)
LNG (6.0 mg) was weighed accurately and transferred to 100 ml volumetric flask. Diluent(80 ml) was added to volumetric flask and sonicated for 10 min.Then volume was made upto mark with diluent to obtain LNG
(60µg/ml) stock solution.
Preparation of sample solution (LNG 6 µg/ml) Twenty tablets were weighed and crushed. Powder equivalent to wt. of one tablet (100 mg) of LNG was transferred to 10 ml of volumetric flask containing 5 ml of diluent and sonicated for 10 min. The flask was cooled to room temperature and volume was made upto the mark with diluent. Above solution was filtered using 0.45 µ Nylon membrane filter. Filtered solution(8 ml) was taken and transferred to volumetric flask (10 ml) and volume was made upto the mark with diluent to give a
solution containing LNG (6.0µg/ml).
FORCED DEGRADATION STUDY[9, 10]
For force degradation study, pure active pharmaceutical ingredient (API), tablet placebo and tablet of LNG was subjected to various stress conditions. Stress studies were carried out under the conditions of acid/base hydrolysis, oxidation, thermal, humidity as mentioned in ICH Q1A (R2).
1. Acidic degradation Procedure
For API:
LNG (7.5mg) was weighed and transferred to 200 ml volumetric flask. To volumetric flask, 1N HCl (20 ml)was added and flask was kept in water bath at 100ºC for 2 hours.After 2 hrs, flask was cooled and solution was neutralized by adding 20.0 ml of 1N NaOH solution. 100 ml of diluent was added to volumetric flask and the flask was sonicated for about 45 minutes with intermittent shaking after every 15 minutes. The flask was allowed to cool to room temperature and volume was made upto the mark with diluent. The solution was centrifuged at 4000 rpm for 10 minutes. Supernant solution (4 ml) was transferred to a 25 ml volumetric flask and diluted upto mark with diluent, mixed well and injected into the chromatograph.
For Placebo:
555
to 200 ml volumetric flask. To volumetric flask, 1N HCl (20ml) was added and flask was kept in water bath at 100ºC for 2 hours. After 2 hrs,flask was cooled and solution was neutralized by adding 20.0 ml of 1N NaOH solution. 100 ml of diluent was added to volumetric flask and the flask was sonicated for about 45 minutes with intermittent shaking after every 15 minutes. The flask was allowed to cool to room temperature and volume was made upto the mark with diluent. The solution was centrifuged at 4000 rpm for 10 minutes. Supernant solution (4 ml) was transferred to a 25 ml volumetric flask and diluted uptomark with diluent, mixed well and injected into the chromatograph.
For Tablets:
Ten intact tablets were weighed and transferred to 200 ml volumetric flask. To volumetric flask, 1N HCl(20 ml) was added and flask was kept in water bath at 100ºC for 2 hours. After 2 hrs, flask was cooled and solution was neutralized by adding 20.0 ml of 1N NaOH solution. 100 ml of diluent was added to volumetric flask and the flask was sonicated for about 45 minutes with intermittent shaking after every 15 minutes. The flask was allowed to cool to room temperature and volume was made upto the mark with diluent. The solution was centrifuged at 4000 rpm for 10 minutes. Supernant solution (4 ml) was transferred to a 25 ml volumetric flask and diluted upto mark with diluent, mixed well and injected into the chromatograph.
2. Alkali Degradation
Procedure For API:
LNG (7.5 mg) was weighed and transferred to 200 ml volumetric flask. To volumetric flask, 1N NaOH (20 ml) was added and flask was kept in water bath at 100ºC for 5 minutes. After 5 mins., flask was cooled and solution was neutralized by adding 20.0 ml of 1N HCl solution. 100 ml of diluent was added to volumetric flask and the flask was sonicated for about 45 minutes with intermittent shaking after every 15 minutes. The flask was allowed to cool to room temperature and volume was made upto the mark with diluent. The solution was centrifuged at 4000 rpm for 10 minutes. Supernant solution (4 ml) was transferred to a 25 ml volumetric flask and diluted upto mark with diluent, mixed well and injected into the chromatograph.
For Placebo:
Ten intact placebo tablets were weighed and transferred to 200 ml volumetric flask. To volumetric flask, 1N NaOH (20 ml) was added and flask was kept in water bath at 100ºC for 5 minutes. After 5 mins., flask was cooled and solution was neutralized by adding 20.0 ml of 1N HCl solution. 100 ml of diluent was added to volumetric flask and the flask was sonicated for about 45 minutes with intermittent shaking after every 15
minutes. The flask was allowed to cool to room temperature and volume was made upto the mark with diluent. The solution was centrifuged at 4000 rpm for 10 minutes. Supernant solution (4 ml) was transferred to a 25 ml volumetric flask and diluted upto mark with diluent, mixed well and injected into the chromatograph.
For Tablets:
Ten intact tablets were weighed and transferred to 200 ml volumetric flask. To volumetric flask, 1N NaOH (20 ml) and kept in water bath at 100ºC for 5 minutes. After 5 mins., flask was cooled and solution was neutralized by adding 20.0 ml of 1N HCl solution. 100 ml of diluent was added to volumetric flask and the flask was sonicated for about 45 minutes with intermittent shaking after every 15 minutes. The flask was allowed to cool to room temperature and volume was made upto the mark with diluent. The solution was centrifuged at 4000 rpm for 10 minutes. Supernant solution (4 ml) was transferred to a 25 ml volumetric flask and diluted upto mark with diluent, mixed well and injected into the chromatograph.
3. Peroxide Degradation
Procedure For API:
LNG (7.5 mg) was weighed and transferred to 200 ml
volumetric flask. To volumetric flask, 30% H2O2 (20 ml)
was added and flask was kept in water bath at 100ºC for 5 minutes. After 5 mins.,flask was cooled and 100 ml of diluent was added to volumetric flask and the flask was sonicated for about 45 minutes with intermittent shaking after every 15 minutes. The flask was allowed to cool to room temperature and volume was made upto the mark with diluent. The solution was centrifuged at 4000 rpm for 10 minutes. Supernant solution (4 ml) was transferred to a 25 ml volumetric flask and diluted upto mark with diluent, mixed well and injected into the chromatograph.
For Placebo:
Ten intact placebo tablets were weighed and transferred to 200 ml volumetric flask. To volumetric flask, 30%
H2O2(20 ml) was added and flask was kept in water bath
at 100ºC for 5 minutes. After 5 mins., flask was cooled and 100 ml of diluent was added to volumetric flask and the flask was sonicated for about 45 minutes with intermittent shaking after every 15 minutes. The flask was allowed to cool to room temperature and volume wasmade upto the mark with diluent. The solution was centrifuged at 4000 rpm for 10 minutes. Supernant solution (4 ml) was transferred to a 25 ml volumetric flask and dilutedupto mark with diluent, mixed well and injected into the chromatograph.
For Tablets:
Ten intact tablets were weighed and transferred to 200 ml volumetric flask. To volumetric flask, 30% H2O2(20
556
for 5 minutes. After 5 mins.,flask was cooled and 100 ml of diluent was added to volumetric flask and the flask was sonicated for about 45 minutes with intermittent shaking after every 15 minutes. The flask was allowed to cool to room temperature and volume was made upto the mark with diluent. The solution was centrifuged at 4000 rpm for 10 minutes. Supernant solution (4 ml) was transferred to a 25 ml volumetric flask and diluted upto mark with diluent, mixed well and injected into the chromatograph.
4. Thermal Degradation Procedure
API, Placebo sample and Tablets were spread in 1 mm thickness uniform layer on a petridish and exposed to heat at 105°C for about 48 hours.
For API:
After exposure to the degradation condition, LNG (7.5 mg) was weighed and transferred to 200 ml volumetric flask. To volumetric flask, diluent (160 ml) was added and the flask was sonicated for about 45 minutes with intermittent shaking after every 15 minutes. The flask was allowed to cool to room temperature and volume wasmade upto the mark with diluent. The solution was centrifuged at 4000 rpm for 10 minutes. Supernant solution (4 ml) was transferred to a 25 ml volumetric flask and diluted upto mark with diluent, mixed well and injected into the chromatograph.
For Placebo:
After exposure to the degradation condition, ten intact placebo tablets were weighed and transferred to 200 ml volumetric flask. To volumetric flask, diluent (160 ml) was added and the flask was sonicated for about 45 minutes with intermittent shaking after every 15 minutes. The flask was allowed to cool to room temperature and volume wasmade upto the mark with diluent. The solution was centrifuged at 4000 rpm for 10 minutes. Supernant solution (4 ml) was transferred to a 25 ml volumetric flask and diluted upto mark with diluent, mixed well and injected into the chromatograph.
For Tablets:
After exposure to the degradation condition, ten intact tablets were weighed and transferred to 200 ml volumetric flask. To volumetric flask, diluent (160 ml) was added and the flask was sonicated for about 45 minutes with intermittent shaking after every 15 minutes. The flask was allowed to cool to room temperature and volume was made upto the mark with diluent. The solution was centrifuged at 4000 rpm for 10 minutes. Supernant solution (4 ml) was transferred to a 25 ml volumetric flask and diluted upto mark with diluent, mixed well and injected into the chromatograph.
5. Photolytic Degradation
Procedure
API, Placebo sample and tablets were spread in 1 mm thickness uniform layer on a petridish and exposed to the light of energy 1.2 million lux/hours and 200 watt
hours/m2 in photo stability chamber.
For API:
After exposure to the degradation condition, LNG (7.5 mg) was weighed and transferred to 200 ml volumetric flask. To volumetric flask, diluent (160 ml) was added and the flask was sonicated for about 45 minutes with intermittent shaking after every 15 minutes. The flask was allowed to cool to room temperature and volume was made upto the mark with diluent. The solution was centrifuged at 4000 rpm for 10 minutes. Supernant solution (4 ml) was transferred to a 25 ml volumetric flask and diluted upto mark with diluent, mixed well and injected into the chromatograph.
For Placebo sample:
After exposure to the degradation condition, ten intact placebo tablets were weighed and transferred to 200 ml volumetric flask. To volumetric flask, diluent (160 ml) was added and the flask was sonicated for about 45 minutes with intermittent shaking after every 15 minutes. The flask was allowed to cool to room temperature and volume was made upto the mark with diluent. The solution was centrifuged at 4000 rpm for 10 minutes. Supernant solution (4 ml) was transferred to a 25 ml volumetric flask and diluted upto mark with diluent, mixed well and injected into the chromatograph.
For Tablets:
After exposure to the degradation condition, ten intact tablets were weighed and transferred to 200 ml volumetric flask. To volumetric flask, diluent (160 ml) was added the flask was sonicated for about 45 minutes with intermittent shaking after every 15 minutes. The flask was allowed to cool to room temperature and volume was made upto the mark with diluent. The solution was centrifuged at 4000 rpm for 10 minutes. Supernant solution (4 ml) was transferred to a 25 ml volumetric flask and diluted upto mark with diluent, mixed well and injected into the chromatograph.
6. Humidity Degradation Procedure
API, Placebo sample and tablets were spread in 1 mm thickness uniform layer on a petridish and exposed to humidity at 40°C/75%RH for one week in the stability chamber.
For API:
557
intermittent shaking after every 15 minutes. The flask was allowed to cool to room temperature and volume was made upto the mark with diluent. The solution was centrifuged at 4000 rpm for 10 minutes. Supernant solution (4 ml) was transferred to a 25 ml volumetric flask and diluted upto mark with diluent, mixed well and injected into the chromatograph.
For Placebo:
After exposure to the degradation condition, ten intact placebo tablets were weighed and transferred to 200 ml volumetric flask. To volumetric flask, diluent (160 ml) was added and the flask was sonicated for about 45 minutes with intermittent shaking after every 15 minutes. The flask was allowed to cool to room temperature and volume was made upto the mark with diluent. The solution was centrifuged at 4000 rpm for 10 minutes. Supernant solution (4 ml) was transferred to a 25 ml volumetric flask and diluted upto mark with diluent, mixed well and injected into the chromatograph.
For Tablets:
After exposure to the degradation condition, ten intact tablets were weighed and transferred to 200 ml volumetric flask. To volumetric flask, diluent (160 ml) was added and the flask was sonicated for about 45 minutes with intermittent shaking after every 15 minutes. The flask was allowed to cool to room temperature and volume was made upto the mark with diluent. The solution was centrifuged at 4000 rpm for 10 minutes. Supernant solution (4 ml) was transferred to a 25 ml volumetric flask and diluted to volume with diluent, mixed well and injected into the chromatograph.
VALIDATION OF THE DEVELOPED STABILITY
INDICATING ASSAY METHOD BY RP-HPLC[13]
1. SPECIFICITY
Procedure: Blank preparation, placebo preparation, standard preparation and sample preparation for LNG tablet were prepared.
Peak purity plot of LNG (6µg/ml) was taken to show
analyte chromatographic peak is not attributable to more than one component.
2. LINEARITY AND RANGE
The linearity was determined at six levels over the range of 20% to 150% of sample concentration.
Appropriate aliquots of standard stock solution were taken in 50 ml volumetric flask and volume was made upto the mark to obtain concentration in range of 1.2 to 9.0 µg/ml
The above linearity solutions were injected at each level in duplicate. Mean area at each level was calculated and a graph of mean area (y-axis) versus concentration in % (x-axis) was plotted. The value of correlation co-efficient The limit of detection (LOD) of the drug was calculated
(r), y-intercept & slope of regression line also recorded.
3. ACCURACY
The accuracy of the method was determined by calculating recoveries of LNG by method of standard additions. Known amount of LNG (0%, 50%, 100% & 150%) were added to a pre quantified sample solution, and the amount of LNG was estimated by measuring the peak areas and by fitting these values to the straight-line equation of calibration curve.
4. PRECISION Repeatability
Sample solution of LNG (6µg/ml) was prepared and
chromatograms were recorded for 6 replicate injections of same concentration. Area was measured of the same concentration solution six times and RSD was calculated.
Intra-day Precision
Standard solutions of LNG (3, 6 and 9 µg/ml) were
prepared and chromatograms were recorded, variations of results within the same day (intra- day) were analyzed.
Intra-day precision was determined by analyzing LNG for three times in the same day.
Intermediate Precision (Inter-day precision)
Standard solutions of LNG (3, 6 and 9 µg/ml) were
prepared and chromatograms were recorded, variations of results between days (inter- day) were analyzed. Inter-day precision was determined by analyzing LNG daily for three days.
5. ROBUSTNESS
Robustness of test method was checked by injecting three replicate injections of LNG (6 µg/ml) with ± 1 % change in flow rate, with ± 5% change in mobile phase ratio, ± 1 % change in detection wavelength and ± 5% change in column oven temperature.
6. SOLVENT STABILITY STUDY
Standard and sample preparation of LNG (6 µg/ml) was
prepared as per test procedure mention in (4.3.7 & 4.3.8). The standard and sample preparations were analyzed by HPLC system at regular intervals for 24 hrs.
The area of the analyte peak for both standard and sample solutions was monitored. The % analyte peak area from initial for both standard and sample solutions were calculated and absolute % difference was recorded.
7. LIMIT OF DETECTION
From the linearity curve equation, the standard deviation (SD) of the intercepts (response) was calculated. Then LOD was measured by using mathematical expressions given in section.
558
by using the following equations designated by International Conference on Harmonization (ICH) guideline:
LOD = 3.3 X σ/S,
Where, σ = the standard deviation of the response
S = slope of the calibration curve.
8. LIMIT OF QUANTIFICATION
From the linearity curve equation, the standard deviation (SD) of the intercepts (response) was calculated. Then LOQ was measured by using mathematical expressions given in section.
The limit of quantification (LOQ) of the drug was calculated by using the following equations designated by International Conference on Harmonization (ICH) guideline:
LOQ = 10 X σ/S
Where, σ = the standard deviation of the response
S = slope of the calibration curve.
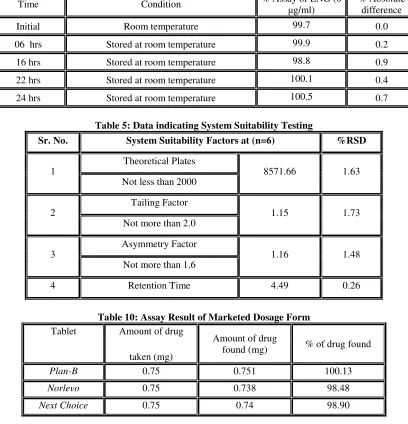
9. SYSTEM SUITABILITY TESTING
System suitability was performed and calculated at the start of study of each validation parameter. The values of system suitability results obtained during the entire study were recorded.
RESULT AND DISCUSSION:
UV overlain spectra showed the drug absorbs appreciably at about 241 nm (Fig 1) and peak purity plot show absorbance maximum at 243 nm in chromatogram by PDA detector. So 243 nm was chosen as detection wavelength for liquid chromatography (Fig. 2).
For the selection of mobile phase, various mobile phase systems containing various proportions of methanol, water and acetonitrile were tried at a flow rate of 1.0 ml/min and the chromatograms were recorded. Details of which are as follows:
6) Methanol : water (50:50, v/v)
7) Methanol : water (60:40, v/v)
8) Methanol : water (70:30, v/v)
9) Acetonitrile : water (30:70, v/v)
10) Acetonitrile : water (50:50, v/v)
Finally the system Acetonitrile : water (50:50, v/v) was found to be satisfactory as it gave well symmetric peak for LNG (Fig. 3). The retention time for LNG was 4.3 min.
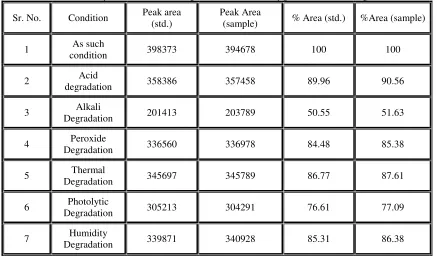
Forced degradation study was performed according to ICH guideline.
1. Acid degradation
in 1N HCl at 100°C for 2 hours.
In tablet sample, 9.4% degradation of LNG was observed in 1N HCl at 100°C for 2 hours (Fig. 4) (Table 1).
In placebo sample, no significant peak was observed (Fig. 5).
2. Alkali degradation
In API sample, 49.4% degradation of LNG was observed in 1N NaOH at 100°C for 5 min.
In tablet sample, 48.4% degradation of LNG was observed in 1N NaOH at 100°C for 5 min (Fig. 6) (Table 1).
In placebo sample, no significant peak was observed (Fig. 7).
3. Peroxide degradation
In API sample, 15.5% degradation of LNG was observed
in 30% H2O2 at 100°C for 5 min.
In tablet sample, 14.6% degradation of LNG was
observed in 30% H2O2 at 100°C for 1 min (Fig. 8) (Table
1).
In placebo sample, no significant peak was observed. (Fig. 9)
4. Thermal degradation
In API sample, 13.2% degradation of LNG was observed when exposed to heat at 105°C for about 48 hours. In tablet sample, 12.3% degradation of LNG was observed when exposed to heat at 105°C for about 48 hours (Fig. 10) (Table 1).
In placebo sample, no significant peak was observed (Fig. 11).
5. Photolytic degradation
In API sample, 23.4% degradation of LNG was observed when exposed to the light of energy 1.2 million
lux/hours and 200 watt hours/m2 in photo stability
chamber.
In tablet sample, 22.9% degradation of LNG was observed when exposed to the light of energy 1.2 million
lux/hours and 200 watt hours/m2 in photo stability
chamber (Fig. 12) (Table 1).
In placebo sample, no significant peak was observed (Fig. 13).
6. Humidity degradation
In API sample, 14.6% degradation of LNG was observed when exposed to humidity at 40°C/75%RH for one week in the stability chamber.
559
Figure 1: UV Spectrum of LNG (10 µg/ml) in methanol
Figure 2: Chromatogram of LNG (6 µg/ml) in acetonitrile : water (50:50, v/v) by PDA detector
Figure 3: Chromatogram of LNG (6 µg/ml) using acetonitrile : water (50:50, v/v)
560
Figure 5: Chromatogram of acid degraded placebo sample of LNG
Figure 6: Chromatogram of alkali degraded tablet sample of LNG (6 µg/ml)
Figure 7: Chromatogram of alkali degraded placebo sample of LN
561
Figure 9: Chromatogram of peroxide degraded placebo sample of LNG
Figure 10: Chromatogram of Thermal degraded tablet sample of LNG (6 µg/ml)
Figure 11: Chromatogram of Thermal degraded placebo sample of LNG
562
Figure 13: Chromatogram of Photolytic degraded placebo sample of LNG
Figure 14: Chromatogram of Humidity degraded tablet sample of LNG (6 µg/ml)
Figure 15: Chromatogram of Humidity degraded placebo sample of LNG
Figure 16: Peak Purity Plot of LNG
563
Figure 17: Calibration curve of LNG at 243nm The developed HPLC method was validated..
Table 1: Data of % Recovery of standard & sample solution (LNG 6 µg/ml) at Forced Degradation Condition
Sr. No. Condition Peak area
(std.)
Peak Area
(sample) % Area (std.) %Area (sample)
1 As such
condition 398373 394678 100 100
2 Acid
degradation 358386 357458 89.96 90.56
3 Alkali
Degradation 201413 203789 50.55 51.63
4 Peroxide
Degradation 336560 336978 84.48 85.38
5 Thermal
Degradation 345697 345789 86.77 87.61
6 Photolytic
Degradation 305213 304291 76.61 77.09
7 Humidity
Degradation 339871 340928 85.31 86.38
y = 65251x + 4021.
R² = 0.999
0
100000
200000
300000
400000
500000
600000
700000
0
5
10
Mean Peak
Area
Concentration
P
e
a
k
564
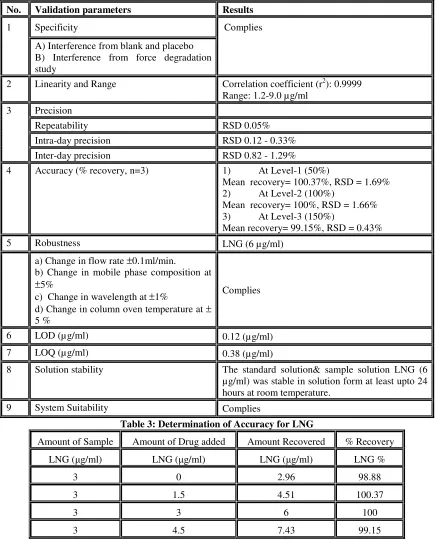
Table 2: Summary of Validation Parameters
No. Validation parameters Results
1 Specificity Complies
A) Interference from blank and placebo B) Interference from force degradation study
2 Linearity and Range Correlation coefficient (r2): 0.9999
Range: 1.2-9.0 µg/ml
3 Precision
Repeatability RSD 0.05%
Intra-day precision RSD 0.12 - 0.33%
Inter-day precision RSD 0.82 - 1.29%
4 Accuracy (% recovery, n=3) 1) At Level-1 (50%)
Mean recovery= 100.37%, RSD = 1.69%
2) At Level-2 (100%)
Mean recovery= 100%, RSD = 1.66%
3) At Level-3 (150%)
Mean recovery= 99.15%, RSD = 0.43%
5 Robustness LNG (6 µg/ml)
a) Change in flow rate ±0.1ml/min.
b) Change in mobile phase composition at
±5%
c) Change in wavelength at ±1%
d) Change in column oven temperature at ±
5 %
Complies
6 LOD (µg/ml) 0.12 (µg/ml)
7 LOQ (µg/ml) 0.38 (µg/ml)
8 Solution stability The standard solution& sample solution LNG (6
µg/ml) was stable in solution form at least upto 24 hours at room temperature.
9 System Suitability Complies
Table 3: Determination of Accuracy for LNG
Amount of Sample Amount of Drug added Amount Recovered % Recovery
LNG (µg/ml) LNG (µg/ml) LNG (µg/ml) LNG %
3 0 2.96 98.88
3 1.5 4.51 100.37
3 3 6 100
565
Table 4: Data indicating Solution Stability for LNG (6µg/ml) at different time interval
Time Condition % Assay of LNG (6
µg/ml)
% Absolute difference
Initial Room temperature 99.7 0.0
06 hrs Stored at room temperature 99.9 0.2
16 hrs Stored at room temperature 98.8 0.9
22 hrs Stored at room temperature 100.1 0.4
24 hrs Stored at room temperature 100.5 0.7
Table 5: Data indicating System Suitability Testing
Sr. No. System Suitability Factors at (n=6) %RSD
1
Theoretical Plates
8571.66 1.63
Not less than 2000
2
Tailing Factor
1.15 1.73
Not more than 2.0
3
Asymmetry Factor
1.16 1.48
Not more than 1.6
4 Retention Time 4.49 0.26
Table 10: Assay Result of Marketed Dosage Form
Tablet Amount of drug
taken (mg)
Amount of drug
found (mg) % of drug found
Plan-B 0.75 0.751 100.13
Norlevo 0.75 0.738 98.48
566
The method was found to be specific as no interference observed at the retention time of analyte peak when the drug was estimated in presence of excipients. Peak purity plot was shown in Fig 16.
Accuracy was determined by calculating the recovery. The method was found to be accurate with % recovery 98.88% – 100.37% LNG (Table 3).
Precision was calculated as repeatability, intra-day and inter-day variation for LNG. The method was found to be precise with % RSD 0.12 - 0.33 for intra-day (n=3) and % RSD 0.82 – 1.29 for inter-day (n=3) precision for LNG (Table 2).
Robustness of the method was performed by ± 0.1 %
change in flow rate, ± 5% change in organic phase of
mobile phase, ± 1% change in detection wavelength and
± 5% change in column oven temperature for LNG (6
µg/ml) (Table 2).
The method was also rugged as there was no change in area up to 24 hours of preparation of solution in mobile phase (Table 4).
The LOD and LOQ for LNG was found to be 0.12
(µg/ml) and 0.38 (µg/ml) respectively. Summary of
validation parameters was tabulated in Table 2.
Marketed dosage forms were analyzed by the proposed method and assay results of marketed formulations were shown in Table 6.
ACKNOWLEGEMENT
I would like to give my sincere and heartfelt thanks to
Famy Care Ltd., Ahmedabad(ADL department),
Mr.SuhasYewle, Mr.Sudhakar More, Mr.DhanajiPatil, Mr Tejas Patel, Trushar sir, Dinesh sir, Vinod sir, Tulshi sir, Dharma bhai, Bhaumik, Binal &Rashmi who offered me a lot of friendly help; they transferred to me their research links and suggested to me the necessary readings for pursuing dissertation research.
REFERNECES:
1) The Merck Index – An Encyclopedia of Chemicals,
Drugs and Biologicals. 13th Edn; Merck Co. Inc: p. 6737; 2001.
2) Government of India, Ministry of health & Family
Welfare, Indian Pharmacopoeia Vol. I-II. The Controller of publication, New Delhi: p.159, 358, 1583; 2010.
3) United States Pharmacopoeia and National
Formulary; USP30-NF25 Edn; The United States Pharmacopoeia Convention Inc., U.S.A:p. 2781-2782; 2007.
4) The International Pharmacopoeia; 3rd Edn; World
Health Organization, CBS Publishers &
Distributers, Volume 3: p. 998; 1998.
5) British Pharmacopoeia; British Pharmacopoeia
Commission, London, Volume 2: p.3478-3479; 2009.
6) MARTINDALE - The Extra Pharmacopoeia; 31st
Edn; The Royal Pharmaceutical Society, London: p.1476-1485, 1500; 1996.
7) Tripathi KD. Essential of Medical Pharmacology;
5th Edn; Jaypee Brothers Medical Publishers (P) Ltd: p.285-290; 2003.
8) Snyder LR., Kirkland JL. andGlajch JL. Practical
HPLC Method Development; 2ndEdn; Wiley, New York: p. 34-39; 1997.
9) ICH guidelines, Stability Testing of New Drug
Substances and Products Q1A(R2); I.C.H. Tripartite Guidelines: p. 5-13; 2003.
10) ICH guidelines, Stability Testing: Photostability
Testing of New Drug Substances and Products Q1B; I.C.H. Tripartite Guidelines: p.1-8; 1996.
11) Ahuja S. and Rasmussen H. HPLC Method
Development for Pharmaceuticals; Elsevier
Academic Press, London, Volume 6: p. 44-54; 2007.
12) Sethi PD. High performance liquid chromatography,
Quantitative analysis of pharmaceutical
formulations; CBS publishers& Distributors, New Delhi, Volume 1: p.03-201; 2010.
ICH guidelines, Validation of Analytical
Procedures, Text and Methodology Q2A(R1); I.C.H. Tripartite Guidelines: p. 5-17; 2005.
13) Heinisch S and Rocca JL. Effect of mobile phase
composition, pH and buffer type on the retention of ionizable compounds in reversed-phase liquid
chromatography application to method
development.J. Chromatogr. 2004; 1048(2):183– 193.
14) Cartensen JT. and Rhodes CT. Drug Stability-
Principles and Practices; 3rd Edn; Informa Healthcare, Volume 107: p.329-384; 2010.
15) Zhao LZ, et. al. Determination of levonorgestrel in
human plasma by liquid chromatography–tandem mass spectrometry method: application to a bioequivalence study of two formulations in healthy
volunteers. Biomedical Chromatography2008;
22(5): 519–526. DOI: 10.1002/bmc.963
16) Bhargavi P, Lakshmi S, et. al. Quantitative
bioanalysis of Levonorgestrel in Human plasma using LC-MS-MS. IJIPLS2011; 1(2): 39-48.
17) Fei L, Yu X, et. al. Tandem-MS validation for the