A Novel PSO Algorithm Model Based on
Population Migration Strategy and its Application
Shengli Song and Bing Lu
Dept. of Computer and Communication Engineering Zhengzhou University of Light Industry Zhengzhou, China
Email: [email protected]
Li Kong and Jingjing Cheng Dept. of Control Science and Engineering
Huazhong University of Science and Technology Wuhan, China
Abstract—According to the intelligent behavior of social
population, the centroid of the individual best of particle swarm is firstly introduced in particle swarm optimization (PSO) model to enhance inter-particle cooperation and information sharing capabilities, then combining the mechanism of population migration algorithm (PMA), a novel PSO algorithm with adaptive space mutation (PM-CPSO) is proposed to improve computing performance of PSO algorithm. Experiment results of Benchmark function and practical application in quality monitoring of laser welding process show the new algorithm has not only higher convergence precision and faster convergence speed, but also can avoid the premature convergence problem effectively.
Index Terms—Particle Swarm, Global Optimization,
Centroids, Population Migration, Information Sharing
I. INTRODUCTION
In practical engineering applications, a lot of computing problems can be formulated as a global optimization problem of the objective function having nonlinear or multipeaked characteristics. Since it is felt necessary in recent years to derive a global solution for these problems, a series of new global optimization algorithms were proposed mainly through the simulation of the evolution process of a group with optimal characteristics in natural areas, such as genetic algorithms, simulated annealing algorithm and ant colony algorithm. Genetic algorithm is to simulate the genetic chromosome evolution in vivo[1], simulated annealing simulates the process of atomic groups within the system tendind to the lowest energy state in annealing process of solid[2], ant colony algorithm for the simulation the process to find the shortest path from the nest to food sources through the exchange of information between the individual and mutual cooperation [3]. Particle Swarm Optimization (PSO) ,which is a biologically inspired computational search and optimization method inspired by the social behavior of a swarm such as bird flocking or fish schooling and proposed by Eberhart and Kennedy in 1995[4-5], is one of the most powerful methods for
solving constrained and unconstrained global optimization problems in recent years. Compared with other mathematical algorithms and evolutionary algorithms, it is computationally effective and easier to implement, and has also fast converging characteristics and more global searching ability at the beginning of the run and a local searching near the end of the run. In recent years, PSO has has been applied widely and successfully solved many complex optimization problems in the function optimization[6], chemical industry[7], bioinformatics [8], power system [9], fuzzy control[10-11] and some other fields[12-14].
methods with both a better stability and a steady convergence.
II. PARTICLE SWARM OPTIMIZATION ALGORITHM
PSO is a parallel stochastic search algorithm which maintains a swarm of candidate solutions, referred to as particles, they are members in the population, have their own positions and velocities, they fly around the problem space in the swarms searching for the position of optima and refines its search by attracting the particles to positions with good solutions. In PSO, a group of random particles is firstly initialized and then searches for optima by updating generations. In every iteration, Each particle remembers its own best position found so far in the exploration and updated by following two "best" values. The first one is the best solution it has achieved so far. This value is called pbest. Another "best" value tracked by the particle swarm optimizer is the best value, obtained so far by any particle in the population, which is called the global best and is denoted by gbest. After finding the two best values, each particle of PSO updates its velocity and position according to its own and its companion’s flying experience by the following equations
1
1
2
() ( ) () ( )
k k k
id id id id
k gd id
v w v c rand p x
c rand p x
+ = × + × × −
+ × × − (1)
1 1
k k k
id id id
x
+=
x
+
v
+(2) where d = 1, 2, . . .,N; i = 1, 2, . . . , M, M is the swarm size, and k is the iteration number; w is called inertia weight; c1 and c2 are two constant numbers called social or cognitive confidence respectively; rand() is randomly generated value between 0 and 1;pid is the position at which the particle has achieved its best fitness so far, and
gd
p is the position at which the best global fitness has
been achieved so far; k1 id
x+ is the next position of particle i according to its previous position and new velocity at time k ; k1
id
v+ is new velocity of particle i at the kth iteration. Every particle finds the optimal solution through cooperation and competition among the particles.
III.IMPROVED PSOALGORITHM MODEL BASED ON LOCAL CHAOS &SIMPLEX SEARCH STRATEGY
The solving performance of PSO depends on the abilities of exploration and exploitation of particles in searching space. In traditional PSO, each particle updates its next velocity and position only according to the velocity and position at the previous time, as well as individual best position and the best position of population, because it lacks of collaboration and information sharing with other particles, most particles often approach quickly a local optimum position. Especially, with the algorithm running, all particles become very similar and almost have no ability to explore
new area, and not easy for the particles to escape from the local optimum position. In such cases, an improved PSO algorithm in combination with certain excellent characteristics and mechanisms of other optimization algorithms is proposed.
A. PSO Model Embeded the Individual Best Centroid (CPSO)
In PSO, because each particle searches in the solution space guided only by the individual experience and the best experience of the population. Therefore, we can introduce the individual best centroid of all particle in PSO to enhance the capabilities of inter-particle cooperation and information sharing.
Let pc k be the individual best centroid of particle swarm at time k, it can be defined as follows
/
Mi=1
i k
c p M
p =
∑
(3)Then the distance between the current position and the individual best position of the particle i in formula (1) can be written as
pid−xidk = ×
α
pid + −(1α
)×pdk −xidk (4) where α =rand(). Then, pck is introduced into formula (1), so the formula (1) can be changed into1
1 2 (1 )
() (
) () ( ).
id k
id
k k
id id
k k
d gd id
p
p x
v w v c rand
c rand p x
α α
+ × +
− × −
= × + × ×
+ × × −
(5)
where α is a random number between 0 and 1, which is called weight adjustment factors.
We call the formula (5) and (2) as an improved particle swarm optimization model with centroid (CPSO). Therefore the movement track of each particle is also related with the individual best positions of other particles, the inter-particle’s cooperation and information sharing capabilities are enhanced greatly, the premature convergence of PSO can be decreased and the computing performance of algorithm can be improved effectively.
B. Improved PSO Algorithm Based on Population Migration Strategy
At the later of the algorithm running, most particles often have closed to the region containing the global optimum solution, at this time, we only need to search adequately the optimum solution in a smaller area nearby the best position, but not other areas. However, because each particle's velocity closes to zero at this moment , all the particles haven’t enough abilities of exploration and exploitation and tend to equilibrium, and it is not easy to escape from local optimum for the particles. To this case, based on the PMA, PM-CPSO algorithm with adaptive space mutation is proposed to improve global optimum efficiency and accuracy of PSO, which can achieve the purpose to exploit fully one's favorable conditions and avoid the unfavorable ones.
with population pressure increasing. The former promote better regionl to search for algorithm , to some extent, the latter can avoid local minima, Thus the search process presented the features of alternately focused search and distributed search, which reflects the characteristics of the contradiction movement of population aggregation and proliferation in the migration process.
According to the principle of population migration, the basic framework of migration can be summarized as follows[24]: (1) people migration in countries of origin; (2) attracted by the favorable areas, population migration; (3) population mobility in the concession area until the pressure reaches a certain limit of population; (4) Population move out, spread out, looking for new opportunities from the concession area. In the continuous process, population gathers to the concession area by migration, on the other hand, because of the increasing pressure of population relocation ,and move out from the region to other regions. These shows population migration is the process to look for preferential region in the contradictory movement of continuous accumulation and proliferation.
Here are the specific steps of the PMA algorithm[24]. In the algorithm, and a location is a point.
( , , , )
i i1 i2 in x = x x … x , i
n
x ∈R , δi=(δ δi1, i2,…,δin) ,
i
n R
δ ∈ , δij >0, i=1, 2,…,N , j=1, 2,…,n , N is population size.
Step1: In the search space, randomly generate Npoints.
1, 2, , n
x x … x . For each one, so that the center of the i-th region: centeri =xi , the upper and lower bounds:
i i
center±δ , δij =(bj−aj) /(2N) , i=1, 2,…,N , 1, 2, ,
j= … n.
Step2: Computing the value of each point: f x( )i .
Step3: According to the calculated value from step2, initialize the optimal value and optimal point
Step4: Population mobility in respective regions, and uniformly changes each point randomly:
()
2 i ( i i)
i rand center
x = δ + −δ , rand() : random
function.
If xij >bj, then xij =bj; if xij <aj, then xij =aj.
Step5: Computing the value of each point: f x( )i .
Step6: Recording the optimal value and optimal point.
Step7: If the times of population movement is less than pre-specified number of times, then turn to step4.
Step8: Population Migration: The most attractive point (ie, the best point) is set as the center, then the preferential region is determined by the size of each component of δ. And randomly generated N points in the region to replace the original points.
Step9: Computing the value of each point: f x( )i .
Step10: Recording the optimal value and optimal point.
Step11: Shrinking preferential region:δ = − ∆(1 )δ(∆is coefficient,0 <∆< 1) .
Step12: Population migration with the shift of economic focus in the concession area: let the best point be the center, then determine preferential region according to the size of each component of δ , and randomly generated N points in the region to replace the original points..
Step13: Computing the value of each point: f x( )i .
Step14: Recording the optimal value and optimal point.
step15: if maxδij >µ ( µ>0 is a given population pressure parameter in advance) , turn to step 11 .
Step16: Show results.
Step17: Population spread: in the search space, randomly generated N points to replace the original point, and determine the region of population movement..
Step18: Computing the value of each point: f x( )i .
Step19: Recording the optimal value and optimal point
Step20: Iteration times: m=m+1, if the number of iterations is less than the specified number, then turn to
Step 4.
Step21: Over.
Let xg =(xg1,xg2,…,xgN)be the best positionof all the
particles at time K,where xgd∈region d( )=[sleft srightd, d],
1, 2, ,
d = … N, gbest K( )is its best fitness value, during iteration process, for given integer >0L , if
( ) ( )
gbest K −gbest K−L <ε (6) whereK− >L 0,
ε
is the variation accuracy of the best fitness value, we can shrink particle’s search space with following formulas:( ) [ (1 ) ( ),
(1 ) ( )]
gd gd d
gd d gd
region d x x sleft
x sright x
λ λ
λ λ
= − ∗ − ∗ −
+ ∗ − ∗ − (7)
where λ is space adjustment factor in (0,1),
1, 2, ,
d = … N, then we initialize position and associated velocity of all the particles randomly in the new searching space. Finally, xg
'
is the new best position obtained by PSO, gbest K( )'is its best fitness value, if( ) ' ( )
gbest K −gbest K <ε', for ∀ε'>0 (8) we update xg with xg
'
, the new algorithm continues torun, otherwise, and if max{srightd−sleftd}<2µ (µ a given population pressure parameter in the current search space), we can expand particle’s search space with following formulas
( ) [ d, d]
region d = sleft sright ,d =1, 2,…,N (9)
where[sleft srightd, d]is original soloving space.
adequately explore other areas to improve the ability of searching a global solution.
Then, the PM-CPSO algorithm can be summarized as follows:
Step1: Initialize position and associated velocity of all the particles randomly in the N dimension space.
Step2: Evaluate the fitness value of each particle , and update the individual and global optimum positions.
Step3: For positive integer L and population pressure parameter µ , According to formulas (6) and (8), determine whether mutating search space according to formulas (7) or (9) and particles migration.
Step4: Reassign pbest and gbest according to the current fitness values of particles: compare the pi of
every individual with its current fitness value. If the current fitness value is better, assign the current fitness value to pi; determine the current best fitness value in
the entire population. If the current best fitness value is better than the pg, then assign the current best fitness
value to pg.
Step5: For each particle, Update particle velocity according formula (5), Update particle position according formula (2).
Step6: Repeat Step2 - 5 until a stop criterion is satisfied or a predefined number of iterations is completed.
IV. COMPUTATION RESULTS AND ANALYSIS
To test the performance of the new method, the maximum number of iterations and accuracy are given, running the algorithm , when the maximum number of iterations or the best value satisfy the given value, the algorithm terminated, compare the final calculation results for each algorithm. Firstly, six benchmark functions are introduced to test the new method, then, it is applied to MBC in alumina production, the results of the new model are compared with standard PSO and other improved methods.
A. Benchmark Function Simulation ⑴ Spherical function
2
1
( ) , 100 i 100
n
i i
f x x x
=
=
∑
− ≤ ≤ , (10)⑵ Griewank function
2
1 1
( ) 1 cos( ) 1, 600 600
4000 i
n n
i i
i i
f x x x
i x
= =
=
∑ ∏
+ + − ≤ ≤ ,(11)⑶ Rastrigin function
2
1
( ) ( 10 cos(2 ) 10), 5.12 i 5.12
n
i i
i
f x x πx x
=
=
∑
− + − ≤ ≤ (12)⑷ Rosenbrock function
2 2 2
1 1
( ) [100( ) ( 1) ],
n
i i i
i
f x x+ x x
=
=
∑
− + − − ≤ ≤30 xi 30,(13)⑸ Ackley function
2
1 1
( ) 20exp
32 32
1 cos(2 )
1
0.2 exp 20
i
n n
i i
i i
f
x
x x
n
x n π e
⎛ ⎛ ⎞⎞
⎜ ⎜ ⎟⎟
⎜ ⎜ ⎟⎟
⎜ ⎜ ⎟⎟
⎜ ⎝ ⎠⎟
⎝ = = ⎠
= −
− ≤ ≤
−
∑
−∑
+ +,
(14)
⑹ Schaffer function
1 2
2 2
1 2
2 2
1 2
100 100
( , ) 0.5 ,
sin 2 0.5
1 0.001 ( ) xi
f x x
x x
x x
− ≤ ≤
= + + −
+ ⋅ + (15)
PSO, AM-PSO[17], AF-PSO[18], SM-PSO[19], PM-CPSO are respectively run for 50 times. The swarm sizes are set as 60 for PSO, AM-PSO, AF-PSO and SM-PSO, 40 for PM-CPSO;α=rand(),λ µ= =0.5, ,
ε
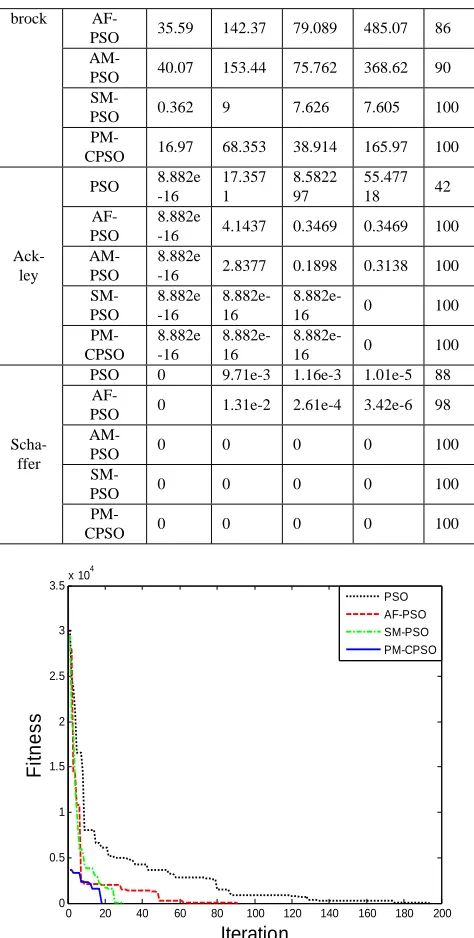
= −1e 3,L=100, c1=c2=2.0,w is declined linearly from 0.9 to 0.4. Other parameters are set in Table 1. Comparisons of computation results among PSO, AM-PSO, AF-PSO, SM-PSO, and PM-CPSO are shown in Table 2, Fig. 1-6 show comparisons of convergence curve for two functions (only give a comparison of the convergence curve of PSO, AF-PSO, SM-PSO and PM-CPSO).
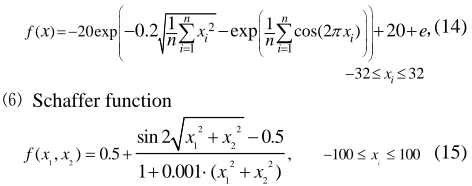
TABLE 1. CONFIGURATION OF SOME PARAMETERS Function Dimension Generation Precision Spherical 30 2000 0.05 Griewank 30 2000 0.5 Rastrigrin 30 2000 50 Rosenbrock 30 2000 100 Ackley 30 2000 5 Schaffer 2 1000 1e-3
TABLE 2. COMPARISONS OF THE COMPUTATIONAL RESULTS
Func-tion
Algor -ithm
Fitness value Succ -Rate
(%) Best Worst Mean
Deviat-ion
Sphe-rical
PSO 0 0.2915 1.32e-2 3.23e-3 96 AF-
PSO 0 0.1324 5.19e-3 3.61e-4 98 AM-
PSO 0 2.17e-2 4.35e-4 9.47e-6 98 SM-
PSO 0 0.1233 2.46e-3 3.04e-4 100
PM-CPSO 0 0 0 0 100
Grie- wank
PSO 0 1.091 0.2998 0.1641 72 AF-
PSO 0 0.5225 4.95e-2 8.62e-3 98 AM-
PSO 0 0 0 0 100 SM-
PSO 0 0.4356 3.57e-2 8.16e-3 100
PM-CPSO 0 0 0 0 100
Rast-rigin
PSO 0 115.69 33.753 922.36 76 AF-
PSO 0 82.770 17.849 414.31 94 AM-
PSO 0 54.464 16.462 170.98 96 SM-
PSO 0 88.769 29.76 701.64 72
brock AF-
PSO 35.59 142.37 79.089 485.07 86 AM-
PSO 40.07 153.44 75.762 368.62 90 SM-
PSO 0.362 9 7.626 7.605 100
PM-CPSO 16.97 68.353 38.914 165.97 100
Ack- ley
PSO 8.882e -16
17.357 1
8.5822 97
55.477 18 42 AF-
PSO
8.882e
-16 4.1437 0.3469 0.3469 100 AM-
PSO
8.882e
-16 2.8377 0.1898 0.3138 100 SM-
PSO
8.882e -16
8.882e-16
8.882e-16 0 100
PM-CPSO
8.882e -16
8.882e-16
8.882e-16 0 100
Scha-ffer
PSO 0 9.71e-3 1.16e-3 1.01e-5 88 AF-
PSO 0 1.31e-2 2.61e-4 3.42e-6 98 AM-
PSO 0 0 0 0 100 SM-
PSO 0 0 0 0 100
PM-CPSO 0 0 0 0 100
0 20 40 60 80 100 120 140 160 180 200
0 0.5 1 1.5 2 2.5 3
3.5x 10
4
Iteration
Fit
n
es
s
PSO AF-PSO SM-PSO PM-CPSO
Figure 1. Comparisons of convergence curve for Spherical function
0 200 400 600 800 1000 1200 1400 1600 1800 2000
0 5 10 15 20 25 30 35 40 45 50
Iteration
Fi
tnes
s
PSO AF-PSO SM-PSO PM-CPSO
Figure 2. Comparisons of convergence curve for Griewank function
0 200 400 600 800 1000 1200 1400 1600 1800 2000
0 50 100 150 200 250 300 350 400 450
Iteration
Fit
n
es
s
PSO
AF-PSO SM-PSO PM-CPSO
Figure 3. Comparisons of convergence curve for Rastrigin function
0 200 400 600 800 1000 1200 1400 1600 1800 2000
0 1000 2000 3000 4000 5000 6000 7000 8000
Iteration
Fi
tnes
s
PSO AF-PSO SM-PSO
PM-CPSO
Figure 4. Comparisons of convergence curve for Rosenbrock function
0 200 400 600 800 1000 1200 1400 1600 1800 2000
0 2 4 6 8 10 12 14 16 18 20
Iteration
Fit
n
es
s
PSO AF-PSO SM-PSO
PM-CPSO
0 100 200 300 400 500 600 0
0.02 0.04 0.06 0.08 0.1 0.12 0.14 0.16 0.18
Iteration
Fi
tn
e
s
s
PSO AF-PSO SM-PSO PM-CPSO
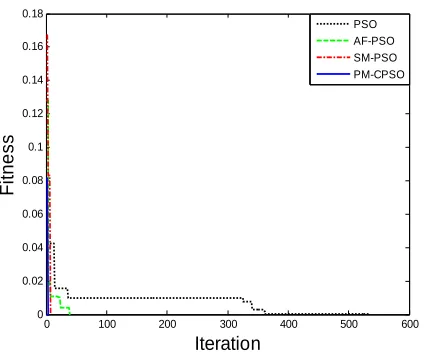
Figure 6. Comparisons of convergence curve for Schaffer function
From Table 2, It is easy to see that there are higher convergence accuracy and success rate for PM-CPSO than that for PSO, AM-PSO, AF-PSO, SM-PSO, from the mean and deviation in Table 2, PM-CPSO has a better stability than PSO, AM-PSO, AF-PSO except SM-PSO for function Rosenbrock, The average success rate of PM-CPSO reaches 100% for each function, and obviously better than PSO, AM-PSO , AF-PSO and SM-PSO. From Fig.1-6, it can be seen that PM-CPSO has higher convergence performance than PSO, AF-PSO, AM-PSO and SM-PSO, PM-CPSO can effectively avoid falling into local optimum solution through improving inter-particle cooperation and information sharing and population migration, and attain global better solution while other algorithms cannot. These show that PM-CPSO has better optimization solving capability and faster convergence performance than PSO, AM-PSO, AF-PSO, SM-PSO.
B. Quality monitoring of laser welding process
Laser welding has been widely applied in modern manufacturing industries such as automobile and aerospace. But because of the complication of its applying process, weld defects often exist and greatly affects the quality of the welding production. Penetration monitoring of the weld state can be seen as data classification problem of pattern recognition, which can be described as machine learning problem based on samples.
We conducted laboratory experiments through using a continuous wave CO2 laser at power 1650W and at welding speed of 1m/min. Adequate and inadequate penetration weld states were obtained by using a wedge-shaped work-piece with thickness from 1mm to 3mm.
BP network is used for weld states classification problem. According to early research[14], seven feature values were extracted from the three signals. Then, the node number of input layer was set as 7. The output of the network only had two states, so the output layer had 2 node. The numbers of hidden layer are 6, 9 and 12 respectively. The activation functions of hidden and output nodes are S-type function. Evaluating indicator of neural network classification is defined as follows:
_
_ Err num 100%
Err rate
Total
= × (16)
where Err_num is the number of error classification, Total is the number of samples . Three welds (P00, P01, P02) are used in experiment, every weld has 52 samples, for a same weld , 26 data are selected as a training set, and others as a testing set, for different weld , 52 data of one weld are selected as a training set, and samples of other welds as a testing set. Two training algorithms (PM-CPSO, PSO) were used to train BP network, the swarm sizes are 50, the maximum evolution generation is 1000 for BP, 300 for PSO and PM-CPSO. Other parameters are set as above. The comparison of classification results of the same and different welds are respectively shown in Table 3 - 6.
TABLE 3. COMPARISON OF CLASSIFICATION RESULTS OF THE SAME WELD FOR DIFFERENT MODEL
Weld Network Structure
Err_rate(%)
BP PSO PM-CPSO
P00
7-6-2 11.54 23.08 0 7-9-2 7.69 23.08 3.84 7-12-2 23.08 7.69 0
P01
7-6-2 11.54 0 3.84 7-9-2 0 3.85 0 7-12-2 50 0 0
P02
7-6-2 11.54 15.38 0 7-9-2 0 3.85 0 7-12-2 19.23 3.85 0 TABLE 4. COMPARISON OF CLASSIFICATION RESULTS OF
THE DIFFERENT WELD FOR 7-6-2 MODEL Training
Sample
Testing Sample
Err_rate(%)
BP PSO PM-CPSO P00 P01 13.46 3.84 1.92
P02 21.15 1.92 1.92 P01 P00 13.46 13.46 3.84 P02 5.76 3.84 1.92 P02 P00 34.62 1.92 1.92
P01 23.07 3.84 1.92 TABLE 5. COMPARISON OF CLASSIFICATION RESULTS OF
THE DIFFERENT WELD FOR 7-9-2 MODEL Training
Sample
Testing Sample
Err_rate(%)
BP PSO PM-CPSO P00 P01 13.46 3.84 1.92
P02 15.38 13.46 3.84 P01 P00 9.61 26.92 1.92
P02 3.84 3.84 1.92 P02 P00 13.46 1.92 0
P01 1.92 0 1.92 TABLE 6. COMPARISON OF CLASSIFICATION RESULTS OF
THE DIFFERENT WELD FOR 7-12-2 MODEL Training
Sample
Testing Sample
Err_rate(%)
BP PSO PM-CPSO P00 P01 3.84 9.61 1.92
P02 11.53 9.61 1.92 P01 P00 5.76 9.61 1.92
P02 3.84 3.84 1.92 P02 P00 13.46 17.30 1.92
From Table 3 to Table 6, whether the training data and the testing data belonged to a same weld or not, it can be seen that the classification rate of PM-CPSO is obviously higher than those of BP and PSO for each model; although the classification rate was varied with different welds, the classification rate of new algorithm was higher than 96%; Even the best classification rate was 100% for a same weld. Obviously, it is important to adjust parameters of the monitoring system on-line for accuracy and to improve high training speed. The application results show the PM-CPSO is more feasible and efficient than the BP and PSO for quality monitoring of laser welding process.
V. CONCLUSION
Based on in-depth study of PSO algorithm and the principle of population migration, from start to upgrade the computing performance of PSO, a novel PSO algorithm with adaptive space mutation based on population migration strategy is given. PM-CPSO retains the original advantages of PSO, the disadvantages were offset by the merits of PMA, the PM-CPSO can enhance individual and group collaboration and information sharing capabilities effectively through introducing the individual best centroid, the exploration ability of PM-CPSO is greatly improved through space mutation and particles migration, and the probability of falling into local optimum is decreased efficiently. The final computing results prove that PM-CPSO can effectively escapes from local optimum solution and achieved very good computing performance. In the future, the application of the PM-CPSO in other areas and theoretical analysis can be discussed further, and the convergence pattern, dynamic and steady-state performances of the algorithm can be improved more to specific complex optimization functions through analyzing the behavior of swarm intelligence and combining with other optimal mechanisms.
ACKNOWLEDGEMENTS
The authors would like to thank the anonymous reviewers for their careful reading of this paper and for their helpful comments. This work was supported by the National High Technology Research and Development Program of China under grant no. 2006AA060101.
REFERENCES
[1] J. H Holland, “Genetic Algorithms,” Scientific American , 1992 ,Vol.267 (1) , pp.44–50.
[2] S. Kirkpatrick , C. D. Gelatt , Vecchi Jr M P., “Optimization by simulated annealing,” Science, 1983 , Vol.220 (4 598) , pp. 671–680.
[3] Marco Dorigo , Vittorio Maniezzo , Alberto Colorni, “Ant system :Optimization by a colony of cooperat ingagents ,” IEEE Trans on System , Man and Cybernetic , 1996 ,Vol. 26 (1),pp. 29–41.
[4] J. Kennedy, R. C. Eberhart, “Particle swarm optimization,” Proceedings of the IEEE International Conference on Neural Networks IV, IEEE Press, Piscataway, NJ (1995),pp.1942–1948.
[5] R. C. Eberhart and J. Kennedy, “A new optimizer using particle swarm theory,” Proceedings of the 6th International Symposium on Micromachine and Human Science, Nagoya, Japan, 1995, pp. 39–43.
[6] Yi-Tung Kao, Erwie Zahara,"A hybrid genetic algorithm and particle swarm optimization for multimodal functions,” Applied Soft Computing, Vol.8(2), March 2008, pp. 849-857.
[7] Halter Werner, Mostaghim Sanaz, “Bilevel optimization of multi-component chemical systems using particle swarm optimization,” 2006 IEEE Congress on Evolutionary Computation, CEC 2006, 2006, pp.1240-1247.
[8] S. H. Zhou, Q. Zhang, J. Zhao, “DNA encodings based on multi-objective particle swarm,” Journal Of Computational and Theoretical Nanoscience. Vol.4, Issue:7-8, NOV-DEC 2007, pp.1249-1252.
[9] D. N. Jeyakumar, T. Jayabarathi, T. Raghunathan, “Particle swarm optimization for various types of economic dispatch problems,” Electrical Power and Energy Systems, 2006, Vol.28(1),pp.36-42.
[10]R.J. Kuo, S.Y. Hong, Y.C. Huang, “Integration of particle swarm optimization-based fuzzy neural network and artificial neural network for supplier selection,” Applied Mathematical Modelling, Vol.34(12), December 2010, pp.3976-3990.
[11]W. Zhang, Y. T. Liu, “Multi-objective reactive power and voltage control based on fuzzy optimization strategy and fuzzy adaptive particle swarm,” International Journal of Electrical Power & Energy Systems, Vol.30(9), November 2008, pp.525-532.
[12]V.K. Patel, R.V. Rao, “Design optimization of shell-and-tube heat exchanger using particle swarm optimization technique,” Applied Thermal Engineering, Vol.30(11-12), August 2010, pp.1417-1425.
[13]K. K. Soo, Y. M. Siu, W. S. Chan, “Particle-swarm-optimization-based multiuser detector for CDMA communications,” IEEE Transactions on Vehicular Technology, Vol56(5), September, 2007, pp.3006-3013. [14]P. Zhang, L. Kong and W. Z. Liu, “Real-time monitoring
of laser welding based on multiple sensors,” Control and Decision Conference, 2008, CCDC 2008, Chinese 2-4 July 2008, pp. 1746-1748.
[15]X. L. Jin, L. H. Ma and T. J. Wu, “Convergence analysis of the particle swarm optimization based on stochastic processes,” Zidonghua Xuebao/Acta Automatica Sinica, v33, n12, December, 2007, pp.1263-1268.
[16]Zielinski Karin, Laur Rainer, “Adaptive parameter setting for a multi-objective particle swarm optimization algorithm,” 2007 IEEE Congress on Evolutionary Computation, CEC 2007, pp.3019-3026.
[17]Higashitani Mitusharu, Ishigame Atsushi, Yasuda Keiichiro, “Particle swarm optimization with controlled mutation,” IEEE Transactions on Electrical and Electronic Engineering, Vol.2(2), March 2007, pp.192-194.
[18]P. S. Shelokar ,Siarry Patrick and V. K. Jayaraman, “Particle swarm and ant colony algorithms hybridized for improved continuous optimization,” Applied Mathematics and Computation, May, 2007, 188(n1), pp. 129-142. [19]S. L. Song, L. Kong, Y. Gan and R. J. Su. “Hybrid particle
swarm cooperative optimization algorithm and its application to MBC in alumina production,” Progress in Natural Science, Vol.18(11), 2008, pp.1423-1428 . [20]Zhihua Cui, Xingjuan Cai, Jianchao Zeng and Guoji Sun,
[21]S. L. Song, L. Kong, J. J. Cheng, “A Novel Stochastic Mutation Technique for Particle Swarm Optimization”. Dynamics of Continuous Discrete & Impulsive System, 2007,14, pp.500–505.
[22]S. L. Song, L. Kong and P. Zhang. “Improved particle swarm optimization algorithm with accelerating factor,” Journal of Harbin Institute of Technology (New Series), January, 2007, 14(ns2), pp. 146-149.
[23]S. L. Song, L. Kong , P. Zhang and R. J. Su, “Particle Swarm Optimization Algorithm Based on Space Mutation and its Application,” 2009 International Conference on Intelligent Human- Machine Systems and Cybernetics. 26-27 August, 2009. vol.II, pp. 440-443.
[24]Y. H. Zhou, Z. Y. Mao, “A new global optimization search algorithm_Population Migration Algorithm(Ⅰ),” South China University of Technology (Natural Science), 2003, Vol31(3),pp.1-5 (in chinese).
[25]Y. H. Zhou, Z. Y. Mao, “A new global optimization search algorithm_Population Migration Algorithm(Ⅱ),” South China University of Technology(Natural Science), 2003, Vol31(4),pp.52-57 (in chinese).
Shengli Song (1968-), male, Associate Professor, received the Ph.D. degree in control science and engineering in 2009 from Huazhong university of science and technology, and is working in Zhengzhou university of light industry, his research directions include intelligence computation and optimal control;
Bing Lu (1976-), female, Associate Professor, her research directions include intelligence computation and Computer Software and Theory;
Li Kong (1956-), male, Professor, supervisor for Ph.D. candidate, his research directions include new detecting technique and signal processing, intelligence computation and optimal control;