GLOBAL JOURNAL OF ADVANCED ENGINEERING TECHNOLOGIES AND
SCIENCES
A STUDY ON CLASSIFICATION TECHNIQUES FOR THE IDENTIFICATION OF
TUMOR TYPES IN ABNORMAL BRAIN MR IMAGES
Sree Sankar. J*, R. A. Isabel, Bipin Dev S.S
*
(PG scholar) Dept. of ECE Sivaji College of Engineering and Technology Manivila, KanyaKumari,
Tamil Nadu
(Head of ECE Dept.) Sivaji College of Engineering and Technology Manivila, KanyaKumari,
Tamil Nadu
(PG scholar) Dept. of ECE Sivaji College of Engineering and Technology Manivila, KanyaKumari,
Tamil Nadu
ABSTRACT
The tumor detection and classification over the Magnetic Resonance Images is a systematic procedure. The correct identification of the type of brain tumor is essential for the further treatments and surgical planning in future.The usage of the advanced techniques is very essential for the proper identification of the type of the tumor without any kind of faults. In order to satisfy this requirement here two well-known classification techniques such as Artificial Neural Networks (ANN) and Self-Organizing Map (SOM) are used. Zernike moments are used for feature extraction and MRI segmentation is carried out by using Expectation-Maximization algorithm. Here for the identification of the abnormalities in the MRI images Support Vector Machine (SVM) is used. The types of tumors are identified individually using the two classifiers from a set of brain tumor images and finally the time complexities for the two are analyzed.
KEYWORDS: Self-Organizing Map, Artificial Neural Networks, Support Vector Machine, Zernike moments.
INTRODUCTION
Today brain tumor has become one of the most important causes for the increase in the mortality rate among children and adults. A tumor can be a solid lesion which is formed by the abnormal growth rate of cells and it usually resembles like a swelling. In medical sense a tumor is an abnormal swelling of flesh. The human body is made up of different types of cells and each type of cells performs specific functions. Most of the cells grow and then divide in an orderly manner to form new cells. The cell division is a process in order to keep the body healthy and work properly. Sometimes these cells lose the ability for controlling their growth rate and consequently the cell division occurs too often without any order. These abnormal cells form a mass of tissues which are known as tumors.
When this abnormal cell division occurs in the brain it is known as brain tumor. The brain tumors are broadly classified into malignant tumors and benign tumors. The cancerous tumors are known as malignant tumors whereas non-cancerous tumors are known as benign tumors. The threat level of the brain tumors depends mainly on many factors such as type of the tumor, the location of the tumor, the size of the tumor and the current development of the tumor.
There are many tumor detection and classification methods available in the literature. These methodologies can be broadly classified into four categories, which includes Region growing based methods, Thresholding methods, Genetic algorithm based methods and Neural Network based methods. In this paper we are using Support Vector Machine (SVM) for the identification of the normal and abnormal brain images. The classification of the abnormal MRI image into cancerous and non-cancerous tumors are carried out using Artificial Neural Network (ANN) and Self-Organizing Map (SOM).
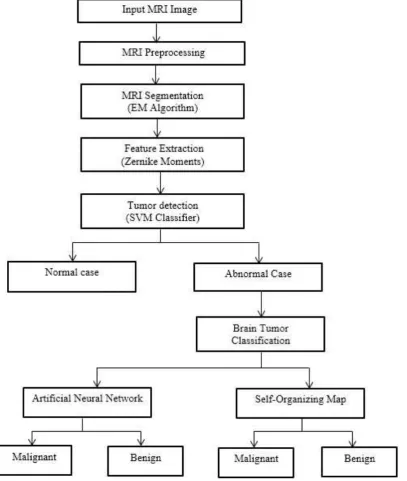
PROPOSED METHODOLOGY
The Magnetic Resonance Images contains the essential details about the presence of the tumors. These details cannot be derived directly from the MRI images. Therefore it is very important to apply various image processing techniques on the MRI images. The techniques used for tumor detection and classification are discussed in this section. The figure 2(a) shows the proposed block diagram for the detection and classification of the tumors into cancerous (or) malignant tumors and non-cancerous (or) benign tumors.
Now the preprocessed MRI image undergoes segmentation using Expectation-Maximization (EM) algorithm. It is an iterative process. It includes two steps: E-step and M-step. In E-step the expected value of the log likelihood function with respect to the conditional distribution is computed and in the M-step the parameter that maximize the E-step is determined.
After the MRI image segmentation the useful features are determined from the MRI using Zernike moments. The usage of Zernike moments for feature extraction have many advantages. Zernike moments possess simple rotational invariance, it means that the image will keep the originality even when it is rotated to any degree. Zernike moments can represent the properties of an image with no redundancy or overlap information between the moments. Zernike moments are extensively used in shape retrieval and edge detection in pattern recognition. The extracted features contains the relevant information about the tumor. The output of the Zernike moments feature extraction includes a magnitude value and an angle value.
The output obtained from the Zernike moments are given as input to the classifier. Now the presence or absence of tumor is detected using the Support Vector Machine (SVM). SVM is very effectively used for the detection of tumors. The other application fields of SVM includes bio-sequence analysis, data mining and bio informatics.
There are two cases, an abnormal case and a normal case, obtained as the output of SVM classifier. The abnormality in the MRI indicates the presence of the tumor. The next step is to identify the type of the tumor by using ANN and SOM classification techniques. Figure 2 (b) shows some MRI image data set used in the training.
Figure 2(b) MRI data set used for training
Artificial Neural Networks are mathematical models or computational models which are based on the functional aspects of biological neural networks. Artificial Neural Networks are normally known as Neural Networks. The three important layers for ANN includes: input layer, hidden layers and output layers. Several interconnected groups of artificial neurons forms a neural network. One of the important property of ANN is the capacity of the network to learn from its environment and to improve performance through learning. ANN learns about its environment through an iterative procedure. After each iteration of the learning process the network become more knowledgeable about its environment. There exist two phases for ANN classification process. The first phase is the training phase, which is also known as learning phase. The second phase is the testing phase.
Self-Organizing Map (SOM) is also known as Self-Organizing Feature Map, is an unsupervised learning method. The two dimensional representation of the input vector space of the training samples is known as map. The main difference that exist between ANN and SOM is that, SOM uses neighborhood function to preserve the topological properties of the input space. Like the Artificial Neural Networks, Self-Organizing Maps also operates in two modes: Training mode and Mapping mode. The learning process in SOM for classifying input vectors is based on the grouping of the input vectors in the input space. The neighboring neurons in the SOM learns to identify the neighboring sections of the input space. As a result Self-Organizing Maps learn both distribution and topology of the input vectors they are trained on.
SIMULATION RESULTS
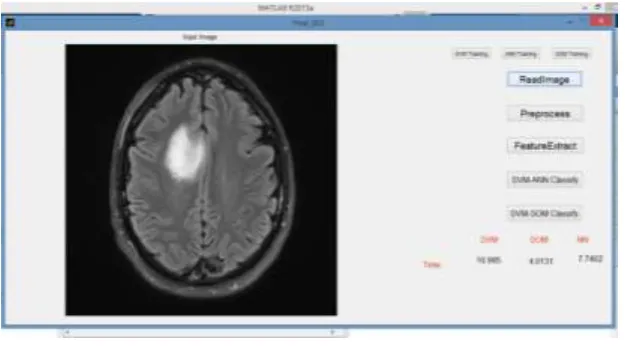
This section deals with the Experimental results obtained. The software used here for the implementation of the brain tumor detection and classification is MATLAB.
The Figure 3(a) shows the input MRI image, which is used for processing in the next steps to identify the nature of the MRI image.
Figure 3(b) MRI Preprocessing result
Figure 3(b) shows the preprocessing output obtained, which includes gray scale conversion and high pass filtering. The enhanced MRI image is segmented using Expectation-Maximization Algorithm for extraction of features. The Output obtained after segmentation is also shown in the figure 3(b).
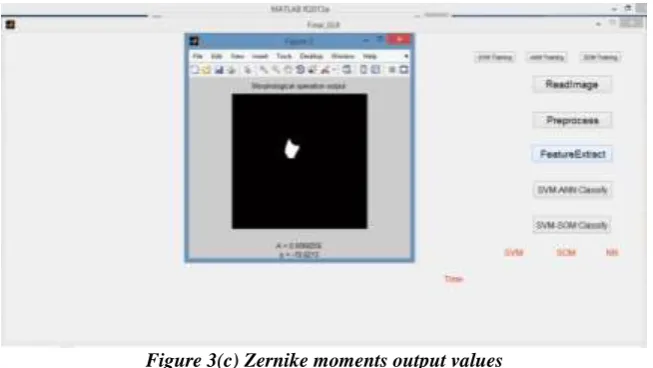
Figure 3(c) Zernike moments output values
For extraction of features Zernike Moments are used here. The Output of Zernike Moments obtained includes an angle and a Magnitude value which is shown in Figure3(c).
The results obtained for the detection of brain tumor using SVM, Classification using ANN and the time complexity for ANN are shown in the figure 3(d). The results obtained for the detection of brain tumor using SVM, Classification using Self-Organizing Map and the time complexity of SOM are shown in the figure 3(e).
Figure 3(e) Detection of Brain tumor using SVM and classification using SOM
Table 1. ANN and SOM tumor classification result obtained
Sl.no Image name ANN SOM
1. Image1 Benign Benign
2. Image2 Malignant Benign
3. Image3 Benign Benign
4. Image4 Malignant Malignant
5. Image5 Benign Benign
6. Image6 Benign Benign
7. Image7 Benign Benign
8. Image8 Benign Benign
9. Image9 Malignant Malignant
10. Image10 Benign Benign
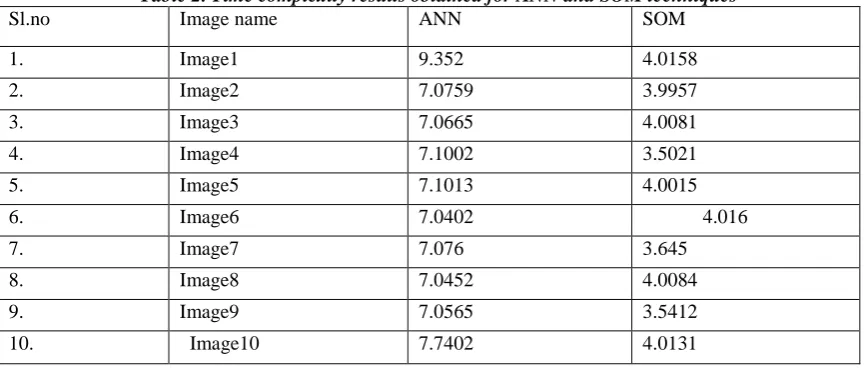
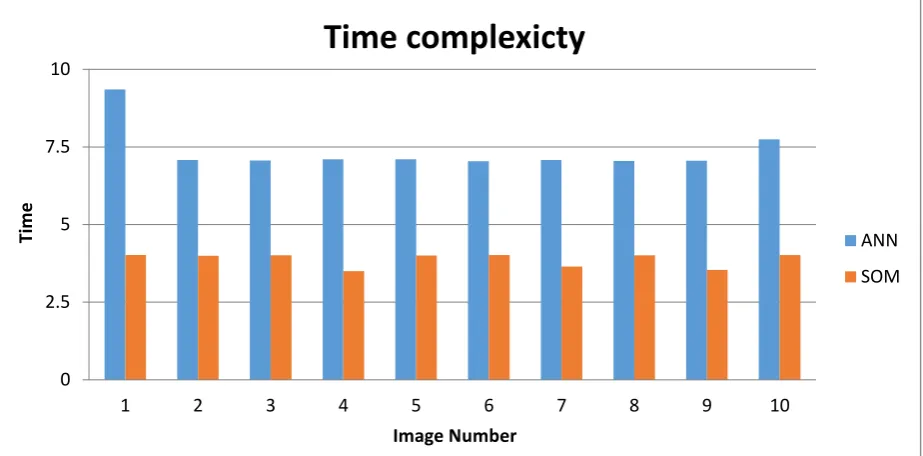
The above mentioned Table 1 shows the brain tumor classification results obtained using Artificial Neural Networks and Self-Organizing Maps. Here Table 2 shows the time requirements for each classifiers, which are supportive for the performance evaluation. From this we can identify the time complexity for each of the two classifiers for individual images. Figure 3 (f) shows the time complexity graph for the two classifiers. It demonstrates the time ranges for each input images and time variations for each classifiers.
Table 2. Time complexity results obtained for ANN and SOM techniques
Sl.no Image name ANN SOM
1. Image1 9.352 4.0158
2. Image2 7.0759 3.9957
3. Image3 7.0665 4.0081
4. Image4 7.1002 3.5021
5. Image5 7.1013 4.0015
6. Image6 7.0402 4.016
7. Image7 7.076 3.645
8. Image8 7.0452 4.0084
9. Image9 7.0565 3.5412
Figure 3 (f) Time complexity graph obtained for ANN and SOM
CONCLUSION
The main aim is to derive the performance of ANN and SOM in terms of time complexity. SVM is used for tumor identification and the brain tumor classification using the two approaches are considered. Individual results for tumor classification using the two classifiers are obtained for each input image. The time complexity for two classifiers are also individually taken into account for each input image. From the results obtained SOM classifier is having less time complexity when compared with ANN.
REFERENCES
[1] Gibbs, P., Buckley, D, Blackband, S., Horsman, A.: Tumour volume determination from MR images by morphological segmentation. Phys Med Biol (1996) 2437–2446
[2] Dhawan, A. P, “A Review on Biomedical Image Processing and Future Trends,” Computer Methods and Programs in Biomedicine, Vol. 31, No.3-4, 1990, pp.141-183.
[3] C. Cortes, V. N. Vapnik, ”Support-Vector Networks”, Machine Learning, vol.20, Issue 3, pp. 271–297, September 1995.
[4] Alexander Statnikov, “Automatic cancer diagnostic decision support system for gene expression domain”, Thesis, August, 2005.
[5] Chaplot S, Patnaik M, Jagannathan N, “Classification of magnetic resonance brain images using wavelets as input to support vector machine and neural network”, Biomedical Signal Processing and Control 2006;1:86-92.
[6] A. Quddus and O. Basir, “Wavelet based MR 2D slice retrieval in 3D volumes,” in Proc. IEEE Toronto Int. Conf.–Sci. Technol. Humanity,, Sep., 2009, pp. 545–550.
[7] Cline HE, Lorensen E, Kikinis R, Jolesz F.Three-dimensional segmentation of MR images of the head using probability and connectivity. J Comput Assist Tomography 1990; 14:1037–1045.
[8] Bonnie NJ, Fukui MB, Meltzer CC, et al.Brain tumor volume measurement: comparison of manual and semiautomated methods. Radiology 1999; 212:811–816.
[9] Kamber M, Shinghal R, Collins DL, et al.Model-based 3-D segmentation of multiple sclerosis lesions in magnetic resonance brain images. IEEE Trans Med Imaging 1995; 14:442–453.
[10] P.Sangeetha, “Brain Tumor Classification Using PNN And Clustering”, Volume 3, Special Issue 3, March 2014 2014 International Conference on Innovations in Engineering and Technology (ICIET’14) 0
2.5 5 7.5 10
1 2 3 4 5 6 7 8 9 10
Ti
m
e
Image Number
Time complexicty
ANN