Proc. IAHS, 369, 81–86, 2015 proc-iahs.net/369/81/2015/ doi:10.5194/piahs-369-81-2015
© Author(s) 2015. CC Attribution 3.0 License.
Open Access
Hydrological
Ev
ents
(JH01
–
IUGG2015)
The effect on river discharge estimation by considering
an interaction between land surface process and river
routing process
K. Yorozu and Y. Tachikawa
Graduate school of Engineering, Kyoto University, Kyoto, Japan
Correspondence to: K. Yorozu ([email protected])
Received: 15 April 2015 – Accepted: 15 April 2015 – Published: 11 June 2015
Abstract. There is much research assessing the impact of climate change on the hydrologic cycle. However, it has often focused on a specific hydrologic process, without considering the interaction among hydrologic processes. In this study, a distributed hydrologic model considering the interaction between flow routing and land surface processes was developed, and its effect on river discharge estimation was investigated. The model enables consideration of flow routing, irrigation withdrawal from rivers at paddy fields, crop growth depending on water and energy status, and evapotranspiration based on meteorological, soil water and vegetation status. To examine the effects of hydrologic process interaction on river discharge estimation, a developed model was applied to the Chao Phraya river basin using near surface meteorological data collected by the Japanese Meteorological Research Institute’s Atmospheric General Circulation Model (MRI-AGCM3.2S) with TL959 spatial resolution as forcing data. Also, a flow routing model, which was part of the developed model, was applied independently, using surface and subsurface runoff data from the same GCM. In the results, the developed model tended to estimate a smaller river discharge than was estimated by the river routing model, because of the irrigation effect. In contrast, the annual maximum daily discharge calculated by the developed model was 24 % greater than that by the flow routing model. It is assumed that surface runoff in the developed model was greater than that in the flow routing model because the soil water content was maintained at a high level through irrigation withdrawal. As for drought discharge, which is defined as the 355th largest daily discharge, the developed model gave a discharge 2.7-fold greater than the flow routing model. It seems that subsurface runoff in the developed model was greater than that in the flow routing model. The results of this study suggest that considering hydrologic interaction in a numerical model could affect both flood and drought estimation.
1 Introduction
There has been much research into the assessment of the im-pact of climate change on the hydrologic cycle (ex. Mid-delkoop et al., 2001; Hirabayashi et al., 2013). In general, General Circulation Model (GCM) output is used as a bound-ary condition on the hydrologic models in those studies. However, research has usually focused on a specific drologic process without considering interaction among hy-drologic processes. Incorporating a land surface model into a GCM provides only calculation of one-dimensional sub-stance transportation without considering horizontal flux and hydrologic process interactions. The impact of horizontal
water flux on the land surface process has rarely been an area of focus. Moreover, in many previous studies, GCM output was simply used as input data in river routing models, with-out considering the interaction between the land surface and river routing processes.
2 Distributed hydrologic model
2.1 Flow routing model
To simulate river discharge in this study, a flow routing model, 1K-FRM, was applied. 1K-FRM is a distributed flow routing model based on one-dimensional kinematic wave theory. This model was developed in the Hydrology and Water Resources Research Laboratory, at Kyoto Uni-versity (http://hywr.kuciv.kyoto-u.ac.jp/products/1K-DHM/ 1K-DHM.html). The input topographic data is usually gener-ated from the Hydrological data and maps based on SHuttle Elevation Derivatives at multiple Scales (HydroSHEDS) 30 arc-second digital elevation model and flow direction data (Lehner et al., 2008). A program to generate input topo-graphic data from HydroSHEDS data is also available on the website for 1K-FRM.
2.2 Land surface model
To estimate land surface fluxes, a land surface model, Simple Biosphere including Urban Canopy (SiBUC), was applied. The SiBUC model (Tanaka, 2005) was developed by expand-ing the Simple Biosphere model (Sellers et al., 1986) to in-corporate the effects of land surface heterogeneity on land surface fluxes. SiBUC uses three sub-models (green area, ur-ban area, and water body) to describe each grid box, using a mosaic approach.
There are three layers for description of soil moisture in SiBUC. The prognostic equations for soil moisture are based on the Richards equation. When the infiltration rate into the top-soil layer is greater than hydraulic conductivity, the sur-face runoff,Qs, is calculated. Gravitational drainage from the
bottom layer is calculated as sub-surface runoff, Qsb, using
Darcy’s law.
In addition, an irrigation scheme was incorporated into the SiBUC model to handle artificial water control. For an irri-gation scheme, a water layer, which has a temperature and depth, is added to the ground in the green area sub-model to simulate the hydrologic cycle in a rice paddy field more accurately. The basic concept of an irrigation scheme for a rice paddy field is to maintain water depth above the sur-face of the green area within an appropriate range defined for each growing stage of the cropping rice. When the water depth in an irrigation scheme falls below the minimum water depth, adequate waterWr is supplied to the water layer on
the ground until the water reaches the optimal depth, with-out considering water sources. In this sense, supplied water,
Wr, denotes the irrigation water requirement for optimal crop
growth. The duration and appropriate range for each growing stage are shown in Table 1. The planting and harvesting dates for the crops were set as vegetation parameters.
Table 1.The duration of each growing stage with the percentage of total growing duration and maintained water depth (unit: mm) in each growing stage for optimal rice paddy field growth.
Growing stage 1 2 3 4 5
Duration 25 13 33 13 16
Minimum water depth 20 0 20 10 0 Optimal water depth 50 50 60 40 30 Maximum water depth 100 120 160 180 180
2.3 Crop growth model
A crop growth model was incorporated into the SiBUC model. A coupled crop growth model, ORYZA2000 (Van It-tersum et al., 2003) was used for leaf area index simula-tion, and the Simulation Model for Rice-Weather Relations (SIMRIW)-rainfed (Homma and Horie, 2009) was used for almost all crop growth simulation. In a crop growth model, temperature, possible sunshine duration, soil moisture and nutrients are considered as crop growing factors. This cou-pled SiBUC and crop growth model was evaluated in an irri-gated rice paddy field in Thailand (Yorozu et al., 2014).
2.4 Interaction among models
A distributed hydrologic model consists of the aforemen-tioned models. All models are driven independently and in-volve the interaction of stated variables with a certain time step. For a crop growth model, soil moisture is received from SiBUC to calculate the water stress component in crop growth. The leaf area index is given to SiBUC as a descrip-tion of the vegetadescrip-tion status. SiBUC provides surface and sub-surface runoff, and irrigation water withdrawal with 1K-FRM as lateral inflow. On the other hand, 1K-1K-FRM provides the river discharge rate as the irrigation water source for the irrigation scheme in SiBUC.
The continuity equation for the flow routing process in the developed distributed hydrologic model is given by
∂A
∂t +
∂Q
∂x =Qs+Qsb−Win, (1)
whereAis the cross section area,Qis the river discharge rate,t is time,x is distance upstream from an indicated grid point,QsandQsbare surface and sub-surface runoff,
respec-tively, andWinis the irrigation water withdrawal. In Eq. (1),
all terms on the right hand side are calculated by SiBUC. The equation is solved using applied Manning theory. The irriga-tion water withdrawal,Win, is calculated as follows:
Win=
D Fs (Wr> D Fs)
Wr (Wr≤D Fs) .
(2)
Here,Dis the water depth equivalent to the amount of river discharge per unit area, and Fs is irrigation efficiency. In
Eq. (2),DFs denotes the maximum amount of river water
3 Model application
3.1 Study area
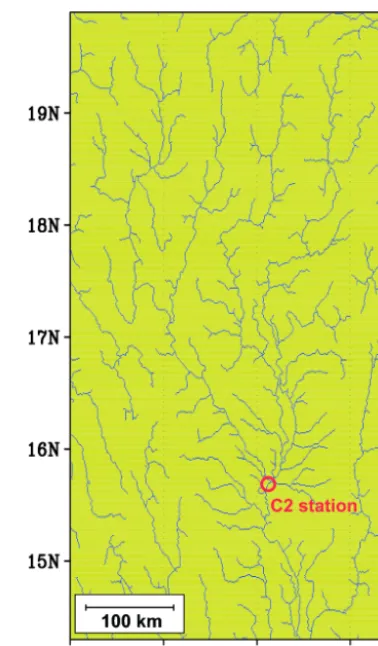
The distributed hydrologic model was applied to the Chao Phraya river basin to evaluate the effect of considering ar-tificial water control by irrigation on a hydrologic model of flood and drought simulation. Figure 1 shows the river chan-nel structure in the Chao Phraya river basin and one of the most important river discharge stations, C2.
3.2 Input data
One of the objectives in this study was to evaluate the ef-fect of irrigation water control on river discharge simulation. It was necessary to use meteorological forcing data with a high spatial resolution covering a long time period. Atmo-spheric reanalysis data covers the long-term period from the middle of the 20th century to the present, but the spatial res-olution is coarse. The Japanese 55-year reanalysis project (JRA55), which has one of the finest spatial resolutions among atmospheric reanalysis data, has a spatial resolution of ∼60 km. To achieve the objective in this study, the out-put from the MRI-AGCM3.2S (Mizuta et al., 2012), which has TL959 horizontal resolution corresponding to a grid in-terval of ∼20 km, was used as the meteorological forcing data. Temperature, wind speed and precipitation were pro-vided with a 1-hour time step. Surface pressure, specific hu-midity, downward shortwave radiation, downward longwave radiation and runoff rate were provided with a 3 h time step. In this study, simulation results for 1979–2008 were used for the climate data. These data were used without any bias cor-rections, because the objective in this research was not to evaluate the climate change impact on the hydrologic cycle, but to evaluate the effect of irrigation water control in a dis-tributed hydrologic model on a river discharge simulation.
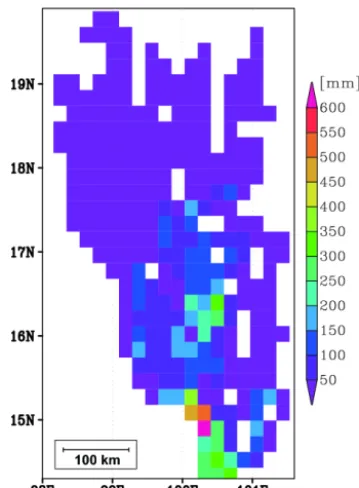
Land use data was based on the United States Geological Survey (USGS) Global Land Cover Characterization Sim-ple Biosphere Model (GLCC SiB2) category (http://edc2. usgs.gov/glcc/glcc.php). Land use categorization for each pixel was modified so that the irrigated paddy field area matched the United States’ Food and Agriculture Organi-zation (FAO) statistics (http://faostat.fao.org/) for Thailand. Figure 2 shows the fraction of land use category in each grid point for single cropping without irrigation, single cropping with irrigation and double cropping with irrigation. Eleva-tion, slope and river flow direction data were created from HydroSHEDS, which has a 1 km spatial resolution. For soil parameters, the EcoCliMap 1 km data (Masson et al., 2003) was selected. The vegetation parameter (leaf area index) for a paddy field was calculated using a coupled crop model. Ex-cept for the land use category, that data was taken from the USGS’ MCD15A3 1 km product.
Figure 1.River channel structure in the Chao Phraya river basin. The flow in the blue-colored grid is regarded as channel flow. Oth-erwise, a slope flow is considered. The red circle shows the C2 river discharge station.
3.3 Simulation design
The grid size for SiBUC and the crop model was∼20 km, the same as the meteorological forcing data. In contrast, a 1 km spatial grid size was applied to 1K-FRM for the flow routing model. All models were integrated using a 1 h time step and appropriate conversions made for variables with a 1-day time step. The simulation period was set from 1 Jan-uary 1979 to 31 December 2008. The first 1-year result was abandoned as relating to spin-up time. The planting date was set as 1 July for the rainy season crop and as 1 December for the dry season crop.
3.4 Experimental design
(a) Single cropping without irrigation (b) Single cropping with irrigation (c) Double cropping with irrigation.
Figure 2.The fraction of land use category in each grid.
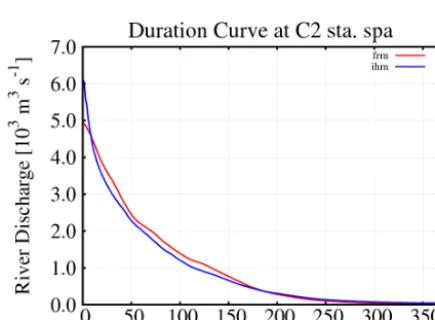
Figure 3.Duration curve at C2 Nakhon Sawan station. The red line shows the duration curve produced by the FRM and the blue line shows that by the IHM.
withdrawal. In the later simulation, lateral inflow was calcu-lated by SiBUC, including consideration of irrigation water withdrawal. Hereafter, the former simulation is referred to as the FRM, and the latter as the IHM.
4 Results
To evaluate the effect of irrigation water control on a river discharge simulation, the duration curve was compared. Fig-ure 3 shows the 29-year averaged duration curve for the C2 station. The larger river discharge at the C2 station was es-timated using the FRM simulation. In the IHM simulation, river discharge was withdrawn by irrigation. This led to de-creased lateral inflow to the flow routing model. The lateral inflow for the river routing model by the IHM and its differ-ence from the FRM are shown in Fig. 4. From this figure, it
Figure 4.Annual lateral inflow to a river routing model by the IHM and how it differs from the FRM (IHM-FRM).
Figure 5.Annual accumulated irrigation water withdrawal.
Figure 6.Averaged annual evapotranspiration by the IHM simula-tions and how it differs from the FRM (IHM-FRM).
For flood and drought situations, model results showed a different tendency. The annual maximum daily discharge calculated by the IHM was 6095 m3s−1, 24 % greater than
that by the FRM (4922 m3s−1). In Fig. 7, a time series of
river discharge estimations is shown. From this figure, it can be seen that river discharge by the IHM is increased only during a flood event. It is assumed that the surface runoff rate of the IHM is greater than that by the FRM because the soil water content was maintained at a high level by ir-rigation withdrawal. As for drought discharge, which is de-fined as the 355th largest daily discharge, the result from the IHM (44 m3s−1) showed a discharge 2.7-fold greater than
Figure 7.Comparison of time series of river discharge between the FRM (red line) and IHM (blue line).
the FRM (18 m3s−1). It seems that subsurface runoff in the
IHM was greater than that in the FRM. The results of this study suggests that considering hydrologic interactions in a numerical model could have an effect on both flood and drought estimation.
5 Summary
In this study, a distributed hydrologic model considering the interaction between flow routing and land surface pro-cesses was developed, and its effect on river discharge esti-mation was investigated. The study area was the Chao Phraya river basin and the developed model was carried out us-ing near surface meteorological data calculated by the MRI-AGCM3.2S with TL959 spatial resolution as forcing data. Modeling of flow routing, a part of the developed model, was carried out independently using surface and subsurface runoff data from the same GCM. As a result, the developed model tended to estimate a smaller river discharge than that estimated by the river routing model, because of the effect of the irrigation. In contrast, the annual maximum daily dis-charge from the developed model was 24 % greater than that from the flow routing model. It is assumed that surface runoff in the developed model was greater than that in the flow rout-ing model because the soil water content was maintained at a high level through irrigation withdrawal. As for drought dis-charge, which is defined as the 355th largest daily disdis-charge, the developed model gave a discharge 2.7-fold greater than the flow routing model. It seems that the subsurface runoff calculated by the developed model was greater than that by the flow routing model. The result of this study suggests that considering hydrologic interaction in a numerical model could have an effect on both flood and drought estimation.
References
Hirabayashi, Y., Mahendran, R., Koirala, S., Konoshima, L., Ya-mazaki, D., Watanabe, S., Kim, H., and Kanae, S.: Global flood risk under climate change, Nature Climate Change, 3, 816–821, 2013.
edited by: Elsworth, L. R. and Paley, W. O., Nova Science Pub-lishers, Inc., Chapter VII, 147–180, 2009.
Lehner, B., Verdin, K., and Jarvis, A.: New global hydrography de-rived from spaceborne elevation data, EOS T. Am. Geophys. Un., 89, 93–94, 2008.
Masson, V., Champeaux, J. L., Chauvin, F., Meriguet, C., and La-caze, R.: A global database of land surface parameters at 1-km resolution in meteorological and climate models, J. Climate, 16, 1261–1282, 2003.
Middelkoop, H., Daamen, K., Gellens, D., Grabs, W., Kwadijk, J. C. J., Lang, H., Parmet, B. W. A. H., Schädler, B., Schulla, J., and Wilke, K.: Impact of Climate Change on Hydrological Regimes and Water Resources Management in the Rhine Basin, Climatic Change, 49, 105–128, 2001.
Mizuta, R., Yoshimura, H., Murakami, H., Matsueda, M., Endo, H., Ose, T., Kamiguchi, K., Hosaka, M., Sugi, M., Yukimoto, S., Kusunoki, S., and Kitoh, A.: Climate simulations using MRI-AGCM3.2 with 20-km grid, J. Meteorol. Soc. Jpn., 90A, 233– 258, 2012.
Sellers, P. J., Mintz, Y., Sud, Y. C., and Dalcher, A.: A simple bio-sphere model (SiB) for use within general circulation models, J. Atmos. Sci., 43, 505–531, 1986.
Tanaka, K.: Development of the new land surface scheme SiBUC commonly applicable to basin water management and numerical weather prediction model, PhD thesis, Kyoto University, Japan, 2005.
Van Ittersum, M. K., Leffelaar, P. A., Van Keulen, H., Kropff, M. J., Bastiaans, L., and Goudriaan, J.: On approaches and applications of the Wageningen crop models, Eur. J. Agron., 18, 201–234, 2003.