O R I G I N A L A R T I C L E
Open Access
On the logical structure of census and
survey questionnaires
Griffith Feeney
1*†and Samuel Feeney
2†*Correspondence: [email protected]
†Griffith Feeney and Samuel Feeney contributed equally to this work. 1Griffith Feeney Consulting, Fairview Road, 10583 Scarsdale, NY, USA Full list of author information is available at the end of the article
Abstract
Skip instructions in census and survey questionnaires result in different groups of persons being eligible for different questions—thelogical structureof the questionnaire. Logical structure is important for analyzing census and survey data, for processing raw questionnaire data, and for questionnaire design and testing.
We define a simple, general, computer-readable representation of a questionnaire that incorporates information on skip instructions. Algorithms for automatic calculation of questionnaire paths and sets of eligible persons are presented and applied to the Malawi 2008 census questionnaire and IPUMS International sample dataset. The R code provided may be used to reproduce our results and to apply the algorithms to other questionnnaires and datasets. We show that dividing questionnaires into sections is a fundamental tool for understanding and limiting logical complexity.
We model questionnaires as programs intended for execution by an interviewer or respondent, rather than by a computer, and represent them by a software design diagram that presents information on questions, responses, and skip instructions in a form that is as readable as a traditional paper questionnaire, while simultaneously providing a precise specification that programmers may use to create an electronic version of the questionnaire.
Keywords: Electronic questionnaires, Census/survey data processing, Questionnaire skip instructions, Questionnaire routing structure, Eligibility for census/survey questions, Automated calculation of questionnaire paths, Automated assignment of not-applicable/nonresponse codes, Questionnaire documentation
In memory of
Anthony Hilton Burton, 1954–2018 Renaissance man, colleague, and friend
Introduction
No discipline is more fundamental to population science than understanding the instru-ments used to collect the data that inform empirical research. Population census and survey questionnaires are comprised of three fundamental elements: questions, possible responses to each question, and skip instructions. A skip instruction attached to a ques-tion may direct the interviewer or respondent to proceed to some quesques-tion other than the next question on the questionnaire.
Experienced researchers know the importance of having questionnaires and related metadata close at hand when analyzing data. Drawing valid conclusions requires
understanding the precise meaning of variables, and this often requires close scrutiny of the questions and responses from which variable values are derived.
Attention to skip instructions is equally important, though less widely recognized. The meaning of the set of responses to a question varies with the size and compo-sition of the groups of persons of whom the questions were asked, which is deter-mined by skip instructions. When comparing responses to similar questions from different surveys, differences in these groups may create selection biases that dis-tort conclusions. The number of persons who were asked a question is required to calculate the item non-response rate, a fundamental tool for assessing data quality.
In an ideal world, researchers might safely ignore the data processing that produces datasets for analysis from the raw data derived from completed questionnaires. In prac-tice, it is important to understand the editing to which the raw data has been subjected, partly to know the nature and extent of the imperfections the editing aims to correct, and partly to assess the appropriateness of the corrections. Skip instructions are fundamen-tal to editing because they determine how not-applicable and item non-response codes should be assigned.
Skip instructions are equally fundamental to questionnaire design. In the realm of official statistics, this is the province of the national statistical offices, but these offices typically solicit input from users on what information they would like to be collected. When researchers and other users propose questions it is important that they propose as well specific possible responses to questions and groups of persons to whom the questions should be addressed. Providing effective input requires understanding skip instructions and how they determine the group of persons who are asked any given question.
Literature on census and survey questionnaire design goes back to the earliest textbook on statistics (Bowley, 1901, 1937; Donnelly, 2015), but it has focused overwhelmingly on questions and possible responses. Insufficient attention has been paid to what we refer to as thelogical structureof a questionnaire: which questions are asked of which groups of persons. Logical structure is defined by skip instructions. Since logical struc-ture arises from the intrinsic applicability of particular questions to particular persons, it is as relevant to the forms used to record administrative data as it is to census and survey questionnaires.
The “Discussion” section compares our approach with the graph-theoretic approach pioneered by Picard (1965). The “Conclusion” section briefly recapitulates our aims and results and considers implications for practice, in general, and for successful transition from paper to electronic questionnaires in the 2020 round of world population censuses.
Skip instructions and progressions
Given a questionnaire, how can we calculate possible paths through the questionnaire— subsequences of questions that may be asked of a person? How can we calculate the subgroups of persons who are eligible for particular questions? Manual calculation of paths is impractical because, for all but the simplest questionnaires, there are too many of them. We must be able to automate the calculation. This requires a computer-readable representation of questionnaires that incorporates the information provided by skip instructions. Given the many advances in census and survey data processing over the past half century, it might be supposed that standard representations exist and are in common use, but this is not the case. The first order of business is therefore to develop a suitable computer-readable representation.
A skip instructionfollowing a question directs the interviewer to proceed, for some subgroup of persons, to some question other than the next question on the questionnaire. The question a skip instruction follows is theFromquestion. The question it directs the interviewer to ask next is the Toquestion. The subgroup of persons for which the To
question follows theFromquestion is specified by aFilter, a logical expression based on responses to theFromand/or preceding questions. Having asked theFromquestion, the interviewer will ask theToquestion if and only if theFilteris true.
Aprogressionis a triple (From,Filter,To). We allow progressions to represent a move-ment from any question to any other question, including the next question. The filter
Allsignifies that every person who is asked theFromquestion will also be asked theTo
question. These understandings make it possible to represent any questionnaire by a pro-gression table, a question table, and a response table, as defined in the “Progression tables” section below.
A questionnaire may be thought of as a list of instructions to be executed by an inter-viewer. The prototypical instructions direct the interviewer to ask a question and record the response, but other actions, such as introducing the respondent to the questionnaire and entering interview metadata, are equally important. Questionnaires may also include items that mark particular locations, such as the beginning or end of a section. Any action may be associated with the question “Has this action been completed?”, and any marker may be associated with the question “Has this point in the questionnaire been reached?” With these understandings, all actions may be regarded as questions with responses. Responses may be provided by respondents, by the interviewer or, in the case of elec-tronic questionnaires, by the computer program in which the questionnaire is embedded. Identifying all actions as questions is a terminological convenience, as illustratedpassim below.
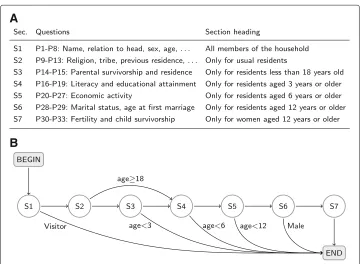
Figure1a shows several person questions and interviewer instructions from the Malawi 2008 population census questionnaire. The full questionnaire is available from the IPUMS International project website (Minnesota Population Center,2018b). Figure1b diagrams the logical structure of the questions. Circles represent questions, arrows progressions. Labels on a progression show what persons follow this progression. When there are only two progressions from a question, it suffices to label only one.
A merge question is a question that may be immediately preceded by one of two or more questions. In Fig. 1, P8 and END are merge questions. Merge ques-tions are the obverse of branching quesques-tions in the sense that branching quesques-tions divide persons into subgroups, whereas subgroups created by previous branch-ing questions are combined before merge questions are asked. Question P7a, for example, divides persons into Malawians and non-Malawians, but these subgroups are merged at question P8. Persons eligible for question P7a are therefore also eligible forP8.
Anendquestion is a question that is asked last for some group of persons. The last question on a questionnaire is an end question, but other questions may be end questions as well. In Fig.1b,P8is an end question. An end question that is not the last question is necessarily a branching question.
Afilter questionis a question referenced by any Filter. In Fig.1, P7aandP8are filter questions. Note thatP8is a branching question, a merge question, an end question, and a filter question. The above definitions describe attributes, not a classification, of questions.
Questionnaire paths
A path through a questionnaire is any subsequence of questions. A path is valid if the questions on the path might be asked of a person by an interviewer who receives
A
B
correct information from respondents and follows questionnaire instructions. We include invalid paths because unedited data will generally include invalid as well as valid paths. A valid path is completeif it begins with the first question on the questionnaire and ends with an end question. To avoid ambiguity, complete paths may be represented by the sequence of questions on the path followed by END and optionally preceded byBEGIN.
If there are multiple valid paths through a questionnaire, it is of interest to know what these paths are. When the number of branching questions is small, paths may be ascer-tained by inspection. The nine paths listed in Fig.2b, for example, may be read off from Fig.2a, which diagrams questions and progressions for the economic activity section of the Malawi 2008 census questionnaire (Minnesota Population Center, 2018b; see also Fig.3below).
Astructuralpath is formed by a sequence of progressions with the property that the
Fromquestion of each progression but the first is theToquestion of the preceding pro-gression. Structural paths may be thought of as subsequences of questions that might be asked by interviewers who chooseToquestions without regard to the Filters. A struc-tural path islogically invalidif it includes logically inconsistent filters. We show below that 16 structural paths through the Malawi 2008 person questions are logically invalid because they include the filtersage≥18 andage<6 and that 144 paths are invalid because they include the filters age≥18 and age<12 (“Application of the paths algorithms”).
A
B
The possibility of logically invalid paths is noted, with slightly different terminology, by Bethlehem and Hundepool (2004, p. 253) and Schiopu-Kratina et al. (2015, p. 2212). Automated calculation of paths
When the number of branching questions becomes large, identifying them by inspection becomes impractical. Algorithms for automated calculation are required. Thestructural paths algorithmbegins by constructing a first path through a questionnaire as follows. Begin with the first question. For this and every subsequent question, proceed to the soleToquestion for non-branching questions and the nearestToquestion for branching questions. Applied to Fig.2a, this gives the first path in Fig.2b. The metric for distance between questions is the difference between the questionnaire order of the questions. In Fig.2a, for example, there are two paths forward from questionP20,P20→P21, and
P20→P25. The nearestToquestion isP21.
Construct a second path from the first by proceeding backwards along the first path fromENDuntil a branching question is encountered. In Fig.2a, this will be questionP24. The first path followed the branch fromP24to the nearest To-question,P25, so let the second path followP24by the next-nearestToquestion,END. For the given path fromP20
toP24, all branches forward fromP24have now been followed.
The general procedure for deriving a new path from a given path is similar: backtrack from the end of the given path until a branching questionB with branches that have not yet been followed is encountered. If none is encountered, there are no more paths. Otherwise, the next path is the same as the given path through questionB, but the next question is the nearestToquestion among branches not yet followed. The questions on path forward from thisTo question may include one or more branching questions, so
Table 1Most frequent questionnaire paths: IPUMS International Malawi 2008 Census sample dataset No. Section 1 Section 2 S3 S4 S5 S6 Section 7 Number 1 1111 1110 1 1111 100000 1111 1 00000 000 0000 0000 00 0000 0000 132,923 2 1111 1110 1 1111 100000 1111 1 11111 111 1101 0000 00 0000 0000 117,789 3 1111 1110 1 1111 100000 0000 0 11111 111 1000 0111 11 0000 0000 109,360 4 1111 1110 1 1111 100000 1111 1 11111 000 0000 0000 00 0000 0000 100,687 5 1111 1110 1 1111 100000 0000 0 11111 111 1000 0111 11 1111 1111 62,701 6 1111 1110 1 1111 100000 1111 1 11111 111 1101 0000 10 0000 0000 41,295 7 1111 1110 1 1111 100000 1111 1 11111 111 1101 0000 10 1111 1111 39,547 8 1111 1110 1 0000 000000 0000 0 00000 000 0000 0000 00 0000 0000 38,430 9 1111 1110 1 1111 100000 0000 0 11111 000 1000 0111 11 1111 1111 35,078 10 1111 1110 1 1111 100000 0000 0 11111 111 1111 0000 11 1111 1111 33,308 11 1111 1110 1 1111 100000 0000 0 11111 111 1110 0111 11 1111 1111 31,432 12 1111 1110 1 1111 100000 0000 0 11111 111 1110 0111 11 0000 0000 30,077 13 1111 1110 1 1111 100000 0000 0 11111 111 1111 1000 11 1111 1111 29,159 14 1111 1110 1 1111 100000 1111 1 11111 111 0000 0000 00 0000 0000 24,936 15 1111 1110 1 1111 100000 0000 0 11111 000 1000 0111 11 0000 0000 22,832 16 1111 1110 1 1111 100000 0000 0 11111 000 1110 0111 11 1111 1111 22,078 17 1111 1110 1 1111 100000 0000 0 11111 000 1111 0000 11 1111 1111 21,795 18 1111 1110 1 1111 100000 0000 0 11111 111 1101 0000 10 0000 0000 20,355 19 1111 1110 1 1111 100000 0000 0 11111 111 1000 0111 10 0000 0000 18,662 20 1111 1110 1 1111 100000 1111 1 11111 111 1000 0111 00 0000 0000 14,268
there may be many paths forward. At each branching question, we follow the nearest-To -question rule—branch to the nearestToquestion that has not yet been followed.
This algorithm is a variation of Depth First Search (DFS) (Knuth 1997). Thevalid paths algorithmis similar, but the validity of paths is tested as they are produced and only valid paths are returned. The R implementations of both algorithms are given in Additional file2(see also Additional files3and4).
Application of the paths algorithms
Applying the structural paths algorithm to a progression table of all Malawi 2008 census person questions (Additional file1) gives 3714 structural paths. Applying the valid paths algorithm gives 3554 valid paths, indicating 160 invalid structural paths. Examination of the 160 invalid paths shows that the invalidity is due to a logical contradiction between the filter age≥18 and either (a) age<6 years (16 paths) or (b) age<12 years (144 paths) (see also “Modularization” section below).
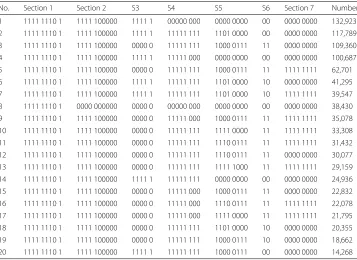
Persons in the IPUMS International Malawi 2008 sample dataset (Minnesota Popula-tion Center,2018a) may be tabulated by path, that is, by the subsequence of questions they were asked. The most notable feature of the resulting distribution is the concentra-tion of persons on a relatively small number of paths. Only 1030 paths are realized in the dataset, less than one third (29%) of the 3554 valid paths. Among the 1030 realized paths, the 20 most frequent paths account for 946,712 persons, just over 70% of the total sample. The 175 least frequent paths (not shown) occur for a single person only.
Table1shows numbers of persons for whom one of the 20 most frequent paths was fol-lowed. The representation of paths requires explanation. The most direct representation is the sequence of the questions on the path, as in the Path column of Fig. 2b, but a path may also be represented as the characteristic vector of the questions on the path regarded as a subset of all questions; that is, as the vector with one component for each question, with the jth component 1if the jth question is on the path and0
otherwise. This representation is shown in thePath-CVcolumn of Fig.2b, with vectors formatted as strings of ones and zeros. The economy and typographical consistency of this representation is better suited to tabular presentation than the list-of-questions representation. Readability is improved by grouping components by questionnaire sections.
TheSection 1substrings in Table1are the same in every row:1111 1110 1. The0in the next-to-last position indicates that the nationality question (P7b) is not on the path, which in turn indicates that persons who followed this path were Malawian.
The Section 2 substrings in the table are, with the single exception of row 8,
1111 100000. The last six questions in this section (P13a–P13f) provide information on type and cause of up to three disabilities. The first of these questions is asked of all per-sons, but subsequent questions are asked only of persons with one or more disabilities. The0entries in the last five positions of these substrings indicate that none of the persons represented in Table1were reported as disabled.
TheS3substrings in Table1are either11111or00000. It might at first be supposed that this indicates an error, since the second (fourth) question in this section is applicable only to persons whose mother (father) is surviving. Examining these strings for less frequent paths, not shown in the table, shows that they include strings for remaining combinations of mother/father living in same household as the respondent. These strings do not appear in Table1because deaths of parents are reported relatively infrequently.
The first row of the table, the most frequent path, is the only row that shows strings of zeros for SectionsS3–S7. These sections are applicable only to persons aged 6 years or older; hence, the persons with this path were less than 6 years old. This is the most fre-quent path partly because Malawi in 2008 had a young age distribution ([Malawi] National Statistical Office,2009) and partly because there are relatively few paths through the first three sections of the questionnaire (Table3, row 1).
Nassi-Shneiderman structured flow diagrams
Nassi-Shneiderman diagrams are a software specification and design tool (Nassi and Shneiderman,1973; Shneiderman,2003). More specifically, they are a redesign, suggested by structured programming (Dahl et al.1972), of traditional flow diagrams. They pro-vide a visualization of questionnaires that serves two very different but critically related purposes. The diagram of a questionnaire displays the questions, responses, and logical structure of a questionnaire in a form that is as easily readable as, and in some cases more readable than, a traditional paper questionnaire. Simultaneously, the diagram gives a precise design specification that may be used by computer programmers to produce an electronic version of the questionnaire.
Figure3 shows a Nassi-Shneiderman diagram of the Malawi 2008 census economic activity questions, the format lightly adapted for questionnaires. The blocks comprising the diagram show questions and possible responses. Each interview traces a path through the blocks, from top to bottom, with paths crossing horizontal lines only. An empty block directs the interviewer to proceed to the block below. Branching questions correspond to blocks that may be exited to two or more lower blocks, merge questions to blocks that may be entered from two or more upper blocks. Figure2a shows that the structure of the economic activity questions is complex, but is ill-suited to providing the detailed infor-mation required to understand the complexity. The Nassi-Shneiderman diagram provides this information and suggests likely reasons for the choices made by the questionnaire designers.
QuestionP20and the code2response to questionP21show that the questionnaire designers chose to begin by asking whetherNAMEworked during the past 7 days without reference to whether he or she had a job. Informal workers may regard themselves as not having jobs, so where informal work is common, asking whether a person worked during the reference period is preferable to asking whether they had a job (United Nations Statistics Division and International Labour Office (2009), Chapter IV, Sections B and C, pp. 52–81, esp. subsections B-3, B-4 and C-3).
Fig. 3Nassi-Shneiderman diagram Malawi 2008 census economic activity questions. Each interview traces a path through the blocks comprising the diagram, from top to bottom, with paths crossing horizontal lines only. IPUMS-assigned variable names are shown in parentheses following the questions. Compare the visualization in Fig.2a above
even if they did not work during the past 7 days—but only if they were looking for a job during the past 7 days.
Progression tables
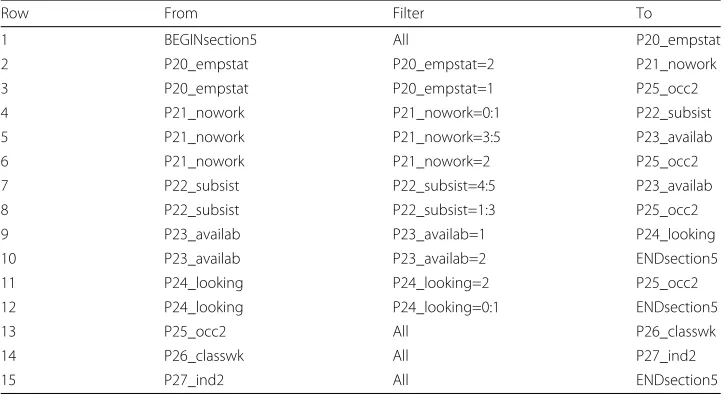
A progression table is a table with From, Filter, and To columns; one row for every progression defined by a questionnaire, including progressions for non-branching ques-tions; a first row containing the formal progression (BEGIN, All, P1); and a last row containing the formal progression (Pn, All, END), where P1 and Pn are the first and last questions. Rows are in questionnaire order of theFromcolumn, then by question-naire order of the To column. Progression tables may be made for a questionnaire as a whole or for sections on particular topics; provided, however, that every question that appears in the To column also appears in the From column (see the discussion of the constrained branching condition and the single section entry condition in the “Modularization” section below).
Table2shows a progression table for the economic activity questions on the Malawi 2008 census questionnaire (Figs.2a and3). Rows correspond to progressions (arrows) in Fig.2a. Branching questions occur in two or more consecutive rows in theFromcolumn, one row for eachToquestion. Merge questions occur in two or more not-necessarily-consecutive rows in theTocolumn, one row for eachFromquestion. Because the table is for the economic activity questions only, theBEGINandENDmarkers identify this section of the questionnaire. End questions correspond to rows containingENDsection5in the
Table 2Questionnaire progression table: Malawi 2008 Census economic activity questions
Row From Filter To
1 BEGINsection5 All P20_empstat
2 P20_empstat P20_empstat=2 P21_nowork
3 P20_empstat P20_empstat=1 P25_occ2
4 P21_nowork P21_nowork=0:1 P22_subsist
5 P21_nowork P21_nowork=3:5 P23_availab
6 P21_nowork P21_nowork=2 P25_occ2
7 P22_subsist P22_subsist=4:5 P23_availab
8 P22_subsist P22_subsist=1:3 P25_occ2
9 P23_availab P23_availab=1 P24_looking
10 P23_availab P23_availab=2 ENDsection5
11 P24_looking P24_looking=2 P25_occ2
12 P24_looking P24_looking=0:1 ENDsection5
13 P25_occ2 All P26_classwk
14 P26_classwk All P27_ind2
15 P27_ind2 All ENDsection5
Having asked and recorded the response to the From question, the interviewer asks the To question for the progression for which the filter is TRUE. Compare Figs.2a and3. Questions are identified using the questionnaire item label and the corresponding IPUMS-assigned variable name. The notation variable =x:ysignifies that the variable code lies betweenxandyinclusive
Progression tables must satisfy several conditions to be valid, including the following:
1 Every question must appear in theFromcolumn and in theTocolumn.
2 Questions in theFromcolumn must be in questionnaire order. Questions in theTo
column with the sameFromquestion must be in questionnaire order. 3 The logical expression in any row of theFiltercolumn must reference only
questions in theFromcolumn of this or preceding rows.
4 The logical filters in rows with the sameFromquestion must be mutually exclusive and collectively exhaustive.
Because tables are computer-readable, a program may be written to check these and other conditions. This is useful when constructing progression tables.
It is natural and convenient to refer to the entries in theFromandTo columns of a progression table as questions, but they are strictly speakingidentifiersof questions or of variables that give responses to questions. Aquestion tableshowing question identifiers and questions relates identifiers to questions. A response table (codebook) with ques-tion identifier, response, and code columns shows the codes for each response to each question.
Questionnaires may contain sequences of questions that are repeated for each instance of a particular type. These sequences are sometimes calledrosters. Census questionnaires, for example, are often household questionnaires that include person questions asked of each person in the household. On traditional paper questionnaires, these may be for-matted as tables with rows for persons, columns for questions, and cells for responses. The first person question is usually name of person, hence the “roster” designation. The Malawi 2008 census questionnaire is of this type.
the interviewer returns to the first person question and asks it of the next person in the household. The progression table will accordingly include progressions like the following after the last person question.
From Filter To
AnotherPerson AnotherPerson= Yes [1st person question, next person] AnotherPerson AnotherPerson= No [End of persons roster]
The first row effects repetition of the person questions for the next person in the house-hold. Roster questions for which there may be no instances, such as household deaths, require a branching question to determine whether there is any instance. If there is a limit to the number of instances for which information is collected, a branching question to ascertain whether this limit has been reached is also required.
For questionnaires that contain rosters, the paths and eligible persons algorithms are applied to each sequence of repeated questions as they would be to a questionnaire con-taining only these questions. The eligible persons algorithm will be repeated for each instance. The paths algorithms are run once only.
Eligible persons
A person iseligiblefor a question if this question would be asked of them by an inter-viewer who receives correct information from respondents and follows questionnaire instructions. The number of persons eligible for a question is the denominator of the item non-response rate for the question. These rates are an important tool for question-naire testing (Brancato et al.2006, sec. 6.3.1) and for assessing data quality (Eurostat2015, sec. 3.3.5).
Numbers of eligible persons for each question on a questionnaire are traditionally determined in stages. In the first stage, the questionnaire is scrutinized to construct a log-ical expression representing the set of persons eligible for each question. In the second stage, these expressions are incorporated into a computer program that processes person records and assigns, for each question, a not-applicable code for persons not eligible for the question and an item non-response code for eligible persons lacking a valid response. Constructing the required logical expressions can become unexpectedly complicated. Consider for example the logical expression for persons eligible for the main occupation question (P25_occ2) on the Malawi 2008 census questionnaire. Figure3shows that this question may be reached by five different paths.
P20→P25
P20→P21→P25
P20→P21→P22→P25
P20→P21→P22→P23→P24→P25
P20→P21→P23→P24→P25
P20_empstat= 2 andP21_nowork = 0:1andP22_subsist = 4:5and andP23_availab= 1 andP24_looking= 2,
where the notation variable = x:ysignifies that the variable code lies betweenxandy
inclusive. The logical expression for the set of persons eligible for the main occupation question is the logical disjunction of five such expressions, one for each of the five paths. The full expression requires nearly a dozen lines. The construction is simple in principle, but implementation is error prone, partly because of the large number of terms, and partly because manual quality assurance checks tend to be as error-prone as the work they are intended to check.
Automated calculation of eligible persons
Computer automation is clearly advantageous. It might be considered surprising, given the extensive development of data processing tools over the past half century, that this substantial manual component of determining sets of eligible persons persists. Fagan and Greenberg (1988) present an automated procedure, but it leans heavily on graph theory and seems not to be widely known.
Our eligible persons algorithmcomputes sets of eligible persons for all questions on a questionnaire using the progression table for the questionnaire and a dataset derived from the questionnaire. Entries in theFromandTocolumns of the progression table are understood to refer to vectors with one component for each person in a dataset, with the ith component giving the response code for the ith person (that is, the dataset is “vectorized”). The set of persons eligible for a question is represented by a logical vector with one component for each person, with theith componentTRUEif theith person is eligible for the question andFALSEotherwise.
Suppose first that there are no merge questions, excepting possiblyEND. Persons eligible for theToquestion in any row of the progression table are then persons who are (a) eligible for theFromquestion and for whom (b) theFilteris true. All persons are eligible for the first question, so the sets of persons eligible for each question may be calculated one after the other by working down the table row by row.
Merge questions introduce a complication. Persons eligible for question P25_occ2, “Main occupation”, in Table 2 above, for example, divide into four subgroups corre-sponding to the four blocks in the Nassi-Shneiderman diagram in Fig.3from which the
P25_occ2block may be entered: theP20block, theP21block, theP22block, and theP24
block. The first of these groups will be identified when row 3 of the progression table is processed, the second when row 6 is processed, the third when row 8 is processed, and the fourth when row 11 is processed (Table2). These are the rows in whichP25_occ2occurs as theToquestion.
Merge questions require a change in the row by row calculation of persons eligible for the Toquestion. For each row, we begin as before by determining, for the current row, the set A of persons who are eligible for the From question and for whom the
Filter is true. We then check whether the current row To question occurs as the To
for the current rowTo question are taken, again provisionally, to be persons who are either in setAor in set B. In both cases, we recognize that the set of eligible persons will be incomplete if the current rowTo question occurs as aTo question in any fol-lowing row. For merge questions, calculation of the set of persons eligible for a question is complete only when the last row in the progression table containing the question as aToquestion has been processed. The R implementation of this algorithm is given in Additional file2.
The logical vector representation of eligible persons points to a notable duality between paths and sets of eligible persons. Let persons and questions be numberedi=1, 2,. . .,n andj = 1, 2,. . .,m, respectively, and consider then×mmatrix whose ijth cell is 1if personiis eligible for questionjand0otherwise. This might be described as the “logical structure matrix” of the dataset: columns give sets of persons eligible for each question, and rows give the path for each person. Note however that this matrix shows only paths realized in the dataset, which may exclude a large proportion of possible paths.
Application of the eligible persons algorithm
The IPUMS International project assigns not-applicable (not-in-universe) and item non-response codes by manually constructing logical expressions for eligible persons (“Eligible persons” section). Comparing the IPUMS-assigned codes with codes automati-cally assigned using the eligible persons algorithm reveals three main discrepancies.
First, the questionnaire indicates that household visitors are not asked any questions beyondP8(Fig.1a above), but the IPUMS sample data set shows valid codes for the fertil-ity questionsP30–P33for all women aged 12 years and over, including visitors. Question
P8asks whether the person in question is apresent resident, absent resident,orvisitor and includes the instruction “If visitor (3), go to the next person”, i.e., do not ask any more questions of this person. This is confirmed by the enumerator instructions Minnesota Population Center (2018c), which read in part “Please note that the row has a filter for visitor. If the respondent is a visitor, skip to the next member of the household,” i.e., do not ask any more questions for this person. A possible explanation for this discrepancy is that responses to the fertility questions for visitors were mistakenly imputed during data editing.
Second, the questionnaire section heading over the parental survivorship questions (P14) and the birth certificate question (P15) readsonly for residents less that 18 years old, but the IPUMS data set shows valid response codes for these questions for persons aged 18 years as well as for persons under age 18 years. The explanation appears to be an inconsistency between the questionnaire and the enumerator manual. The enumera-tor manual states that these questions “should be asked for household members aged 18 years and less”, contradicting the questionnaire section heading. The item nonresponse and not-in-universe codes in the dataset are consistent with the enumerator instructions, not with the questionnaire.
Third, the IPUMS International dataset includes 31,002 individuals with not-in-universe codes for the detailed occupation question (P25_occ2) that the algorithm identifies as eligible for the question. This is apparently due to errors in the IPUMS International assignment of not-in-universe codes.
first comparison shows a discrepancy between the responses to the fertility questions in the data and the information in the questionnaire and the enumerator instructions. The second comparison reveals an inconsistency between the questionnaire and the enumer-ator instructions that might otherwise have been missed. The third comparison shows that even an organization as experienced as IPUMS International, which has processed datasets for hundreds of population censuses, may err in assigning stated and not-applicable codes when using the traditional method of manually working out logical expressions for sets of eligible persons.
Modularization
Questionnaires are commonly divided into sections containing sequences of questions and interviewer instructions. Sectional division is an elementary but important tool for questionnaire design. It is also a fundamental tool for understanding and limiting the logical complexity of a questionnaire.
We show first that the definitions, visualizations, and algorithms presented above for sequences of questions extend to sequences of sections. Figure 4a shows the sections into which the person questions on the Malawi 2008 census questionnaire are divided. Figure4b diagrams the sections and section progressions. For this diagram to be valid, however, it is necessary that branching questions in any section branch only to a question in the same section or to thefirstquestion of some subsequent section. If this is the case, we say that the sectional division satisfies theconstrained branching condition.
To see why this condition is necessary, suppose that it does not hold, that there is a branching question in SectionS4, say, that branches to a question beyond the first in
A
B
SectionS5. For Fig.4b to accurately portray the resulting structure, it would be necessary to add an arrow fromS4toS5indicating the origin and destination questions and a fil-ter to specify when this exceptional progression will be followed. This is, in general, an undesirable and unnecessary complication.
A section path is a subsequence of questionnaire sections. The definitions of valid, structural, complete, and realized paths extend directly to section paths. A person is eligible for a section if they are eligible for the first question in the section; subse-quent questions will be asked or not in accordance with interviewer instructions. Section paths may be read off from Fig. 4b; the 10 paths are listed in Table 3 below. Eli-gibility for sections may be read off using the labels on the progression arrows. All persons are eligible for the first section, but only non-visitors are eligible for the sec-ond section, only non-visitors under age 18 years are eligible for the third section, and so on.
The definitions of branching, merge, and end questions extend to sections. All sections in Fig.4b exceptS7are branching sections. All sections exceptS2are end sections.S4
is the only merge section. The definitions of progressions, filters, and progression tables likewise extend to sections.
If the constrained branching condition holds, there is a single entry point to each section, the first question. If there is a single entry point to every section, we say that the sectional division satisfies thesingle section entry condition. If there is a single entry point to a section, it must be the first question, for if it were a later question, the preceding ques-tions in the section would never be asked. The constrained branching and single section entry conditions are therefore equivalent.
If a questionnaire is divided into sections and the single section entry condition holds, any structural path through a section may be combined with any structural path through a following section, and the number of structural paths through the two sections combined is the product of the numbers through the individual sections. The same is true for any sequence of sections.
Table 3Composite calculation of number of question paths
Row Section path Calculation Question paths
1 S1→S2→S3→END 2× 4× 4 32
2 S1→S2→S3→S4→END 2× 4×4 ×2 64
3 S1→S2→S3→S4→S5→END 2× 4× 4× 2× 9 576 4 S1→S2→S3→S4→S5→S6→END 2× 4× 4× 2× 9× 2 1152 5 S1→S2→S3→S4→S5→S6→S7→END 2× 4× 4× 2× 9× 2×1 1152
6 S1→END 2 2
7 S1→S2→S4→END 2× 4× 2 16
8 S1→S2→S4→S5→END 2× 4× 2× 9 144
9 S1→S2→S4→S5→S6→END 2× 4× 2× 9× 2 288 10 S1→S2→S4→S5→S6→S7→END 2× 4× 2× 9× 2× 1 288
Structural paths 3714
Invalid paths 160
Valid paths 3554
Table3shows this calculation for the 10 paths through the 7 Malawi 2008 census person question sections. Summing the numbers of question paths for each section path over all section paths gives 3714 paths—the number given by the structural paths algorithm (“Application of the paths algorithms” section). In general, the calculation illustrated in Table3gives the correct number of structural paths if the single section entry condition holds. Table3shows that a large number of paths does not necessarily indicate a complex questionnaire; it may simply result from the power of multiplicative compounding.
Examining the filters in Fig. 4b, we see that age ≥ 18 for S2→S4 and age<6 for
S4→ENDare logically inconsistent, hence that the section pathS1→S2→S4→ENDand the 16 corresponding question paths are invalid (Table3, row 7). The 144 question paths cor-responding to the section pathS1→S2→S4→S5→END(Table3, row 8) are likewise invalid, for a total of 160 invalid paths—the number given by the valid paths algorithm.
The circles in Fig. 4b may be thought of as “pointers” to the questions and inter-viewer instructions in the corresponding sections or to diagrams of these questions and instructions. The overall structure of the questionnaire may thus be represented by a section diagram together with the diagrams for each section. The same applies to Nassi-Shneiderman diagrams. The practical importance of this observation should not be overlooked. The size and complexity of diagrams for an entire questionnaire may be visu-ally overwhelming. Modularization makes it possible to provide full documentation with a set of diagrams of manageable size and complexity. For readers familiar with computer programming, this is analogous to dividing computer programs into modules (Hunt and Thomas2000, Chap. 2).
Discussion
The research reported in this paper began several years ago with the first author’s interest in automating data processing tasks that require information on questionnaire skip instructions, specifically the assignment of not applicable and item nonresponse codes during data editing. Automation requires a computer-readable format for question-naires that includes information on skip instructions. It might be supposed that standard formats exist and are in common use, but this is not so.
Searching for a suitable format led to Fagan and Greenberg (1988), an unpublished US Census Bureau report that uses graph theory to analyze the structure created by skip instructions. The authors go beyond automating the calculation of sets of eligible per-sons, attempting to recognize questions that should have been answered but were not, and using logical structure to impute some missing values. The results appear impres-sive, but the graph-theoretic machinery is heavy and there is little attention to data structures.
Schiopu-Kratina et al. (2015) is the most recent publication we have found on this sub-ject. They cite (Picard,1965) as the pioneer, but state that his work has not yet been applied and suggest reasons for this. Their review of related work is the most thorough we have found, but only three citations deal specifically with graph theory in relation to questionnaires: Bethlehem and Hundepool (2004); Elliot (2012a,b).
Comparison of these works is complicated by different terminology, different approaches, and different objectives. What we refer to asBEGINandENDare referred to as “source” and “sink” by Fagan and Greenberg (1988, 3), as “start vertex” and “end vertex” by Bethlehem and Hundepool (2004, 242), and as “root” and “terminal” by Schiopu-Kratina et al. (2015, 2207). Our structural and valid paths are “logically possible routes” and “incor-rect routes” in Bethlehem and Hundepool (2004, 253). Our invalid paths are “empty paths” in Schiopu-Kratina et al. (2015, 2208).
Regarding approach, Fagan and Greenberg (1988, Fig. 1 andpassim) and Betlehem and Hundepool (2004, Fig. 4.1) represent questionnaires by graphs with a single arc from the
Fromquestion to theToquestion of a progression, but Elliot (2012a, Fig. 1) uses multiple arcs, one for each response to theFromquestion that results in theToquestion being asked next.
Regarding objectives, Betlehem and Hundepool (2004) are concerned mainly with accu-rate documentation of large and potentially complicated electronic questionnaires. They note that producing documentation is (was at the time of writing) a large, usually manual and therefore error-prone task, and they suggest that accurate documentation can only be obtained if it is generated automatically (p. 234). A similar point is commonly made by computer programmers with regard to quality assurance tests: the only way to ensure that tests are carried out is to automate them (Hunt and Thomas2000, “Ruthless Test-ing”, 237). Elliot (2012a) is concerned mainly with testing questionnaires. Schiopu-Kratina et al. (2015), Abstract introduce a special type of graph for use as a tool to design and improve questionnaires.
Despite this diversity, two common themes emerge. First, the graphs used to repre-sent questionnaires are a rather special case of graphs in general. Fagan and Greenberg (1988, 3), Bethlehem and Hundepool (2004, 242), Schiopu-Kratina et al. (2015, 2207) require representing graphs to be directed, acyclic, and have BEGIN and END nodes. Elliot (2012a), 12 allows representing graphs to be cyclic. Second, graph theory encom-passes no concept of contingency of arcs. For a graph as defined in graph theory, a pair of nodes is connected by an arc or not. For a questionnaire, we must know not only that question A may be followed by question B, but also in what circumstances this happens. Bethlehem and Hundepool (2004, 242-243), Elliot (2012a, 12), and Schiopu-Kratina et al. (2015,passim) make similar observations on the necessity of supplementing graphs with information on skip instructions. In short, graphs as defined in graph the-ory are unnecessarily general for representing questionnaires, and at the same time deficient in not recognizing contingency of arcs. These observations together with the learning curve imposed by graph theory may explain in part why the literature on mod-elling questionnaires by graphs is so sparse—a handful of papers over more than half a century.
tables. Questionnaire developers need not learn computer programming, only how to represent a questionnaire using these tools.
Conclusion
We began by emphasizing the importance of understanding the instruments used to col-lect population data and noting the negcol-lect of the logical structure of questionnaires created by skip instructions. Our first aim has been to explicate logical structure in the simplest possible terms and to provide methods for answering important questions that it raises. Our second aim has been to make our methods maximally accessible to researchers and national statistical offices throughout the world. As noted in the “Introduction” section, the methods are implemented in R (R Core Team,2019) and the R code provided may be used to reproduce our results and to apply our methods to other questionnaires and datasets.
We have shown how to automate the calculation of sets of eligible persons and the assignment of not applicable and item nonresponse codes, eliminating the manual, error-prone working out of logical expressions for sets of eligible persons. Our results on the distribution of paths in the IPUMS International sample of the Malawi 2008 census sug-gest several practical applications, most obviously estimating the length of interviews. The extreme concentration of the distribution of paths in the Malawi data suggests the importance of a systematic, empirically based approach. Estimating the numbers of per-sons who will be asked the questions in particular sections of a survey questionnaire is important for sample size calculations to limit standard errors. Tabulating paths realized in a dataset and identifying invalid paths has obvious relevance to data editing.
There is however a more fundamental reason for focusing attention on the logical struc-ture of questionnaires at this particular point in history. It has been clear for many decades that population censuses and surveys would eventually move from paper to electronic questionnaires. The first author anticipated the move 35 years ago (Feeney,1983). Face-to-face interviews will persist as internet and mobile phone connectivity spreads, but the explosion of smart phones and tablets over the past decade may signal the beginning of the end for paper questionnaires as the primary medium for population census and survey data collection.
It is unclear how well prepared the world’s national statistical offices—there are nearly 200 of them (United Nations Statistics Division, 2018)—are for this transition. Paper questionnaires are a relatively forgiving medium. Electronic questionnaires are com-puter programs, which are notoriously unforgiving. They promise wonderful benefits, but they introduce risks that do not exist for paper questionnaires, and with which many of the world’s national statistical offices have little or no experience—network connectivity, user interface design, software development. For a population census—an immensely costly, complete enumeration of a national population typically taken once every 10 years—software development failure could be catastrophic.
vocabulary for the contingencies created by skip instructions will enable them to commu-nicate more effectively with computer programmers responsible for developing electronic questionnaires.
The anticipated transition from paper to electronic questionnaires for the 2020 round of national population censuses will be a landmark in the history of population data col-lection. If ever there was a critical time to cultivate understanding of logical structure, it is now. We hope our work will play a role in achieving this.
Additional files
Additional file 1:Progression table for Malawi 2008 census person questions. (CSV 3 kb)
Additional file 2:R functions called by reproduce-results-script.R. (R 8 kb)
Additional file 3:Script for reproducing results presented in the paper. (R 10 kb)
Additional file 4:How to reproduce the results presented in the paper. (TXT 3 kb)
Acknowledgements
Special acknowledgement to the Malawi National Statistical Office and to the IPUMS International Project, without which this work would not have been possible. For comments on previous drafts and other assistance, we thank David Beckles, Tony Burton, William Cleveland, Arij Dekker, Jean-Michel Durr, Frank Eelens, Mahir Hattas, Christine Khoza, Bob McCaa, Angela Msosa, Tin Tin Nyunt, Julio Ortuzar, Ioana Schiopu-Kratina, Robert Reitter, Siu-Ming Tam, and Hania Zlotnik. Special thanks to anonymousGenusreviewers for meticulous and helpful comments. Thanks also to the Max Planck Institute for Demographic Research, which supported work on a closely related earlier paper during February 2017, and to members of the MPIDR review group, Christina Bohk-Ewald, Christian Dudel, Sebastian Kluesener, Mathias Lerch, Peng Li, Mikko Myrskyla, Roland Rau, and Timothy Riffe.
Funding
Not applicable.
Availability of data and materials
A sample dataset for the Malawi 2008 population and housing census is available from the IPUMS International project (Minnesota Population Center2018a). The results presented may be reproduced by creating and downloading sample extract files and using the following additional files.
Authors’ contributions
Questionnaire progression tables and the variable domains algorithm are due to the first author. The structural paths algorithm and its implementation as a recursive R function are due to the second author. The valid paths algorithm and most of the final R code are also due to the second author. Both authors contributed to the conception, drafting, and revision of the paper and read and approved the final manuscript.
Competing interests
Not applicable. We declare that we have no competing interests.
Publisher’s Note
Springer Nature remains neutral with regard to jurisdictional claims in published maps and institutional affiliations.
Author details
1Griffith Feeney Consulting, Fairview Road, 10583 Scarsdale, NY, USA.2Independent Software Developer, Fairview Road, 10583 Scarsdale, NY, USA.
Received: 31 January 2019 Accepted: 17 April 2019
References
Bethlehem, J., & Hundepool, A. (2004). TADEQ: a tool for the documentation and analysis of electronic questionnaires.
Journal of Official Statistics,20, 233–264.
Bowley, A.L. (1901).Elements of Statistics, First edition. London: P.S. King & Son.https://archive.org/details/ elementsstatist03bowlgoog. Accessed 13 Nov 2018.
Bowley, A.L. (1937).Elements of Statistics, Sixth [and last] Edition. London: Staples Press. For list of editions seehttps://www. worldcat.org/title/elements-of-statistics/oclc/712605232/editions?referer=di&editionsView=true. Accessed 13 Nov 2018.
Dahl, O.J., Dijkstra, E.W., Hoare, C.A.R. (1972).Structured Programming. London: Academic Press.
De Leeuw, J. (2005). On Abandoning XLISP-STAT.Journal of Statistical Software,13(7).https://www.jstatsoft.org/article/ view/v013i07. Accessed 11 Dec 2018.
Donnelly, S. (2015). Arthur Bowley – LSE’s first statistician.London School of Economics and Political Science: LSE History Blog. http://blogs.lse.ac.uk/lsehistory/2015/11/04/arthur-bowley-lses-first-statistician/. Accessed 13 Nov 2018.
Elliot, S. (2012a).The Application of Graph Theory to the Development and Testing of Survey Instruments: Statistics Canada. http://www.statcan.gc.ca/pub/12-001-x/2012001/article/11681-eng.pdf. Accessed 26 Oct 2018.
Elliott, S. (2012b). The application of graph theory to the development and testing of survey instruments.Survey Methodology,38, 1121.
Eurostat (2015).ESS Handbook for Quality Reports, 2014 edition: Eurostat.http://ec.europa.eu/eurostat/documents/ 3859598/6651706/KS-GQ-15-003-EN-N.pdf/18dd4bf0-8de6-4f3f-9adb-fab92db1a568. Accessed 26 Oct 2018. Fagan, J., & Greenberg, B.V. (1988).Using Graph Theory to Analyze Skip Patterns in Questionnaires: United States Census
Bureau.https://www.census.gov/srd/papers/pdf/rr88-06.pdf. Accessed 26 Oct 2018.
Feeney, G. (1983). A microprocessor revolution in data collection?Asian and Pacific Census Forum,10(1), 1 and 13.http:// hdl.handle.net/10125/3583. Accessed 09 Dec 2018, but page performance is erratic. See alsohttp://demographer. com/gfeeney/publications/1983-microprocessor-revolution/feeney-1983-microprocessor-revolution-in-data-collection.pdf. Accessed 20 Dec 2018.
Hunt, A., & Thomas, D. (2000).The Pragmatic Programmer. Boston: Addison-Wesley.
Knuth, D.E. (1997).The Art of Computer Programming, Volume 1: Fundamental Algorithms, 3rd Edition: Addison-Wesley. eBook by informIT. Note Knuth’s comments on eBook versions:https://www-cs-faculty.stanford.edu/~knuth/taocp. htmlAccessed 25 Nov 2018.
[Malawi] National Statistical Office (2009).2008 Population and Housing census: Main Report. Zomba.http://www. nsomalawi.mw/images/stories/data_on_line/demography/census_2008/MainReport/CensusMainReport.pdf. Minnesota Population Center (2018a). Integrated Public Use Microdata Series, International: Version 6.5 [dataset].http://
doi.org/10.18128/D020.V6.5. Accessed 26 Oct 2018.
Minnesota Population Center (2018b). Main questionnaire, Malawi 2008 Population and Housing census.https:// international.ipums.org/international/resources/enum_materials_pdf/enum_form_mw2008a.pdf. Accessed 26 Oct 2018.
Minnesota Population Center (2018c). Enumerator’s Manual, Malawi 2008 Population and Housing census.https:// international.ipums.org/international/resources/enum_materials_pdf/enum_instruct_mw2008a.pdf. Accessed 26 Oct 2018.
Nassi, I., & Shneiderman, B. (1973). Flowchart techniques for structured programming.https://www.researchgate.net/ publication/234805404_Flowchart_techniques_for_structured_programming. Accessed 26 Oct 2018. Open Source Initiative (2019).https://opensource.org/osd. Accessed 21 Jan 2019.
Picard, C. (1965).Théorie des Questionnaires. Paris: Gauthier-Villars.
R Core Team (2019).R: A Language and Environment for Statistical Computing. Vienna.https://www.R-project.org/. Accessed 21 Jan 2019.
Schiopu-Kratina, I., Zamfirescu, C.M., Trépanier, K., Marques, L. (2015). Survey Questionnaires and Graphs.Electronic Journal of Statistics,9, 2202–2254.http://dx.doi.org/10.1214/15-EJS1067. Accessed 20 Nov 2018.
Shneiderman, B. (2003). A short history of structured flowcharts (Nassi-Shneiderman Diagrams).https://www.cs.umd. edu/hcil/members/bshneiderman/nsd/. Accessed 23 Nov 2018.
Sirkin, M. (1972).Designing Forms for Demographic Surveys. Laboratory for Population Statistics Manual Series, No. 3. Chapel Hill: University of North Carolina Available from the Carolina Population Center, University of North Carolina. Tierney, L. (2004). Some Notes on the Past and Future of Lisp-Stat.Journal of Statistical Software,13(9).https://www.
jstatsoft.org/article/view/v013i09. Accessed 11 Dec 2018.
United Nations Statistics Division (2018). National Statistical Offices.https://unstats.un.org/home/nso_sites/. Accessed 30 Nov 2018.
United Nations Statistics Division and International Labour Office (2009).Handbook on Measureing the Economically Active Population and Related Characteristics Studies in Methods Series F, No. 102. New York. United Nationshttps://unstats.un. org/unsd/demographic/sources/census/Entire%20Handbook.pdf. Accessed 21 Apr 2019.
Submit your manuscript to a
journal and benefi t from:
7Convenient online submission
7Rigorous peer review
7Immediate publication on acceptance
7Open access: articles freely available online
7High visibility within the fi eld
7Retaining the copyright to your article