Characteristic
Shivendra Raghuvanshi1 , Sumit Kumar Singh2 , Dr. Pankaj Agarwal3 1M.E scholar at Samrat Ashok Technological Institute Vidisha (M.P),
2Department of mechanical engineering Sagar Institute of Research and Technology Bhopal (M.P) 3Department of mechanical engineering Samrat Ashok Technological Institute Vidisha (M.P).
Abstract - Micro-EDM has become an important and cost-effective method of machining extremely tough
and brittle electrically conductive materials. It is most widely used in process of making dies and moulds and complex sections geometry and some intricate shapes. work piece material is choosed in this experiment by using AISI 304 Stainless steel. Today’s world 304 stainless steel is contributes to almost half of the world’s production and the consumptions for industrial purposes. The input variable parameters are pulse on time ,current and duty cycle. The effect of variable parameters that is mentioned above upon the machining characteristics such as MRR, SR and Overcut (OC) is studied.. The tool material is copper in this experiment.
The results obtained showed that the current was the most significant parameter is followed by the pulse on time and the least significant was duty cycle for entire three responses namely MRR, Surface roughness(SR) and OC. With the increase in current and duty cycle MRR is increased but for pulse on time it increased only up to 100 micro second and then started to decrease. SR increased significantly with the increase in current; for pulse on time it increased up to 100 micro second and after that there was no significant increase; and in case of duty cycle SR increased up to 70% and then started to decrease.
Keywords— micro edm, stainless steel, MRR, Surface Roughness, OC, Taguchi method.
I. INTRODUCTION
Micro-EDM Electro discharge machining (EDM) is a known and it is most widely used nonconventional machining process for hard materials because of its ability to function on brittleness, hardness or toughness of the work piece. Using low energies, it has been successfully applied in micro- machining, for example, it is used in the mould making industry.Give higher accuracies in smaller and more complex structures and an extremely stable process. Additionally, more high-tech materials such as ceramics are used for micro parts; this presents an opportunity to apply micro EDM in that emerging material area. Process Principle of electro discharge machining process based on ablation of material through evaporation and melting. The electrical discharges take place between tool electrode and work piece which is in a dielectric medium that separates.
II. WORKING PRINCIPLE OF MICRO-EDM
In Micro EDM process, the principle is conversion of electrical energy into thermal energy through a series of discrete sparks occurring between the conductive work-piece and tool electrode immersed in a dielectric medium and separated by small gap. Short duration discharges are generated in the liquid dielectric gap, which separates work-piece and tool. In this process electrical energy is used to generate the electrical spark and thermal energy is used for material removal. The electrode is moved towards the work piece until gap is small enough to ionized the dielectric. The dielectric flush eroded particles from gap and it is important to maintain this flushing continuously.
In this process metal is removing from the work piece due to erosion case by rapidly recurring spark discharge taking place between work piece and tool. Shown the mechanical and electrical set up and electrical circuit for electric discharge machining.A thin gap about 0.025mm is maintained between work piece and tool by the servo system. Both work piece and tool are submerged in dielectric fluid .Deionized water/ Kerosene/EDM oil is common type of liquid dielectric although gaseous dielectrics are mostly used in certain cases.
III. CHARACTERISTICS OF MICRO-EDM
MICRO-EDM specification by mechanism of process, metal removal rate and other function that shown in this table no.1
Table -1
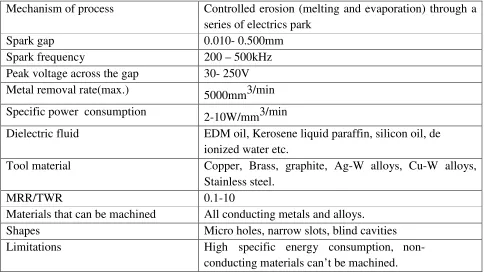
Mechanism of process Controlled erosion (melting and evaporation) through a series of electrics park
Spark gap 0.010- 0.500mm
Spark frequency 200 – 500kHz Peak voltage across the gap 30- 250V Metal removal rate(max.) 5000mm3/min
Specific power consumption 2-10W/mm3/min
Dielectric fluid EDM oil, Kerosene liquid paraffin, silicon oil, de ionized water etc.
Tool material Copper, Brass, graphite, Ag-W alloys, Cu-W alloys, Stainless steel.
MRR/TWR 0.1-10
Materials that can be machined All conducting metals and alloys. Shapes Micro holes, narrow slots, blind cavities Limitations High specific energy consumption,
non-conducting materials can’t be machined.
IV. IMPORTANT PARAMETERS OF MICRO-EDM
(a) Spark on-time: The duration of time for current is allowed to flow per cycle. The Material removal is
(b) Spark off-time : The duration of time between the sparks (that is to say, on-time). This time allows the molten material to solidify and to wash out of the arc gap. This parameters is to affect the speed and the stability of the cut. Thus, if the off-time is short, it will cause sparks to be unstable.
(c) Arc gap : The Arc gap is distance between electrode and work piece during the process of micro EDM.
It called as spark gap. Spark gap can be maintained by the servo System.
(d) Discharge current : Current is measured in the ampier, Allowed to per cycle. Discharge current is
directly proportional to Material removal rate.
(e) Duty cycle : It is the percentage of on-time relative to total cycle time. This parameter is calculated by
dividing the on-time by on-time pulse off time.
(f) Voltage : It is a potential that can measure by the volt and it is also effect to the MRR and allowed to
per cycle. Voltage is given 50 V.
(g) Diameter of electrode : It is electrode of Copper-tube there are two different size diameter 4mm and
6mm in experiment. This tool is used not only as an electrode but it is also for internal flushing.
(h) Over cut – It is clearance between electrode and the work piece after the marching operation.
V. EXPERIMENTAL SETUP AND METHODOLOGY
For this experiment the whole work can be done by Micro Electric Discharge Machine, model ELECTRONICA- ELECTRAPULS PS 50ZNC with servo-head (constant gap) and positive polarity for electrode was used to conduct the experiments. Commercial grade EDM oil (specific gravity= 0.763, freezing point= 94˚C) was used as dielectric fluid. With internal flushing of 304 stainless steel tool with a
pressure of 0.2 kgf/cm
2
.
VI. PROCESS PARAMETERS OF MICRO-EDM PROCESS Table-2
S.No. Parameters Range
1 Frequency 0-230KHz
2 Pulse width 1-10 s
3 Gap% of Voltage 65-100%
4 Gain 0-100
5 Pulse peak currant 45A
6 Output Voltage 70-250V
7 Dwell time 0.205
8 Polarity +/-
9 Hole diameter 0.05-1mm
10 Spindle speed 200-1000
VII. SELECTION OF THE WORK PIECE
It is capable of machining of hard material such as the heat treated tool steels, super alloys, ceramics, carbides, composites, heat resistant steels etc. The higher carbon grades are rarely used for applications such as metal cutting tools, stamping dies etc. AISI grades of tool steel is the most commonly used scale to identify the various grades of tool steel. Individual alloys with in grade are given a numbers; for example:P20, A2, O1, D2 etc. In this experiment using AISI tool steel material this AISI 304 tool steel material is pre hardened high tensile tool steel which offers ready machine ability in hardened and tempered condition, therefore it does not require any heat treatment. Subsequent component modifications can be easily find out.
VIII. MECHANISM OF MRR
The mechanism of material removal of micro EDM process is most commonly established principle is the conversion of electrical energy into the thermal energy. During this process of machining the sparks are produced between the work piece and the tool .
The MRR is expressed as the ratio of difference in weight of work piece before and after the machining to the density of material and machining time.
= −
×
Where
Wi= Initial weight before machining
Wf= final weight after machining
t = machining time = 15 min
ρ is the density of AISI 304 stainless steel = 8000 kg/m3
Mechanism of Surface Roughness
Mechanism of over cut
It is the discharged by which machined hole in work piece exceeds the electrode size and it is determined by both the initiating voltage and discharge energy. During this machining process of EDM cavity produced are larger than electrode this deference is known as Over Cut .
It becomes very important when the close tolerance components are required to produced for space application and it is also used in dies, tools and moulds for press work.
= −
2 Where ;
Diis diameter of hole and Dois diameter of tool.
IX. DESIGN OF EXPERIMENTS ANALYSIS
Genichi Taguchi developed some statistical method is used to improve the qualities of manufactures good known as the Taguchi methods. The design provides the potential and efficient method for designing a different products that can be operate consistently over the wide range of conditions. Minitab provide for both static and dynamic response of experiments. This design of experiments is used to find out the best combination of input variables in a orthogonal array.
Machining parameters and their levels:-
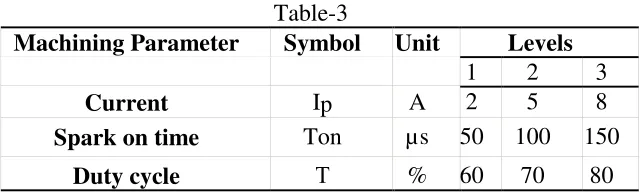
Table-3
Machining Parameter Symbol Unit Levels
1 2 3
Current Ip A 2 5 8
Spark on time Ton µs 50 100 150
Duty cycle Τ % 60 70 80
Table Fixed Parameters and their levels:-
Table-4
SEN ASEN Voltage Tw T0 Flushing Pressure
(kg/cm2)
6 3 45 0.6 0.1 0.25
X. RESULT AND DISSCUSSION
In the experiment, input parameters consider are Current (I), Spark on time (Ton), and Duty cycle (τ). Since 3 factors are select the design becomes a three level three factorial Taguchi design. L27 orthogonal array was select for experiments to be conducted.
Observation Table-5
S.No Current
(Ip)
Machinig Time (Ton)
Duty cycle
(τ) MRR
(mm3/min)
SR (µm)
OC (mm)
1 2 50 70 1.6341 5.423 0.014
2 2 50 80 2.4165 5.876 0.019
3 2 50 90 1.4243 4.240 0.018
4 2 100 70 1.9435 4.676 0.089
5 2 100 80 2.2513 4.742 0.062
6 2 100 90 2.3870 4.320 0.074
7 2 150 70 1.9870 4.832 0.098
8 2 150 80 2.3244 4.750 0.092
9 2 150 90 2.3421 4.000 0.098
10 5 50 70 7.4687 6.010 0.102
11 5 50 80 8.4762 6.500 0.140
12 5 50 90 8.9543 6.320 0.050
13 5 100 70 8.3765 7.450 0.088
14 5 100 80 9.4367 7.410 0.154
15 5 100 90 9.6431 7.950 0.088
16 5 150 70 7.8451 6.900 0.098
17 5 150 80 9.3180 7.950 0.198
18 5 150 90 9.6080 8.000 0.186
19 8 50 70 14.5328 6.800 0.184
20 8 50 80 17.3566 7.240 0.178
21 8 50 90 17.7532 7.650 0.162
22 8 100 70 15.9321 8.976 0.190
23 8 100 80 18.9823 10.100 0.228
24 8 100 90 20.6532 10.120 0.202
25 8 150 70 14.8762 10.110 0.204
26 8 150 80 16.9984 9.790 0.226
27 8 150 90 19.6530 10.000 0.228
Analysis and Discussion of MRR
Main Effects Plot for MRR
Analysis of Variance for Means of MRR
Table-6
Source DF Seq SS Adj MS F P % cont.
Ip 2 1057.93 528.963 4893.21 0.000 96.231
Ton 2 5.06 2.529 23.39 0.000 0.4602
Τ 2 18.45 9.227 85.36 0.000 1.6782
Ip*Ton 4 3.10 0.774 7.16 0.009 0.282
Ip*τ 4 13.16 3.291 30.44 0.000 1.1971
Ton*τ 4 0.80 0.200 1.85 0.213 0.072
Residual Error 8 0.86 0.108 0.078
Total 26 1099.36
Here :- S = 0.3288, R-Sq= 99.9%, R-Sq(adj) =99.7%
Response Table for Mean of MRR: Table-7
Level Ton Τ
1 1.924 8.720 8.123
2 8.627 9.780 9.573
Delta 15.294 1.060 1.949
Rank 1 2 3
Table-7 shown variable sources such as pulse on time, current,duty cycle and the interactions between these three factors. Subsequently in following columns degree of freedom, Sum of squares , adjusted mean of square, Probability and distribution are calculated respectively.
Analysis and Discussion of Surface Roughness
Surface Roughness increases with the increase in current within range of experimental conditions. In case of pulse on time Surface Roughness increased up to 100µs and then increment is very slight. With respect to duty cycle, Surface Roughness first increases up to 70% and then decreases after that.
Analysis of Variance for Means of SR
Table-8
Source DF SeqSS AdjMS F P % cont.
Ip 2 84.121 42.0607 300.05 0.000 78.553
Ton 2 8.378 4.1890 29.88 0.000 7.8234
Τ 2 0.440 0.2198 1.57 0.266 0.411
Ip*Ton 4 10.873 2.7182 19.39 0.000 10.153
Ip*τ 4 1.906 0.4765 3.40 0.066 1.7798
Ton*τ 4 0.248 0.0621 0.44 0.775 0.2316
ResidualError 8 1.121 0.1402 1.0468
Total 26 107.088
Here: - S =0.3744, R-Sq= 99.0%, R-Sq(adj) = 96.6%
Response Table for Mean of SR
Table-9
Level Ip Ton τ
1 4.569 6.057 6.667
2 7.080 7.162 6.969
3 8.873 7.304 6.887
Delta 4.304 1.246 0.302
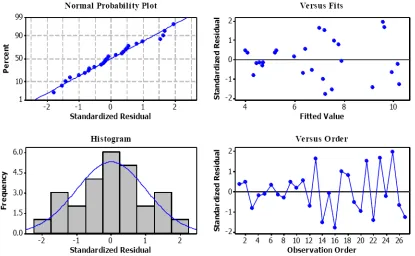
Residual Plots for SR
Analysis and Discussion of Overcut
The overcut increases with the increasing current within the given range of values. The OC increases linearly with the increase in Ton. But in case of τ the OC first increases up to70% and then decreases.
Analysis of Variance for Means of OC
Table-10
Source DF SeqSS AdjMS F P % cont.
Ip 2 0.083694 0.041847 92.43 0.000 71.787
Ton 2 0.016174 0.008087 17.86 0.001 13.873
Τ 2 0.002150 0.001075 2.37 0.155 1.844
Ip*Ton 4 0.003017 0.000754 1.67 0.250 2.5878
Ip*τ 4 0.004790 0.001197 2.64 0.113 4.1085
Ton*τ 4 0.003137 0.000784 1.73 0.236 2.6907
Residual Error 8 0.003622 0.000453 3.1067
Total 26 0.116585
Here: -S =0.02128, R-Sq= 96.9%, R-Sq(adj) =89.9%
Level Ip Ton τ
1 0.05933 0.09367 0.11656
2 0.11856 0.12600 0.13689
3 0.19533 0.15356 0.11978
Delta 0.13600 0.05989 0.02033
Rank 1 2 3
From the ANOVA table it can be seen that current and pulse on time are the significant parameter.
Also there are no significant interactions. The standard deviation of error S=0.02128 and R2= 89.9%. The residual plots and the interaction plots for the overcut are shown in the graphs below. From the graph it can be seen that no interactions are significant.
Residual Plots for OC
XI. CONCLUSION
In this study, experiment was conducted by the considering three variable parameters namely pulse on time, current and duty cycle. The objective was find to the Surface Roughness, Material Removal Rate and Overcut, study about the effects of variable parameters on these characteristics. The tool material taken as copper and the work piece was chosen as AISI stainless steel.
Following conclusions were drawn:
• For the MRR most significant factor was found to peak current followed by the pulse on time. MRR
increased nonlinearly with increase in current. For Ton the MRR first increase till 100 µs and then it was decreased. With increase in duty cycle.
• For Surface Roughness most significant factor was again current followed by pulse on time and
fashion. For increase in pulse on time Surface Roughness increased up to 100 µs and then there was no increase. In case of the duty cycle, SR first increase up to 70% and then it started to decrease.
• For OC most significant factor was the current followed by pulse on time and the duty cycle
respectively. OC increased along with in the increase in current. For increase in pulse on time, OC is increased linearly. Finally for the duty cycle, OC increased but only up to 70% and then it started decreasing.
REFERENCE
[1] K.H. Ho and S.T. Newman, “A State of the art electrical discharge machining (EDM)”International Journal of Machine Tools &Manufacture 43 (2003) 1287–1300
[2] Anand Pandey and Shankar Singh “review on Current research trends in variants of Electrical Discharge Machining” International Journal of Engineering Science and Technology Vol. 2(6), 2010,2172-2191.
[3] M. Kunieda, B. Lauwers, K. P. Rajurkar, B.M. Schumacher4 “Advancing EDM through Fundamental Insight into the Process”.
[4] Michael F. W. FestingGuidelines for the Design and Statistical Analysis of Experiments” ATLA, 2001.
[5] J.L. Lin and C.L. Lin “grey-fuzzy logic for the optimization of the manufacturing process” Journal of Materials Processing Technology 160 (2005).
[6] Prof. Dr.-Ing. A. Behrens and Dipl.-Ing. M.P. Witzak “New arc detection technology for highly efficient electro-discharge machining” 85 - 22043 Hamburg.
[7] C. K. Biswas and ShaileshDewangan investigate Optimisation of EDM Process with Fuzzy Logic Technique, International Conference on Metallurgical, Manufacturing and Mechanical Engineering (ICMMME'2012) December 26-27, 2012 Dubai (UAE).
[8] Samar Singh and MukeshVerma had done A Parametric Optimization of Electric Discharge Drill Machine Using Taguchi Approach published in Journal of Engineering, Computers & Applied Sciences (JEC&AS), ISSN No: 2319-5606, Volume 1, No.3, December 2012.
[9] Yih-fongTzeng and Fu-chen Chen, “Multi-objective optimisation of high-speed electrical discharge machining process using a Taguchi fuzzy-based approach” Materials and Design 28 (2007) 1159–1168,science direct.
[10] J.L. Lina, K.S. Wangb, B.H. Yan and Y.S. Tarng “Optimization of the electrical discharge machining process” Journal of Materials Processing Technology 102 (2000) 48-55.
[11] MohdAmriLajis , H.C.D. MohdRadzi, The Implementation of Taguchi Method on EDM Process ofTungsten Carbide, European Journal of Scientific Research ISSN 1450-216X Vol.26 No.4 (2009), pp.609-617.
[12] S.H.Lee, X.P Li, “Study of the effect of machining parameters on the machining characteristics in electrical discharge machining of tungsten carbide” ,Journals ofMaterial Processing Technology 115 (2001) pp.344-358.
[13] Kapil Banker, UjjvalPrajapati, JaiminPrajapati, Paras Modi “Parameter optimization of Electro Discharge Machine of AISI 304 Steel by using Taguchi Method” International Journal of Application or Innovation in Engineering & Management, Volume 3, Issue 8, August 2014 ISSN 2319 – 4847.
[14] Mu-Tian Yan , Hsing – TsungChien,Monitoring& Control of the micro wire –EDM process, International Journal of Machine Tools & Manufacture ,47(2007)pp.148-157.