https://doi.org/10.5194/os-15-583-2019
© Author(s) 2019. This work is distributed under the Creative Commons Attribution 4.0 License.
Impacts of Three Gorges Dam’s operation on spatial–temporal
patterns of tide–river dynamics in the Yangtze River estuary, China
Huayang Cai1,2,3,4, Xianyi Zhang1,2,3, Min Zhang5, Leicheng Guo4, Feng Liu1,2,3, and Qingshu Yang1,2,3 1Institute of Estuarine and Coastal Research, School of Marine Engineering and Technology,
Sun Yat-sen University, Guangzhou, China
2Guangdong Provincial Engineering Research Center of Coasts, Islands and Reefs, Guangzhou, China 3Southern Marine Science and Engineering Guangdong Laboratory (Zhuhai), Zhuhai, China
4State Key Laboratory of Estuarine and Coastal Research, East China Normal University, Shanghai, China 5School of Environmental and Geographical Sciences, Shanghai Normal University, Shanghai, China Correspondence:Min Zhang ([email protected])
Received: 8 December 2018 – Discussion started: 8 January 2019 Revised: 6 May 2019 – Accepted: 8 May 2019 – Published: 28 May 2019
Abstract. The Three Gorges Dam (TGD), located in the main stream of the Yangtze River, is the world’s largest hy-droelectric station in terms of installed power capacity. It was demonstrated that the TGD had caused considerable mod-ifications in the downstream freshwater discharge due to its seasonal operation mode of multiple utilisation for flood con-trol, irrigation, and power generation. To understand the im-pacts of the freshwater regulation of the TGD, an analytical model is adopted to explore how the operation of the TGD may affect the spatial–temporal patterns of tide–river dynam-ics in the Yangtze River estuary. We evaluated the effect of the TGD by comparing the changes in major tide–river dy-namics in the post-TGD period (2003–2014) with those in the pre-TGD period (1979–1984). The results indicate that the strongest impacts occurred during the autumn and winter, corresponding to a substantial reduction in freshwater dis-charge during the wet-to-dry transition period and slightly increased discharge during the dry season. The underlying mechanism leading to changes in the tide–river dynamics lies in the alteration of freshwater discharge, while the impact of geometric change is minimal. Overall, the results suggest that the spatial–temporal pattern of tide–river dynamics is sen-sitive to the freshwater regulation of the TGD, so that the ecosystem function of the estuary may undergo profound dis-turbances. The results obtained from this study can be used to set scientific guidelines for water resource management (e.g. navigation, flood control, salt intrusion) in dam-controlled estuarine systems.
1 Introduction
Estuaries are transition zones where the river meets the ocean (Savenije, 2012). Tide–river interactions, a result of both hy-drologic drivers and geomorphic constraints, are highly dy-namic in estuaries (Buschman et al., 2009; Sassi and Hoitink, 2013; Guo et al., 2015; Cai et al., 2016; Hoitink and Jay, 2016; Hoitink et al., 2017; Du et al., 2018). In natural con-ditions, they usually experience a wide range of temporal variations, on timescales ranging from a fortnight to season (e.g. Zhang et al., 2018). Human intervention, such as dam construction in the upstream parts of a river and the grow-ing number of water conservancy projects built along large rivers (such as freshwater withdrawal), has caused seasonal changes in downstream freshwater discharge delivery, lead-ing to adjustments in the function of fluvial and estuarine hydrology (e.g. Lu et al., 2011; Mei et al., 2015a; Dai et al., 2017). Consequently, it is important to understand the im-pacts of large-scale human intervention, such as flood con-trol, navigation, salt intrusion, and freshwater withdrawal, which are relevant not only to tide–river dynamics and ri-parian ecology but also to sustainable water resource man-agement in general.
Jan-uary, with a maximum discharge difference of approximately 38 000 m3s−1(Cai et al., 2016). Similar seasonal variations are also identified in other large rivers in eastern and south-ern Asia, such as the Mekong River in Vietnam, the Ganges River in India, and the Pearl River in China, under the influ-ence of a monsoon climate. However, most large rivers have been significantly dammed at the central and upper reaches in recent decades, dramatically modifying stream hydrology and sediment delivery, resulting in changes in hydraulics and river delta development trend at the lower reaches (e.g. Räsä-nen et al., 2017; Rahman et al., 2018; Liu et al., 2018). Due to the fact that the response of tide–river interactions to the impacts of dams is diverse and non-uniform and that many more dams are to be built in the future, the impacts of the hydrodynamic interactions between tidal waves and seasonal river flows from natural variations and anthropogenic activi-ties have become a common focus in international hydraulic research, especially in large tidal rivers.
The Yangtze River estuary, located near the coastal area of East China Sea, is one of the largest estuaries in Asia. In the mouth of the Yangtze River estuary, bifurcation occurs, and the characteristics of tides have been broadly investigated in previous studies (e.g. Zhang et al., 2012; Lu et al., 2015; Ale-bregtse and Swart, 2016). However, in these studies, river in-fluences are usually neglected. In recent years, the processes of nonlinear interactions between tidal wave and river flow in the Yangtze River estuary have received increasing attention (e.g. Guo et al., 2015; M. Zhang et al., 2015a, b, 2018; Cai et al., 2016; Kuang et al., 2017; F. Zhang et al., 2018). How-ever, recent studies on tidal properties, such as asymmetry, changes near the mouth area, and seasonal variations in tidal wave propagation and fluvial effects over the entire 600 km of the tidal river, up to the tidal limit of the Datong hydrolog-ical station, have been limited. In addition, the operation of the Three Gorges Dam (TGD), the largest dam in the world, has substantially affected the downstream river hydrology and sediment delivery. There is a variety of debate regarding the potential impacts of the TGD on the downstream river morphology, hydrology, and ecology, since the underlying mechanism of the impact of the TGD is not fully understood. Specifically, the TGD operation has altered the downstream fluvial discharge and water levels on the seasonal scale, di-rectly following the reservoir seasonal impounding and re-lease of water volume (e.g. Chen et al., 2016; Guo et al., 2018). However, the impacts of seasonal freshwater regula-tion by the TGD on the spatial–temporal tide–river dynamics in the downstream estuarine area have not been systemati-cally investigated. For example, during the dry season, TGD operation increased the multi-year monthly averaged river discharge at Datong station from 9520 to 12 896 m3×s−1 in January, while during wet season the regulation reduced the river discharge from 49 900 to 44 367 m3×s−1in July during the pre- and post-TGD periods.
In this study, for the first time, the spatial–temporal vari-ations in the hydrodynamic processes due to the
interac-tions of tidal flow and fluvial discharge in the Yangtze River estuary caused by natural forcing and human intervention were studied, with specific focus on the effect of TGD sea-sonal regulation. Here, we adopted a well-developed analyt-ical model proposed by Cai et al. (2014a, 2016) to investi-gate the spatial–temporal patterns of tide–river dynamics in the entire Yangtze River estuary and quantify the impacts of the TGD operation. In the following sections, we intro-duce the study site of the Yangtze River estuary. This is fol-lowed by a description of the available data and analytical model of tide–river dynamics in Sect. 3. Subsequently, we applied the model to the Yangtze River estuary, where the TGD has been operating since 2003 (Sect. 4). In particular, we explored the alteration of the tide–river dynamics after the TGD closure and summarised the impacts of the TGD on the spatial–temporal patterns of tide–river dynamics. The impacts of channel geometry and river discharge alterations on tide–river dynamics as well as the implications for sus-tainable water resource management were then discussed in Sect. 5. Finally, some key findings were addressed in Sect. 6.
2 Overview of the Yangtze River estuary
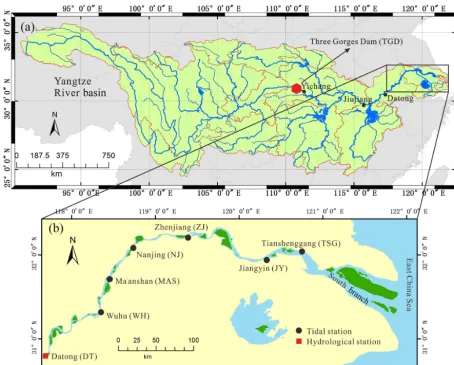
The Yangtze River, flowing from west to east in central China, is one of the world’s most important rivers due to its great economic and social relevance. It has a length of about 6300 km and a basin area of about 190 000 km2 (Fig. 1a). The Yangtze River basin is geographically divided into three parts, the upper, central, and lower sub-basins, and contains an estuary area with partitions at Yichang, Jiujiang, and Da-tong (DT), respectively (Fig. 1a). Of concern in this study are the impacts of the TGD, the world’s largest dam, on the spatial–temporal patterns of tide–river dynamics in the es-tuarine area. It is located about 45 km upstream of Yichang (Fig. 1a). The TGD project began in 2003; by 2009, when full operations began, the total water storage capacity rose up to∼40 km3, equivalent to 5 % of the Yangtze’s annual dis-charge. Downstream the DT station, where the tidal limit is located, the Yangtze River estuary extends∼630 km to the seaward end of the south branch. Wuhu (WH), Ma’anshan (MAS), Nanjing (NJ), Zhenjiang (ZJ), Jiangyin (JY), and Tianshenggang (TSG) are the major gauging stations along the main stream in the seaward direction (Fig. 1b). Under the control of the Asian monsoon climate, river discharges show distinct seasonal patterns. In 1979–2012, more than 70 % of freshwater was discharged at DT occurred during summer (May–October).
Figure 1.Maps of the Yangtze River basin(a)and Yangtze River estuary(b)with the location of tidal gauging and hydrological stations shown with black solid circles and red solid rectangles.
the averaged flood tide duration (5 h), indicating an irregu-lar semidiurnal character (Zhang et al., 2012).
3 Data and methodology 3.1 Source of data
To quantitatively investigate the relationship between fresh-water discharge regulation caused by the TGD operation and the tide–river dynamics, monthly averaged hydrological data for both pre-TGD (1979–1984) and post-TGD (2003– 2014) periods of tidal range and water level from the above-mentioned six tidal gauging stations along the Yangtze River estuary were collected. They were published by the Yangtze Hydrology Bureau of the People’s Republic of China. The monthly averaged tidal amplitude is determined by averag-ing the daily difference between high and low water levels and dividing by two. To correctly quantify the residual wa-ter level along the Yangtze estuary, locally measured wawa-ter
level at different gauging stations are corrected to the na-tional mean sea level of the Huanghai 1985 datum.
3.2 Analytical model for tide–river dynamics 3.2.1 Basic equations
In tidal rivers, the tidally averaged water level (i.e. resid-ual water level) depicts a steady gradient, which usresid-ually in-creases with freshwater discharge (e.g. Sassi and Hoitink, 2013). The key to deriving the dynamics of the residual water level lies in the one-dimensional momentum equation, which can be expressed as (e.g. Savenije, 2005, 2012)
∂U ∂t +U
∂U ∂x +g
∂Z ∂x +
gh 2ρ
∂ρ ∂x+g
U|U|
Manning–Strickler friction coefficient. It was demonstrated that in the subtidal momentum balance, the residual water level slope is primarily balanced by the residual friction term (Vignoli et al., 2003; Buschman et al., 2009; Cai et al., 2014a; for a detailed derivation, readers can refer to Appendix A):
∂Z ∂x = −
U|U|
K2h4/3, (2)
where the overbars indicate the tidal average. For a single channel with the residual water level set to 0 at the estuary mouth (i.e.Z=0 atx=0), the integration of Eq. (2) leads to an analytical expression for the residual water level:
Z(x)= − x Z
0 ∂Z ∂x = −
x Z
0 U|U|
K2h4/3. (3) To derive the analytical solutions for tide–river dynamics, we assume that the longitudinal variation of cross-sectional area Aand widthBcan be described by the following exponential functions (see also Toffolon et al., 2006; Cai et al., 2014a): A=Ar+ A0−Arexp
−x
a
, (4)
B=Br+ B0−Brexp
−x
b
, (5)
where A0 and B0 represent the tidally averaged cross-sectional area and width at the estuary mouth, respectively, Ar andBr represent the asymptotic riverine cross-sectional area and width, respectively, and a and b are the conver-gence lengths of the cross-sectional area and width, respec-tively. The advantage of these equations for approximating the shape of the estuary is that they account not only for the exponential shape in the lower part of the tidal river but also for the approximately prismatic channel in the upstream part of the tidal river. We further assume a nearly rectangu-lar cross section, considering a rectangu-large width-to-depth ratio; hence, the tidally averaged depth is given by h=A/B and the cross-sectional area variability can be primarily attributed to the change in depth.
3.2.2 Analytical solution for tidal hydrodynamics It was shown by Cai et al. (2014a, b, 2016) that the tide–river dynamics is dominantly controlled by four dimensionless pa-rameters (see their definitions in Table 1). They include the dimensionless tidal amplitudeζ (representing the boundary condition in the seaward side), the estuary shape numberγ (representing the cross-sectional area convergence), the fric-tion numberχ(representing the bottom frictional effect), and the dimensionless river dischargeϕ(representing the impact of freshwater discharge). The definitions of these four vari-ables are defined in Table 1, whereηis the tidal amplitude,υ is the velocity amplitude,Uris the river flow velocity,ωis the tidal frequency,rS=BS/Bis the storage width ratio between
the storage widthBSand the stream widthBthat accounts for the effect of storage area (i.e. tidal flats or salt marshes), and c0is the classical wave celerity defined asc0=
q
gh/rS. In this study, we used the analytical solutions proposed by Cai et al. (2014a, b, 2016), in which the solutions of the ma-jor tide–river dynamics are derived by solving a set of four implicit equations for the tidal damping, the velocity am-plitude, the wave celerity, and the phase lag (see details in Appendix B). The major dependent parameters can be de-scribed by the following four variables (see also Table 1):δ represents the damping/amplification number describing the increase (δ>0) or decrease (δ<0) of the tidal wave amplitude along the estuary axis,µrepresents the velocity number indi-cating the ratio of actual velocity amplitude to the frictionless value in a prismatic channel,λrepresents the celerity number representing the classical wave celerityc0scaled by the ac-tual wave celerityc, andεrepresents the phase lag between the high water (HW) and high water slack (HWS) or between the low water (LW) and low water slack (LWS). It is impor-tant to note that the phase lag (ranging between 0 andπ/2) is a key parameter in classifying the estuary, whereε=0 sug-gests the tidal wave is featured by a standing wave, while ε=π/2 indicates a progressive wave. For a simple harmonic wave, the phase lag is defined asε=π/2−(φZ−φU), where φZ andφU are the phases of elevation and current, respec-tively (Savenije, et al., 2008).
3.2.3 Analytical solution for the entire channel
Table 1.Definitions of dimensionless parameters used in the analytical model.
Local variables Dependent variables
Dimensionless tidal amplitude ζ=η/h
Amplification number δ=c0dη/ (ηωdx) Estuary shape number
γ =c0 A−Ar/ ωaA
Velocity number
µ=υ/ (rSζ c0)=υh/ (rSηc0) Friction number
χ =rSgc0ζ h
1−(4ζ /3)2i −1
/ωK2h4/3
Celerity number λ=c0/c Dimensionless river discharge
ϕ=Ur/υ
Phase lag
ε=π/2−(φZ−φU)
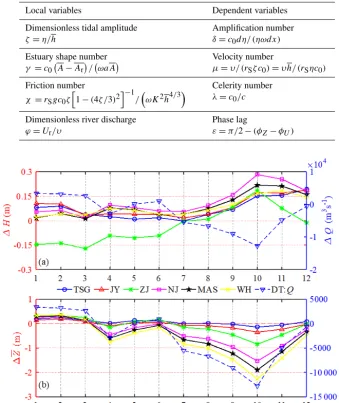
Figure 2.Changes in monthly averaged(a)tidal range1H and(b)residual water level1Ztogether with the freshwater discharge1Q along the Yangtze River estuary.
4 Results
4.1 Observational analysis on the alteration of tide–river dynamics after TGD closure
To quantify the impacts of TGD operation on the downstream tide–river dynamics, we divided the time series into two pe-riods, including a pre-TGD period (1979–1984, representing the condition before the operation of the TGD) and a post-TGD period (2003–2014, after the closure of the post-TGD with an operating TGD). Figure 2 shows the changes in the ob-served tidal range1H and residual water level1Z before and after the closure of the TGD at the six gauging sta-tions, together with the change in freshwater discharge1Q observed at the DT hydrological station. Figure 2 and
Ta-ble 2 clearly show that the monthly averaged river discharge in January, February, and March substantially increased by 35.5 %, 30.5 %, and 16.4 %, respectively, due to the consider-able release of freshwater from the TGD. On the other hand, we observe a significant decrease in freshwater discharge in September, October, and November, decreasing by 20.1 %, 33.2 %, and 20.8 %, respectively. The reason can be primarily attributed to the impounding water of the TGD during these months, especially in October. During the other months, the impacts of the TGD on the change in the freshwater dis-charge are relatively small, mimicking the natural condition before the operation of the TGD.
Ta-Figure 3.Changes in tidal damping rateδH before and after the TGD closure for different reaches along the Yangtze estuary:(a)TSG-JY,
(b)JY-ZJ,(c)ZJ-NJ,(d)NJ-MAS, and(e)MAS-WH.
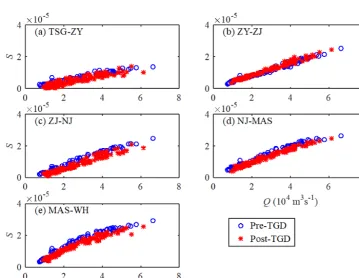
Figure 4.Changes in residual water level slopeSbefore and after the TGD closure for different reaches along the Yangtze estuary:(a)
ble S1 in the Supplement), except for the marked decrease at the ZJ station in the first half of the year (i.e. January–June). On average, the maximum increase (0.20 m) in tidal range occurs in October, which is mainly due to the substantial re-duction of river discharge caused by the TGD operation. This indicates a consistent enhancement of tidal dynamics along the Yangtze estuary, except the reach near the ZJ station. The exceptional case at the ZJ station is likely due to the fact that the ZJ station is located near the position of the tidal cur-rent limit during the dry season (Guo et al., 2015; Zhang et al., 2018). The shallow and narrow geometry around the ZJ station impedes the tidal wave propagation when river dis-charge increases due to the TGD operation during the dry season (Chen et al., 2012), leading to a remarkably decreas-ing tidal range in the first half of the year. For the residual water level, Fig. 2b clearly shows that the change in the resid-ual water level directly follows that of the river discharge due to the stable relationship between these two parameters (see also Table S2 in the Supplement). In particular, we see that the residual water levels increased by 0.26, 0.30, and 0.16 m, respectively, in January, February, and March, while they sig-nificantly decreased by 0.72, 1.17, and 0.70 m, respectively, in September, October, and November. In addition, the de-crease trend in residual water level is more significant at up-stream stations when compared with those in the downup-stream areas.
Since the TGD operation affects tide–river dynamics pri-marily through the alteration of the freshwater discharge, it is worth exploring the patterns of trends in the relationship between the freshwater discharge and gradients of the main tidal parameters with respect to distance (i.e. the tidal damp-ing rate and the residual water level slope). Here, we esti-mated the tidal damping rateδH and the residual water level slopeSfor a reach of1xby using the following expressions:
δH= 1 (H1+H2) /2
H2−H1
1x , (6)
S=Z2−Z1
1x , (7)
whereH1andZ1are the tidal amplitude and residual water level on the seaward side, respectively, whereas H2 andZ2 are the corresponding values1xupstream, respectively. Fig-ure 3 presents the computed tidal damping rates for different reaches along the Yangtze estuary based on the observed tidal ranges at the six gauging stations. It is remarkable that the tidal damping rates at the ZJ-NJ and MAS-WH reaches have significantly increased during the post-TGD period, which suggests an enhancement of tidal dynamics under the current freshwater discharge conditions. On the contrary, a notice-able decrease inδH was observed at the JY-ZJ reach, which corresponds to a decrease in tidal range at the ZJ station for the low river discharge conditions (from January to May; see Fig. 2a). At TSG-JY and NJ-MAS, no significant change in δH is observed. In Fig. 4, a consistent decrease in the
resid-ual water level slopeSis observed along the Yangtze estuary, except for the JY-ZJ reach. This means that the residual fric-tion effect becomes weaker in the post-TGD period since the residual water level slope is primarily balanced by the resid-ual friction term (Cai et al., 2014a, b, 2016).
4.2 Performance of the analytical model reproducing the tide–river dynamics
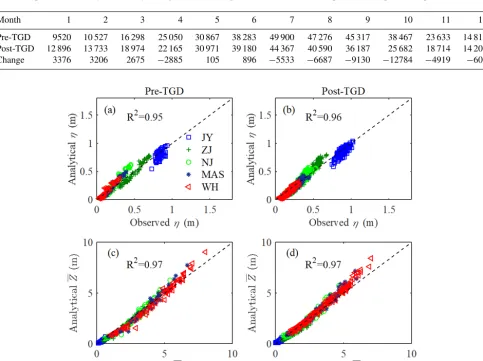
The analytical model presented in Sect. 3.2 was subse-quently applied to the Yangtze River estuary, with the sea-ward boundary using the tidal amplitude imposed at the TSG station and the landward boundary using the river dis-charge imposed at the DT station. The computation length of the estuary is 470 km, covering the entire estuary from TSG to DT. The adopted geometric characteristics (including the tidally averaged cross-sectional area, width, and depth) are the same for both pre- and post-TGD periods, which were extracted from a digital elevation model (DEM) using Yangtze River estuary navigation charts surveyed in 2007. The geometric characteristics, calibrated by fitting the ob-served values using Eqs. (4) and (5), are presented in Ta-ble 3, where a relatively large cross-sectional area conver-gence length (a=151 km) is evident, with a relatively small width (b=44 km), indicating a fast transition from a funnel-shaped reach to a prismatic reach in terms of width. It is worth noting that the Yangtze River estuary is charac-terised by a typical semidiurnal character; thus, a typical M2 tidal period (i.e. 12.42 h) was adopted in the analyti-cal model. For the sake of simplification, we assume that the storage width ratio rS=1. Hence, the only calibrated parameter is the Manning–Strickler friction coefficientK. Here, we used two values forK:K=80 m1/3×s−1in the tide-dominated region (x=0–32 km) and a smaller value of K=55 m1/3×s−1 in the river-dominated region (x=52– 450 km). In addition, to avoid a sharp jump in the analytically computed parameters due to the adoption of different friction coefficients, we adopted a friction coefficient of K=80– 55 m1/3s−1(indicating a linear reduction of the friction coef-ficient) over the transitional reach (x=32–52 km). The ana-lytically computed results were compared with the observed tidal amplitudes and the residual water levels at five gauging stations along the Yangtze estuary (Fig. 5). It can be seen that the overall correspondence between analytical results and ob-servations is good, with high coefficients of determination (R2>0.95), which suggests the usefulness of the present an-alytical model for reproducing the tide–river dynamics, given the gross features of flow characteristics and estuarine geom-etry.
4.3 Impacts of TGD operation on spatial–temporal patterns of tide–river dynamics
Table 2.Comparison of multi-year monthly averaged river dischargeQ(m3s−1) between the pre-TGD and post-TGD periods.
Month 1 2 3 4 5 6 7 8 9 10 11 12
Pre-TGD 9520 10 527 16 298 25 050 30 867 38 283 49 900 47 276 45 317 38 467 23 633 14 810 Post-TGD 12 896 13 733 18 974 22 165 30 971 39 180 44 367 40 590 36 187 25 682 18 714 14 203
Change 3376 3206 2675 −2885 105 896 −5533 −6687 −9130 −12784 −4919 −607
Figure 5.Comparison of monthly averaged values for(a, b)analytically computed tidal amplitudeηand(c, d)residual water levelZagainst the observations in the Yangtze River estuary for the pre-TGD period (1979–1984) and post-TGD period (2003–2014).
Table 3. Characteristics of geometric parameters in the Yangtze River estuary.
Characteristics River Mouth Convergence
lengtha/b (km)
Cross-sectional areaA(m2) 12 135 51 776 151
WidthB(m) 2005 6735 44
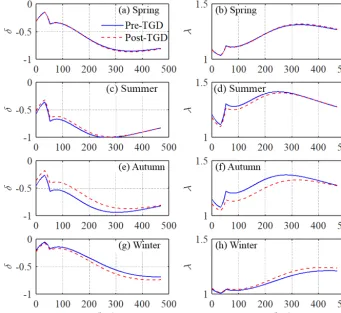
impacts on tide–river dynamics along the estuary has become increasingly important. In Figs. 6 and 7, we see how the TGD operation impacts the longitudinal variation of the main tidal dynamics in terms of the four dependent parameters (δ,λ,µ, andε) for different seasons. The most considerable changes in the major tide–river dynamics occurred in both autumn and winter seasons, which correspond to the substantial re-duction in freshwater discharge in the wet-to-dry transition
period (i.e. autumn) and slightly increased freshwater dis-charge in the dry season (i.e. winter) due to the TGD opera-tion since 2003 (see Table 2). On the other hand, the impacts of the TGD operation on the tide–river dynamics during the spring and summer are relatively minor due to the negligible change in the freshwater discharge. However, we do notice that the TGD had exerted slight influence on tide–river dy-namics in the downstream reaches (x <250 km) during the summer, with the maximum freshwater discharge occurring within a year. In addition, it appears that there exists a crit-ical position corresponding to the maximum tidal damping (or minimum value ofδ) upstream in which the tidal damp-ing becomes weak. This phenomenon occurs particularly in the spring, summer, and autumn. The underlying mechanism is elaborated in the discussion section.
Figure 6.Longitudinal variability of simulated tidal damping numberδ(a, c, e, g)and celerity numberλ(b, d, g, i)along the Yangtze estuary in different seasons (spring:a, b; summer:c, d; autumn:e, g; winter:g, i) for both the pre-TGD and post-TGD periods.
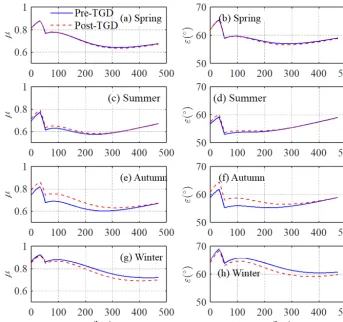
in autumn, while it was slightly enhanced in winter after the TGD closure. This was expected since freshwater dis-charges tend to dampen the tidal wave primarily through the enhancement of the friction term (Horrevoets et al., 2004; Cai et al., 2014a, b, 2016). Figure 6b, d, g, i show a sim-ilar picture for the wave celerity number λ, which is posi-tively correlated to the tidal damping number δ, according to the celerity Eq. (B1) in Appendix B. Figure 7 shows the longitudinal computation of the velocity number µand the phase lagεfor both periods. The impacts of the TGD oper-ation on the velocity scale and phase lag are similar to the tidal damping; i.e. the larger the freshwater discharge, the smaller the velocity number and the phase lag. In Figs. 6 and 7, there exist switches of the analytically computed parame-ters at both ends of the transitional reach (x=32–52 km) due to the change in friction coefficient adopted in the analytical model.
Overall, in the seaward reach of the estuary, the effect of freshwater discharge alteration by the TGD operation on the major tide–river dynamics (i.e.δ,λ,µ, andε) was less sig-nificant because of the small ratio of freshwater discharge to tidal discharge. On the other hand, in the upstream reach of the estuary, the changes in the four dependent parame-ters are also small due to the substantial tidal attenuation
as a result of the long-distance propagation from the estu-ary mouth. Therefore, the pattern of seasonal variation due to the TGD operation is relatively small at both ends of the estuary, whereas the largest variation usually occurs in the middle reach of the estuary. This finding was supported by the results of harmonic analysis using the numerical results (Zhang et al., 2018). Similar phenomena have also been iden-tified in other large fluvial meso-tide estuaries, such as the Mekong River estuary and Amazon River estuary, where dam operation altered the seasonal patterns of tide–river dynamics (Kosuth et al., 2009; Hecht et al., 2018).
5 Discussion
5.1 The impact of channel geometry alteration on tide–river dynamics
consid-Figure 7.Longitudinal variability of simulated velocity numberµ(a, c, e, g)and phase lagε(b, d, g, i)along the Yangtze estuary in different seasons (spring:a, b; summer:c, d; autumn:e, g; winter:g, i) for both the pre-TGD and post-TGD periods.
erably coarsening the bedload (Yang et al., 2014). In partic-ular, the river bed immediately downstream was eroded at a rate of 65 Mt yr−1in 2001–2002 (Yang et al., 2014). It was shown by Lyu et al. (2018) that due to a dramatic reduction in the sediment discharge following the construction of the TGD, a significant change in size, geometry, and spatial dis-tribution of pool riffles occurred downstream; however, this adjustment was limited to the reaches close to the TGD. It should be noted that the bathymetry adopted in the analytical model is restricted to the estuarine area in 2007, which is only 4 years after the TGD closure in 2003, and it is before the full operation of the TGD began in 2009. In addition, the TGD is around 1600 km away from the estuary mouth, and its influ-ence on the estuarine morphology normally has a lag effect of at least 4–5 years, as discussed by Wang et al. (2008). Hence, the adopted geometry has been only partly altered after the TGD closure. The morphological change of Yangtze estuary can be even more profound in recent years due to the con-tinuous and accumulated impact from the TGD. Further ad-justment of morphological change due to the sedimentation in the TGD could exert a considerable impact on the tide– river dynamics in the estuarine region (e.g. Du et al., 2018; Shaikh et al., 2018). Further study of the impact of
morpho-logical adjustment on the tide–river dynamics is required in the future.
5.2 The impact of freshwater discharge alteration on tide–river dynamics
Figure 8. Longitudinal variability of simulated estuary shape numberγ (a, c, e, g)and friction numberχ (b, d, g, i)along the Yangtze estuary in different seasons (spring:a, b; summer:c, d; autumn:e, g; winter:g, i) for both the pre-TGD and post-TGD periods.
estuarine area, with the maximum variation occurring in au-tumn and the minimum variation occurring in spring.
Figures 8 and 9 show that during the wet season (summer– autumn), the estuary shape numberγ and friction numberχ experience a general increase, while a decrease in the resid-ual water level slope S and water depth h can be identi-fied in the post-TGD period due to the reduction in fresh-water discharge. However, the changes in these major dy-namics vary significantly along the channel. Near the estu-ary mouth, where tidal influence overwhelms the influence from freshwater discharge, the difference is relatively small, as the magnitude of the freshwater discharge is small when compared with that of the tidal discharge. Meanwhile, at the upstream reach of the estuary, where the riverine influence dominates that of the tide, the difference is also small due to the attenuation of the tidal wave propagation over a long distance. Consequently, the most significant changes in ma-jor tide–river dynamics occurred in the middle reach of the Yangtze River estuary due to the discharge regulation of the TGD during the wet season. By contrast, during the dry sea-son (winter–spring), especially in winter, the opposite trend was observed, indicating a slight increase inγ andχ, and a slight decrease inSandhdue to the additional release of
dis-charge from the TGD. In addition, we also observed that the changes in tide–river dynamics caused by the TGD operation were much stronger upstream than in the lower stream. 5.3 Implications for water resource management The construction of the TGD is the largest hydro-development project ever performed in the world, having multiple influences on downstream water resource manage-ment, including navigation, flood control, tidal limit varia-tion, and salt intrusion.
5.3.1 Implications for navigation
Figure 9.Longitudinal variability of simulated residual water level slopeS(a, c, e, g)and water depthh(b, d, g, i)along the Yangtze estuary in different seasons (spring:a, b; summer:c, d; autumn:e, g; winter:g, i) for both the pre-TGD and post-TGD periods.
the flood season, the reduction in the freshwater discharge by TGD impounding tends to exert a negative impact on nav-igation. However, the reduced freshwater discharges in the late summer and autumn are not of sufficient magnitude to cause any navigation problems. This is due to the fact that the mean water levels during the flood season are relatively high; hence, the regulating flow quantity and regulating ca-pacity are relatively small (e.g. Chen et al., 2016). In general, due to the staggered regulation in freshwater discharge, sea-sonally, the actual navigation condition is improved due to the significant increase in the percentage of low water levels. 5.3.2 Implications for flood control
Flood control is one of the most important functions of build-ing dams and reservoirs in large rivers. Before the construc-tion of the TGD, the Yangtze River basin suffered from fre-quent and disastrous flood threats. For instance, the floods of 1998 in the Yangtze River were reported to have killed 3656 people, destroyed 5.7 million homes, and damaged 7 million more. Many studies have examined the flood control capac-ity of the TGD over the past two decades (Zhao et al., 2013; Chen et al., 2014). In particular, the capability of the TGD
flood control is influenced by multiple factors (e.g. Huang et al., 2018), particularly in the estuarine area, which is strongly influenced by tides from the ocean. During the flood season, the reduced freshwater discharge by TGD impounding ben-efits the flood control by reducing the peak flood discharge. However, as the tidal influence is enhanced, both the percent-ages of high water and low water levels for the post-TGD period are considerably increased, as shown in Fig. 10, indi-cating a decreased flood control capability. For instance, at the WH gauging station located in the upstream part of the Yangtze River estuary, the 8 m high water level increased by approximately 10 % after the TGD closure during the wet season. The corresponding flood prevention standard, there-fore, is reduced due to the increased high water level (see also Nakayama and Shankman, 2013).
5.3.3 Implications for tidal limit
It is important to detect the position of the tidal limit (corre-sponding with the position where the tidal amplitude to depth ratio is less than a certain threshold, e.g.η
Figure 10.Cumulative distribution function (cdf) estimated by us-ing the kernel smoothus-ing function (a)for high water level and
(b)low water level at six gauging stations along the Yangtze estu-ary. The solid lines represent the pre-TGD period, while the dashed lines represent the post-TGD period.
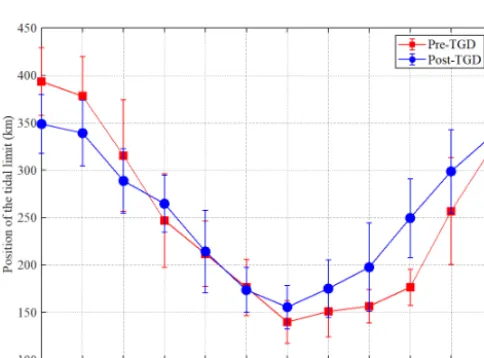
Figure 11.Temporal variation of the position of the tidal limit rela-tive to the TSG station for both the pre-TGD and post-TGD periods. The vertical error bar at each data point indicates the standard devi-ation of the analytically computed time series.
and fisheries management, in general (e.g. Shi et al., 2018). Subsequently, we are able to define the tide-influenced length as the distance upstream from the estuary mouth to the tidal limit. Generally, the tidal limit fluctuates with the changes in the seasonal freshwater discharges. Field measurements have demonstrated that tidal limit can reach as far as the NJ sta-tion and further upstream during the dry season, while dur-ing the wet season, it is pushed down to the ZJ station and may be pushed further downward to the JY station under spate conditions. Figure 11 shows the analytically computed
tidal limit position for both the pre- and post-TGD periods. It can be observed that the tidal limit moved downstream by about 45 and 39 km in January and February under the im-pact of the additional release of discharge from TGD during the dry season. During the transition from dry to wet seasons (January–May), the total freshwater discharge from TGD in-creases, and we identify further downstream movement of the tidal limit, although to a smaller extent. The reverse of the post-TGD tidal limit in April is due to the decrease in the freshwater discharge compared with the pre-TGD tidal limit (see Table 2). The TGD storage period begins in June, and the tidal limit moved upstream by a large amount com-pared with the pre-TGD period. The largest change occurred during October when the tidal limit moved from 175 km pre-TGD to 250 km post-pre-TGD due to the substantial increase in freshwater discharge (see Table 2).
5.3.4 Implications for salt intrusion
The operation of the TGD changed the location of tidal limit, which, in turn, directly influences the intensity of saltwater intrusion, especially during the dry season, when the fresh-water discharge is low and saltfresh-water intrusion is important (e.g. Cai et al., 2015). The analysis of tide–river dynamics shows that the tidal dynamics are considerably enhanced dur-ing the autumn due to the substantial decline in freshwater discharged into the estuary, which may lead to enhanced salt-water intrusion. However, with supplemented discharge after the TGD during the winter, saltwater intrusion tends to be significantly suppressed, and the isohalines are pushed sea-ward by additional river discharges (e.g. An et al., 2009; Qiu and Zhu, 2013). In contrast, during the wet season, the TGD operation slightly extended the timing of saltwater intrusion and increased its intensity by impounding freshwater. Since the total river discharge rate during the wet season is the largest during the year, the influence of saltwater on fresh-water reservoirs along the coastal area is limited. Therefore, the operation of the TGD is overall favourable for reducing the burden of freshwater supplement in the tidally influenced estuarine areas. However, to quantify the potential impacts of the TGD’s operation on salt intrusion and related aquatic ecosystem health in general, it is required to couple the hy-drodynamic model to the ecological or salt intrusion model (e.g. Qiu and Zhu, 2013; Cai et al., 2015).
6 Conclusions
decrease in freshwater discharge during the wet-to-dry tran-sition period and a slight increase in discharge during the dry season. The analytical results indicate that the discharge regulation by the TGD drives the alterations in the tide– river dynamics instead of the geometric change. In particular, the change in the freshwater discharge changes the estuary shape number (representing the geometric effect), the resid-ual water level slope (representing the effective frictional ef-fect), and hence the tide–river dynamics. This study, using the Yangtze River estuary as an example, provides an effec-tive yet simple method to quantify the seasonal regulation in freshwater discharge by large reservoirs or dams on hydro-dynamics in estuaries. The results obtained from this study will, hopefully, shed new light on aspects of water resource management, such as navigation, flood control, and salt in-trusion.
Appendix A: Simplified momentum balance for the residual water level slope
Assuming a periodic variation of flow velocity, the integra-tion of Eq. (1) over a tidal cycle leads to an expression for the residual water level slope (e.g. Cai et al., 2014a, 2016):
∂Z ∂x = −
1 K2
U|U|
h4/3
− 1 2g ∂U2 ∂x − 1 2ρ0h ∂ρ
∂x, (A1) where the overbars and the subscript 0 indicate the tidal av-erage and value at the seaward boundary, respectively. The residual water level slope is induced by three contributions: residual frictional, advective acceleration, and density ef-fects, which correspond to the three terms on the right-hand side of Eq. (A1). Note that the contribution from advective acceleration to the residual water level slope,
∂Zadv ∂x = −
1 2g
∂U2
∂x , (A2)
can be easily integrated to
Zadv= − 1
2g
U2−U2 0
= −1
2F r0 U2 U02
−1
!
h0, (A3)
where the Froude number is introduced, F r2=U2/(gh), which is computed with the averaged variables. In this case, the correction is local (not cumulative) and proportional to the flow depth through a coefficient that is negligible as long as the velocity does not change significantly, andFris small, as is common in most tidal flows. It was shown by Savenije (2005, 2012) that the density term in Eq. (1) always exer-cises a pressure in the landward direction, which is counter-acted by a residual water level slope, amounting to 1.25 % of the estuary depth over the salt intrusion length. The value for the residual water level slope, induced by the density effect, is usually small compared with the gradient of the free sur-face elevation; thus, in this paper, we neglect the influence of the density difference on the dynamics of the residual water level.
Appendix B: Governing equations for tide–river dynamics in estuaries
The analytical solutions for the dependent parametersµ,δ, λ, andεare obtained by solving the following four dimen-sionless equations (see details in Cai et al., 2014a):
– the tidal damping/amplification equation, describing the tidal amplification or damping as a result of the balance between channel convergence(γ θ )and bottom friction (χ µλ0):
δ=µ
2(γ θ−χ µλ0)
1+µ2β ; (B1)
– the scaling equation, describing how the ratio of veloc-ity amplitude to tidal amplitude depends on phase lag and wave celerity:
µ=sin(ε)
λ = cos(ε)
γ−δ ; (B2)
– the celerity equation, describing how the wave celerity depends on the balance between convergence and tidal damping/amplification:
λ2=1−δ (γ−δ); (B3) – and the phase lag equation, describing how the phase lag between HW and HWS depends on wave celerity, convergence, and damping:
tan(ε)= λ
γ−δ, (B4)
whereθ,β, and0 account for the effect of river dis-charge and where
β=θ−rSζ ϕ/ (µλ) , θ=1−p1+ζ−1ϕ/ (µλ) , 0= 1
π
h
p1−2p2ϕ+p3ϕ2
3+µ2λ2/ϕ2i. (B5) Note that0is a friction factor obtained by using Chebyshev polynomials (Dronkers, 1964) to represent the non-linear friction term in the momentum equation:
F = U|U|
K2h4/3
≈ 1
K2h4/3π
p0υ2+p1υU+p2U2+p3U3/υ
, (B6) in whichU is the cross-sectional averaged velocity consist-ing of a steady componentUr, generated by the freshwater discharge, and a time-dependent componentUt, introduced by the tide:
U=Ut−Ur=υsin(ωt )−Q/A, (B7) whereQis the freshwater discharge (treated as a constant during the tidal wave propagation), and pi (i=0, 1, 2, 3) are the Chebyshev coefficients (see Dronkers, 1964, p. 301), which are functions of the dimensionless river dischargeϕ throughα=arcos(-ϕ):
p0= − 7
120sin(2α)+ 1
24sin(6α)− 1
60sin(8α) , (B8) p1=
7 6sin(α)−
7
30sin(3α)− 7
30sin(5α)+ 1
10sin(7α) , (B9) p2=π−2α+1
3sin(2α)+ 19
30sin(4α)− 1
5sin(6α) , (B10) p3=4
3sin(α)− 2
3sin(3α)+ 2
Supplement. The supplement related to this article is available online at: https://doi.org/10.5194/os-15-583-2019-supplement.
Author contributions. All authors contributed to the design and de-velopment of the work. The experiments were originally carried out by HC. XZ and LG carried out the data analysis. MZ built the model and wrote the paper. FL and QY reviewed the paper.
Competing interests. The authors declare that they have no conflict of interest.
Acknowledgements. All the authors thank Dr. Du Jiabi and Dr. Matt Lewis for their constructive comments and suggestions, which have greatly improved the quality of this paper.
Financial support. This research has been supported by the Na-tional Key R&D of China (grant no. 2016YFC0402600), the Open Research Fund of State Key Laboratory of Estuarine and Coastal Research (grant no. SKLEC-KF201809), the National Natural Sci-ence Foundation of China (grant no. 51709287), the National Nat-ural Science Foundation of China (grant no. 41701001), the China Postdoctoral Science Foundation (grant no. 2018M630414) and the Guangdong Provincial Natural Science Foundation of China (grant no. 2017A030310321).
Review statement. This paper was edited by Neil Wells and re-viewed by Jiabi Du and Matt Lewis.
References
Alebregtse, N. C. and de Swart, H. E.: Effect of river discharge and geometry on tides and net water trans-port in an estuarine network, an idealized model applied to the Yangtze estuary, Cont. Shelf. Res., 123, 29–49, https://doi.org/10.1016/j.csr.2016.03.028, 2016.
An, Q., Wu., Y., and Taylor, S.: Influence of the Three Gorges Project on saltwater intrusion in the Yangtze River Estuary, Env-iron. Geol., 56, 1679–1686, https://doi.org/10.1007/s00254-008-1266-4, 2009.
Buschman, F. A., Hoitink, A. J. F., van der Vegt, M., and Hoekstra, P.: Subtidal water level variation controlled by river flow and tides, Water Resour. Res., 45, W10420, https://doi.org/10.1029/2009WR008167, 2009.
Cai, H., Savenije, H. H. G., and Toffolon, M.: Linking the river to the estuary, influence of river discharge on tidal damping, Hy-drol. Earth Syst. Sci., 18, 287–304, https://doi.org/10.5194/hess-18-287-2014, 2014a.
Cai, H., Savenije, H. H. G., and Jiang, C.: Analytical approach for predicting fresh water discharge in an estuary based on tidal wa-ter level observations, Hydrol. Earth Syst. Sci., 18, 4153–4168, https://doi.org/10.5194/hess-18-4153-2014, 2014b.
Cai, H., Savenije, H. H. G., Zuo, S., Jiang, C., and Chua, V.: A predictive model for salt intrusion in estuaries ap-plied to the Yangtze estuary, J. Hydrol., 529, 1336–1349, https://doi.org/10.1016/j.jhydrol.2015.08.050, 2015.
Cai, H., Savenije, H. H. G., Jiang, C., Zhao, L., and Yang, Q.: Analytical approach for determining the mean water level pro-file in an estuary with substantial fresh water discharge, Hy-drol. Earth Syst. Sci., 20, 1–19, https://doi.org/10.5194/hess-20-1-2016, 2016.
Chen, J., Wang, Z., Li, M., Wei, T., and Chen, Z.: Bed-form characteristics during falling flood stage and mor-phodynamic interpretation of the middle–lower Changjiang (Yangtze) River channel, China, Geomorphology, 147, 18–26, https://doi.org/10.1016/j.geomorph.2011.06.042, 2012. Chen, J., Zhong, P. A., and Zhao, Y. F.: Research on
a layered coupling optimal operation model of the Three Gorges and Gezhouba cascade hydropower stations, Energ. Convers. Manage., 86, 756–763, https://doi.org/10.1016/j.enconman.2014.06.043, 2014. Chen, J., Finlayson, B.L., Wei, T., Sun, Q., Webber, M., Li, M., and
Chen, Z.: Changes in monthly flows in the Yangtze River, China-With special reference to the Three Gorges Dam, J. Hydrol., 536, 293–301, https://doi.org/10.1016/j.jhydrol.2016.03.008, 2016. Dai, M., Wang, J., Zhang, M., and Chen, X.: Impact of the Three
Gorges Project operation on the water exchange between Dongt-ing Lake and the Yangtze River, Int. J. Sediment Res., 32, 506– 514, https://doi.org/10.1016/j.ijsrc.2017.02.006, 2017.
Dronkers, J. J.: Tidal Computations in River and Coastal Waters, Elsevier, New York, USA, Science, PP1-518, https://doi.org/10.1126/science.146.3642.390, 1964.
Du, J., Shen, J., Zhang, Y. J., Ye, F., Liu, Z., Wang, Z., Wang, Y. P., Yu, X., Sisson, M., and Wang, H. V.: Tidal Response to Sea-Level Rise in Different Types of Estuaries: The Importance of Length, Bathymetry, and Geometry, Geophys. Res. Lett., 45, 227–235, https://doi.org/10.1002/2017GL075963, 2018.
Guo, L., van der Wegen, M., Jay, D. A., Matte, P., Wang, Z. B., Roelvink, D. J. A., and He, Q.: River-tide dynamics, Ex-ploration of nonstationary and nonlinear tidal behavior in the Yangtze River estuary, J. Geophys. Res., 120, 3499–3521, https://doi.org/10.1002/2014JC010491, 2015.
Guo, L., Su, N., Zhu, C., and He, Q.: How have the river discharges and sediment loads changed in the Changjiang River basin down-stream of the Three Gorges Dam?, J. Hydrol., 560, 259–274, https://doi.org/10.1016/j.jhydrol.2018.03.035, 2018.
Hoitink, A. J. F. and Jay, D. A.: Tidal river dynamics: implications for deltas, Rev. Geophys., 54, 240–272, https://doi.org/10.1002/2015RG000507, 2016.
Hoitink, A. J. F., Wang, Z. B., Vermeulen, B., Huismans, Y., and Kastner, K.: Tidal controls on river delta morphology, Nat. Geosci., 10, 637–645, https://doi.org/10.1038/ngeo3000, 2017. Horrevoets, A. C., Savenije, H. H. G., Schuurman, J. N.,
and Graas, S.: The influence of river discharge on tidal damping in alluvial estuaries, J. Hydrol., 294, 213–228, https://doi.org/10.1016/j.jhydrol.2004.02.012, 2004.
Huang, K., Ye, L., Chen, L., Wang, Q., Dai, L., Zhou, J., Singh, V. P., Huang, M., and Zhang, J.: Risk analysis of flood control reser-voir operation considering multiple uncertainties, J. Hydrol., 565, 672–684, https://doi.org/10.1016/j.jhydrol.2018.08.040, 2018.
Kosuth, P., Callède, J., Laraque, A., Filizola, N., Guyot, J. L., Seyler, P., Fritsch, J. M., and Guimarães, V.: Sea-tide effects on flows in the lower reaches of the Amazon River, Hydrol. Process., 23, 3141–3150, https://doi.org/10.1002/hyp.7387, 2009.
Kuang, C., Chen, W., Gu, J., Su, T. C., Song, H., Ma, Y., and Dong, Z.: River discharge contribution to sea-level rise in the Yangtze River Estuary, China, Cont. Shelf. Res., 134, 63–75, https://doi.org/10.1016/j.csr.2017.01.004, 2017.
Liu, F., Hu, S., Guo, X., Cai, H., and Yang, Q.: Recent changes in the sediment regime of the Pearl River (South China), Causes and implications for the Pearl River Delta, Hydrol. Process., 32, 1771–1785, https://doi.org/10.1002/hyp.11513, 2018.
Lu, S., Tong, C., Lee, D. Y., Zheng, J., Shen, J., Zhang, W., and Yan, Y.: Propagation of tidal waves up in Yangtze Estu-ary during the dry season, J. Geophys. Res., 120, 6445–6473, https://doi.org/10.1002/2014JC010414, 2015.
Lu, X. X., Yang, X., and Li, S.: Dam not sole cause of Chinese drought, Nature, 475, 174–175, https://doi.org/10.1038/475174c, 2011.
Lyu, Y., Zheng, S., Tan, G., and Shu, C.: Effects of Three Gorges Dam operation on spatial distribution and evolution of channel thalweg in the Yichang-Chenglingji Reach of the Middle Yangtze River, China, J. Hydrol., 565, 429–442, https://doi.org/10.1016/j.jhydrol.2018.08.042, 2018.
Mei, X., Dai, Z., Gelder, P. H. A. J., and Gao, J.: Link-ing Three Gorges Dam and downstream hydrological regimes along the Yangtze River, China, Earth Space Sci., 2, 94–106, https://doi.org/10.1002/2014EA000052, 2015a.
Mei, X., Dai, Z., Du, J., and Chen, J.: Linkage between Three Gorges Dam impacts and the dramatic recessions in China’s largest freshwater lake, Poyang Lake, Sci. Rep., 5, 18197, https://doi.org/10.1038/srep18127, 2015b.
Nakayama, T. and Shankman, D.: Impact of the Three-Gorges Dam and water transfer project on Changjiang floods, Glob. Planet Change, 100, 38–50, https://doi.org/10.1016/j.gloplacha.2012.10.004, 2013.
Qiu, C. and Zhu., J.: Influence of seasonal runoff regulation by the Three Gorges Reservoir on saltwater intrusion in the Changjiang River Estuary, Cont. Shelf Res., 71, 16–26, https://doi.org/10.1016/j.csr.2013.09.024, 2013.
Rahman, M., Dustegir, M., Karim, R., Haque, A., Nicholls, R. J., Darby, S. E., Nakagawa, H., Hossain, M., Dunn, F. E., and Akter, M.: Recent sediment flux to the Ganges-Brahmaputra-Meghna delta system, Sci. Total Environ., 643, 1054–1064, https://doi.org/10.1016/j.scitotenv.2018.06.147, 2018.
Räsänen, T. A., Someth, P., Lauri, H., Koponen, J., Sarkkula, J., and Kummu, M.: Observed river discharge changes due to hy-dropower operations in the Upper Mekong Basin, J. Hydrol., 545, 28–41, https://doi.org/10.1016/j.jhydrol.2016.12.023, 2017. Sassi, M. G. and Hoitink, A. J. F.: River flow controls on tides and
tide-mean water level profiles in a tidal freshwater river, J. Geo-phys. Res., 118, 4139–4151, https://doi.org/10.1002/jgrc.20297, 2013.
Savenije, H. H. G.: Salinity and Tides in Alluvial Estuaries, Else-vier, New York, USA, 2005.
Savenije, H. H. G.: Salinity and Tides in Alluvial Estuar-ies (2nd completely revised Edn.), available at: https://www. salinityandtides.com (last access: 10 December 2018), 2012. Savenije, H. H. G., Toffolon, M., Haas, J., and Veling,
E. J. M.: Analytical description of tidal dynamics in convergent estuaries, J. Geophys. Res., 113, C10025, https://doi.org/10.1029/2007JC004408, 2008.
Shaikh, B. Y., Bansal, R. K., and Das, S. K.: Propagation of Tidal Wave in Coastal Terrains with Complex Bed Geometry, Environ. Process., 5, 519–537, https://doi.org/10.1007/s40710-018-0314-7, 2018.
Shi, S., Cheng, H., Xuan, X., Hu, F., Yuan, X., Jiang, Y., and Zhou, Q.: Fluctuations in the tidal limit of the Yangtze River estu-ary in the last decade, Sci. China Earth Sci., 61, 1136–1147, https://doi.org/10.1007/s11430-017-9200-4, 2018.
Toffolon, M., Vignoli, G., and Tubino, M.: Relevant parameters and finite amplitude effects in estuarine hydrodynamics, J. Geophys. Res., 111, C10014, https://doi.org/10.1029/2005JC003104, 2006.
Vignoli, G., Toffolon, M., and Tubino, M.: Non-linear frictional residual effects on tide propagation, in: Proceedings of IAHR Congress, Vol. A, 24–29 August 2003, Thessaloniki, Greece, 291–298, 2003.
Wang, Y., Ridd, P. V., Wu, H., Wu, J., and Shen, H.: Long-term morphodynamic evolution and the equilibrium mechanism of a flood channel in the Yangtze Estuary (China), Geomorphology, 99, 130–138, https://doi.org/10.1016/j.geomorph.2007.10.003, 2008.
Zhang, E. F., Savenije, H. H. G., Chen, S. L., and Mao, X. H.: An analytical solution for tidal propagation in the Yangtze Estuary, China, Hydrol. Earth Syst. Sci., 16, 3327–3339, https://doi.org/10.5194/hess-16-3327-2012, 2012.
Zhang, F., Sun, J., Lin, B., and Huang, G.: Seasonal hy-drodynamic interactions between tidal waves and river flows in the Yangtze Estuary, J. Mar. Syst., 186, 17–28, https://doi.org/10.1016/j.jmarsys.2018.05.005, 2018.
Zhang, M., Townend, I., Cai, H., and Zhou, Y.: Seasonal varia-tion of tidal prism and energy in the Changjiang River estu-ary: A numerical study, Chin. J. Oceanol. Limn., 34, 219–230, https://doi.org/10.1007/s00343-015-4302-8, 2015a.
Zhang, M., Townend, I., Cai, H., and Zhou, Y.: Seasonal varia-tion of river and tide energy in the Yangtze estuary, China, Earth Surf. Proc. Land., 41, 98–116, https://doi.org/10.1002/esp.3790, 2015b.