Abstract—In order to study the mechanism of oil and gas
coordinated development in oil rim reservoirs, three-dimensional visualized gas-cap reservoir physical simulation device was established to simulate the processes of oil and gas development at different gas production rates. According to experimental result, it is shown that migration speed of oil-gas interface was reduced with increasing gas production rates while migration speeds of internal and external oil-gas interfaces gradually became close, which effectively slows down occurrence of gas channeling, reduces production gas oil ratio and increases the swept volume of gas drive, so as to improve its development effect. Moreover, optimization of coordinated development methods of gas-cap and oil ring under three different conditions was studied as well,. According to optimization result, it is shown that optimal gas production rate for coordinated development of oil and gas was different under different conditions and policies. If well shut-in problem( due to gas channeling) is not considered, optimal gas production rate is small, since development years of reservoir will become longer and its development effects will become better. If well shut-in problem is considered, accumulative oil and gas equivalent will be maximized when gas production rate is between 2% and 4%.
Index Terms—Oil rim reservoir, coordinated development,
indoor experiment, migration law of oil-gas interface, gas production rates.
I. INTRODUCTION
Natural gas, as a kind of clean energy, will not only reduce the use of coal and oil consumption and improve environmental pollution greatly, but also reduce nearly 100% emission of sulfur dioxide and dust, 60% emission of carbon dioxide and 50% emission of oxynitride, so as to relieve global greenhouse effects and fundamentally improve environmental quality. In recent years, it catches great attention of many countries, resulting in increasing demand for natural gas in international market. As a result, a lot of gas-cap reservoirs need to be invested for development with the increasing demand on sales market. However, gas cap and oil ring in a same reservoir stay in a uniform hydrodynamic system, so they are in balance state of pressure before development. Once it is developed, pressure changes of any part will influence the other. MacDonald [1] and
Manuscript received May 15, 2013; revised September 16, 2013. This work was financially supported by the National Natural Science Foundation of China and the technology Project is “The Coupling Percolation Mechanism and Model for Fractured Low Permeability and Ultra-low Permeability Reservoir” (51174215/E0403).
The authors are with the Oil & Gas Development major in College of Petroleum Engineering at China University of Petroleum (Beijing). (e-mail: [email protected], [email protected], [email protected], [email protected])
Addington [2] discussed gas coning and dipping in vertical wells with mathematical simulation, getting determination of the right position and length of perforation and the maximum critical oil rate which could provide the most profitable and permissible gas-free oil production. Onwukwe [3] and Kartoatmodjo [4] proposed a model for determining the optimum horizontal well placement in a thin oil rim reservoir in order to control coning tendencies effectively and optimize oil production. Delauretis [5] caculated the migration law of oil-gas interface in different development patterns using material balance method. Ezzam [6] pointed that both gas production and oil production would lead to changes of oil-gas interface and mutual displacement between oil ring and gas-cap. According to Nandalal [7] and Bayley [8], gas channeling into oil ring has little influence on ultimate recovery of natural gas, but oil reduction is inevitable and under some serious circumstance, only gas is produced without any oil in oil production wells. If crude oil enters gas cap, large amount of oil will be wasted and oil recovery will be influenced. Vo [9], [10] and Kabir [11] pointed out that the key concern is therefore obtaining economic and optimal operations despite the gas and water coning effects that could confine production below commercial rates and hinder recovery. Therefore, coordinated development of gas cap and oil ring has been an ideal way to recover resources in gas-cap reservoirs, Kuppe [12] have confirmed it by considering concurrent gas and oil production from the Virginia Hills Belloy field. Mohamed and Fayzullin [13] introduced intelligent well completion would significantly improve the overall cumulative production of gas and oil from a thin oil reservoir with a large gas cap. Travis [14] introduced experience of developing gas cap reservoir by injecting water at the gas-oil contact while simultaneously producing the gas cap and oil column. However, at present, few studies are focused on the migration law of oil-gas interface in gas cap reservoir with coordinated development. Taking the Zanarol Oilfield in Kazakhstan as an example, this paper established three-dimensional visualized physical model to analyze the migration law of oil-gas interface of gas-cap reservoir through indoor experiment.
II. EXPERIMENTAL STUDY ON THE MIGRATION OF OIL AND
GAS INTERFACE
A. Experimental Condition
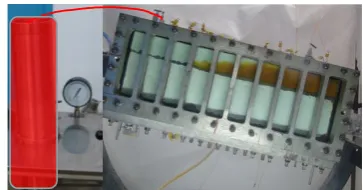
Three-dimensional visualized device was used for physical simulation experiment and sizes of experimental device were 1000mm×300mm×300mm. Thickness and dip angle of model can be regulated to meet geometric similarity condition of experiment. Experimental device can be connected with intermediate container filled with proper gas
Liu Jia, Cheng Lin-Song, Huang Shi-Jun and Zhang Jian
to simulate gas-cap reservoir of different gas-cap indexes, as
is shown in Fig. 1.
Fig. 1. Three-dimensional visualized physical simulation device
Based on oil production rate of 0.7%, gas production rates of 0.5%, 2%, 4% and 8% were adopted for coordinated development experiments of gas cap and oil ring. In the experiments, dynamic data of oil and gas wells were measured. At the same time, real time monitoring was carried out on migration law of oil-gas interface.
B. Migration Speed of Oil-Gas Interface
Through visualized window of physical model, migration of oil-gas interface at different production moments can be observed to calculate its migration speed. Taking gas production rates of 0% and 2% for example, influence of gas production rate on migration speed of oil-gas interface was analyzed. The location of oil-gas interface at the same production time (200min) is shown in Fig. 2. In the figure, black line refers to initial location of oil-gas interface and yellow line refers to its location after development.
Gas Production Well
Oil Production Well
Gas Cap Residue oil Oil Rim
Gas Producing rate: 2%
气顶 Gas Cap Residue oil Oil Rim Gas Production Well
Oil Production Well
Gas Producing rate: 0%
Fig. 2. Migration law of oil-gas interface at different gas producing rates
Visualized results show that at the same production moment, migration distance of oil-gas interface was larger and migration speed was fast when gas cap is not developed, which could cause gas channeling seriously and decline of oil output.
When oil production rate was 0.7% and gas production rate was 0%, 0.5% and 2% respectively, migration speed of oil-gas interface was measured as shown in Fig. 3. If gas production rate is 0%, migration speed of oil-gas interface will be the largest and it will be reduced with the increasing gas production rate, or migration speed of oil-gas interface can be reduced if coordinated development of gas-cap oil
ring is carried out, but it helps keep the balance of oil-gas interface.
0 1 2 3 4 5 6 7 8 9
0 0.5 2
m
ig
rat
io
n
,
m
/y
Gas producing rate,%
Fig. 3. Migration speed of oil-gas interface at different gas production rates
C. Migration form of Oil-Gas Interface
In order to study migration of oil-gas interface through visualized window and describe migration form clearly, interface at the nearby side of oil ring is defined as external oil-gas interface and the interface next to gas cap is defined as internal oil-gas interface.
If gas production rate is 0%, oil ring is produced alone till exhaustion while gas cap expand to displace oil ring. As viscosity of gas is small, fingering phenomenon occurs in displacement of crude oil. At the same time, gas is likely to migrate to top of stratum due to large difference of oil-gas density, resulting in faster migration speed of external oil-gas interface than that of internal oil-gas interface. Migration form is shown in Figure 4A.
If gas production rate is 4%, migration speed of oil-gas interface will slow down due to coordinated development and fingering phenomenon will be weakened. Moreover, oil-gas interface is kept nearly parallel to initial interface for down migration and migration speeds of internal and external oil-gas interfaces are almost the same. Its migration form is shown in Fig. 4B.
Gas Production Well
Oil Production Well
Gas Cap
Oil Rim
Residue oil internal oil-gas
interface external oil-gas interface
A. Migration form of oil-gas interface when oil producing rate is 0%
Gas Production Well
Oil Production Well
Gas Cap
Oil Rim Residue oil
B. Migration form of oil-gas interface when gas production rate is 4%
Fig. 4. Migration form of oil-gas interface with different gas production rate
III. OPTIMIZATION OF DEVELOPMENT OF GAS-CAP
RESERVOIR
certain development period. At the same time, if gas
channeling is very serious, oil wells will be closed in consideration of environmental protection and economic benefits. After considering development limit and well shut-in problem due to gas channeling and other production conditions, this paper studied the optimization of coordinated development method for gas-cap oil ring.
A. No Consideration of Development Period or Well Shut-in Due to Gas Channeling.
T If development period and well shut-in problem due to gas channeling are not considered, the deadline of gas-cap reservoir recovery will be the time when stratum pressure reaches the abandonment pressure of reservoir. Through indoor experiments, changing rules of stratum pressure at different gas producing rates will be measured, as is shown in Fig. 11.
0 50 100 150 200 250 300 350 400
0 100 200 300 400 500
St
rat
u
m
pres
s
u
re
,
K
Pa
Time,min
Gas producing rate 0% Gas producing rate 0.5% Gas producing rate 2% Gas producing rate 4% Gas producing rate 8%
Fig. 5. Curve on stratum pressure at different oil production rates
From Fig. 5, we can see that if gas production rate is 0% and 0.5% respectively, declining process of stratum pressure will be divided into two parts according to declining speed. In early development period, pressure decline will be slow due to small gas producing rate. After gas breakthrough, pressure decline will be faster due to large gas output in oil wells. If gas production rate is larger than 2%, declining speed of stratum pressure will be kept invariable basically, showing that if gas production rate is more than 2%, there will be no gas channeling or a small volume of gas channeling. At the same time, with the increase of gas production speed, pressure decline will be fast and development time will be shortened obviously.
In order to analyze the influence of coordinated development on development effects of gas-cap reservoir, curves at different gas producing rates were acquired through experiments. From Fig. 6, we can see gas production rate is of little influence on final recovery of gas cap. With the increase of gas production rate, recovery rate of gas cap will be increased slightly. But with the increase of gas production rate, decline of stratum pressure will be accelerated, development years of reservoir will be shortened, oil recovery will be reduced and development effect will become worse.
If gas production of 1255m3 is converted to 1t oil, accumulated oil and gas equivalent curves at different gas producing rates will be worked out. Owing to little influence of gas producing rates on recovery of gas volume, trend of oil and gas equivalent is consistent with the recovery rate of oil ring. If development years of reservoir and well shut-in are not considered, development effects of reservoir will become
better when gas production rate becomes smaller.
0 10 20 30 40 50 60 70 80
0 1 2 3 4 5 6 7 8
R
e
cov
e
ry
r
at
e
,
%
Gas producing rate,%
Gas cap Oil ring
Equivalent oil and gas
Fig. 6. Curve of gas production rate with gas-cap recovery, oil recovery and oil and gas equivalent recovery (without considering development years and
well closing)
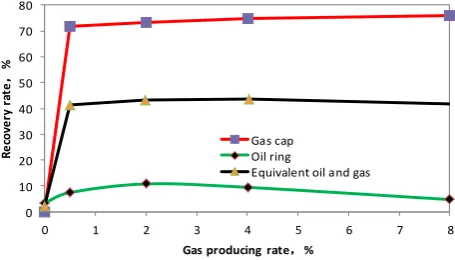
B. Considering Well Shut-in Without Considering Development Years
If the influence of well shut-in due to serious gas channeling on production is only considered without considering development years of oilfield, curves on gas production rate and gas-cap recovery rate, recovery rate of oil ring and equivalent recovery rate of oil and gas under such production conditions will be worked out, as show in Fig. 7.
0 10 20 30 40 50 60 70 80
0 1 2 3 4 5 6 7 8
R
e
cov
e
ry
r
at
e
,
%
Gas producing rate,%
Gas cap Oil ring
Equivalent oil and gas
Fig. 7. Curve on gas production speed and gas cap, oil ring and oil-gas equivalent recovery (only considering well shut-in)
cap and oil ring recovery, we can get the result that if gas production rate is between 2% and 4%, oil and gas equivalent recovery will achieve the maximum degree and development effects will be the best.
C. Consideration of both Development Time Limit and Well Shut-in Problem
The influence of gas production rate on development effects of reservoir will be analyzed under the situation of both considering development term of gas-cap reservoir and well shut-in due to gas breakthrough.
Fig. 8 is about the curve of gas production rate with gas-cap recovery, oil recovery and oil and gas equivalent recovery when development term is 50 years.
0 10 20 30 40 50 60 70 80
0 1 2 3 4 5 6 7 8
R
e
cov
e
ry
r
at
e
,
%
Gas producing rate,%
Gas cap Oil ring
Equivalent oil and gas
Fig. 8. Curve of gas production rate with gas-cap recovery, oil recovery and oil and gas equivalent recovery (considering development years and well
closing)
If gas is not produced from gas cap, it is earlier for gas to enter oil well, resulting in well closing due to serious gas channeling, less than 50 years of development for oil ring.
With the increase of gas production rate, migration speed of oil-gas interface will slow down, gas-oil ratio will be lowered, well closing time will be postponed and oil recovery will be increased. Limited by development term, recovery rate of gas cap is about 20% when gas producing rate is 0.5%. If gas production rate is more than 2%, changes of recovery rate of gas cap are not obvious. If gas production rate is more than 2% and there is no gas entering oil well, declining speed of stratum pressure will be faster with the increase of gas producing rate, resulting in shortening development term and declining recovery rate of oil ring. So, with the increase of gas production rate, oil-gas equivalence will be increased firstly, but declined late. If gas production rate is about 2%, oil-gas equivalence will achieve the maximum point and development effects will become the best.
IV. CONCLUSION
Three-dimensional visualized gas cap reservoir’s physical simulation device can be established to analyze the influence of coordinated development on development effects of reservoir through indoor experiment. The experiment results showed that synergistic recovery of gas-cap oil ring is conductive to slow down migration speed of oil-gas interface and stabilize its migration form. At the same time, production gas-oil ratio will be lowered and development effects of reservoir will be improved.
Based on the material balance principle, determine the
gas-cap oil-rim reservoir engineering method by
collaborative development, and calculate the oil gas interface migration law under different development conditions. When the oil production rate is small and the gas production rate is big, the intrusion of oil gas interface into oil rim will slow down. Proper oil production rate and gas production rate can maintain the balance of oil gas interface.
According to reservoir engineering method, it can be concluded that the bigger the gas cap index is, the more powerful the gas cap expanding capacity will be, and the more serious the gas intrusion becomes, the bigger the gas production rate will be in order to remain the balance of oil gas interface.
If development term of reservoir and economic benefits of oil well are considered, stratum pressure will be reduced rapidly and development effects will become worse if gas production rate of gas cap is larger. If gas cap is not put into development, accumulative oil-gas equivalence will achieve the maximum degree and development effects of reservoir will become the best.
If economic benefits of oil well are considered, gas channeling will be reduced with the increase of gas production rate. At the same time, declining speed of stratum pressure will be accelerated and accumulative oil-gas equivalence will be increased firstly and reduced lately. When gas production rate is between 2% and 4%, development effects of reservoir will become the best.
ACKNOWLEDGMENT
This work was financially supported by the National Natural Science Foundation of China and the technology Project is “The Coupling Percolation Mechanism and Model for Fractured Low Permeability and Ultra-low Permeability Reservoir” (51174215/E0403).
This work was financially supported by the national major projects of 973 and the technology Project is “The seepage mechanics theory by CO2 flooding” (2011CB707305-005).
REFERENCES
[1] R. C. MacDonald and K. H. Coats, “Methods for numerical simulation of water and gas coning,”SPE Journal, vol. 10, no. 4, pp. 425, 1970. [2] D. V. Addington, “An approach to gas-coning correlations for a large
grid cell reservoir simulator,”Journal of Petroleum Technology, vol. 33, no. 11, pp. 2267, 1981.
[3] S. I. Onwukwe and B. Obah, ”Production optimization in Thin-oil column with horizontal well placement,”Oil Gas-European Magazine, vol. 35, no. 3, pp. 121, 2009.
[4] G. Kartoatmodjo, C. Bahri, and A. Badawy et al., “Optimizing horizontal well placement and reservoir inflow in thin oil rim improves recovery and extends the life of an aging field,” in Proc. Asia Pacific Oil and Gas Conference & Exhibition, Jakarta, Indonesia, vol. 4, no. 6, August 2009.
[5] E. F. Delauretis, H. W. Yarranton, and R. O. Baker, “Application of material balance and volumetrics to determine reservoir fluid saturations and fluid contact levels,” in Prof. Petroleum Society’s 7th Canadian International Petroleum Conference ( 57th Annual
Technical Meeting ), Calgary, Alberta, Canada, June 13 – 15, 2006.
[6] E. A. Razak, S. C. Keng, and N. Darman, “Breaking oil recovery limit in Malaysian thin oil rim reservoirs: enhanced oil recovery by gas and water injection,” in Prof. SPE Enhanced Oil Recovery Conference, Kuala Lumpur, Malaysia, July 19-21, 2011.
[7] J. Ali-Nandalal, M. Staines, Y. K. Ballyet al., “Optimal locations and performance prediction of horizontal oil wells in the oil rim at mahogany field, offshore Trinidad,” in Prof. SPE Annual Conference
and Exhibition, Houston, Texas, October 3-6, 1999.
American and Caribbean Petroleum Engineering Conference, Port of
Spain, Trinidad, April 27-30, 2003.
[9] D. T. Vo, E. L. Marsh, L. J. Sienkiewicz et al., “Gulf of mexico horizontal well improves attic-oil recovery in active water drive reservoir,” in Prof. SPE/DOE Symposium on Improved Oil Recovery, Tulsa, Oklahoma, April 21-24, 1996.
[10] D. T. Vo, “Development of thin oil columns under water drive: serang field examples,” in Prof. Asia Pacific Oil and Gas Conference and
Exhibition, Jakarta, Indonesia, April 20-22, 1999.
[11] C. S. Kabir, M. O. Agamini, and R. A. Holguin, “Production strategy for thin-oil columns in saturated reservoirs,”SPE Reservoir Evaluation & Engineering, vol. 11, no. 1, pp. 73, 2008.
[12] F. Kuppe, S. Chugh, and J. D. Kyles, “Modelling the reservoir mechanisms for gas cap blowdown of the Virginia hills belloy reservoir,”Journal of Canadian Petroleum Technology. vol. 39, no. 11, pp. 25, 2000.
[13] M. F. Fayzullin, A. Z. Nasibullin, and A. V. Yazkov, “The potential of smart well solutions for the development of thin oil rims during gas condensate production in the Yamal Region of Russia,” in Prof. of SPE
EUROPEC/EAGE Annual Conference and Exhibition, Vienna, Austria,
May 23-26, 2011.
[14] T. C. Billiter and A. K. Dandona, “Breaking of a paradigm: the simultaneous production of the gascap and oil column,” in Prof. of SPE
International Oil and Gas Conference and Exhibition, Beijing, China,
November 2-6, 1998.
Jia Liuis a Ph.D candidate of oil & gas development major in College of Petroleum Engineering at China University of Petroleum (Beijing). He received a bachelor’s degree in Wuhan University. He obtained the qualification sent a graduate student in 2009, the qualification direct pursuing Dr. in 2011. He has been committed to the water flooding, sweep efficiency and EOR research on low permeability reservoir.
Linsong Cheng is a professor of oil & gas
development major in College of Petroleum Engineering at China University of Petroleum (Beijing). He received his ME and PhD in Oil & Gas development from the University of Petroleum-Beijing. His research has focused on low permeability reservoir percolation mechanism, water flooding, EOR, reservoir engineering evaluation and parameters optimization.
Shijun Huang is a professor of oil & gas
development major in College of Petroleum Engineering at China University of Petroleum (Beijing). He received his ME and PhD in oil & gas development from the University of Petroleum-Beijing. His research has focused on low permeability reservoir percolation mechanism, water flooding, EOR, reservoir engineering evaluation and parameters optimization.