Node Voltage Improvement by Capacitor
Placement in Distribution Network : A Soft
Computing Approach
SHWETA SARKAR
Lecturer Dept. of Electrical & Electronics Engineering, Sikkim Manipal Institute of Technology Email: [email protected]
SANDEEP CHAKRAVORTY
Associate Professor Dept. of Electrical & Electronics Engineering, Sikkim Manipal Institute of Technology Email: [email protected]
Abstract:
This paper deals with a genetic algorithm based approach for determining the optimum placement location of capacitor in radial distribution system which is obtained after optimum reconfiguration. Reduction of total losses in distribution system is very essential to improve the overall efficiency of power delivery. This can be achieved by placing the optimal value of capacitors at proper locations in radial distribution systems. The proposed methodology is a genetic approach based algorithm. The best location of the capacitor and the sizing of the capacitor is determined based on genetic algorithm. The objective function is to place the optimal value of capacitors at best locations, which maximizes net savings in the distribution system. The proposed method directly gives the best locations and identifies the optimal size. Here we have tried the requirement by the use of genetic algorithm and further we have tried to improve the node voltages by placing the capacitor bank at susceptible load points. We have run load flow program developed in MATLAB environment on the optimum feeder layout obtained [10] and further we have tried to improve the node voltages of the network by trying the various combinations of capacitor bank. The fitness function of the chromosomes turns out to be the maximum of the minimum node voltages. Using GA the paper gives the optimum combination for replacement of capacitor for the best node voltages.
The result is tested on single feeder network and the work has been carried out in MATLAB environment. Keywords: Power distribution planning, Genetic algorithm, Network reconfiguration, Load flow analysis.
Introduction:
Electrical distribution networks are interconnected and meshed networks. They are arranged to be radial in operation. Network configurations may be changed by manual or automatic switching operations so that, all the loads are supplied and reduce power loss. In order to relieve the overloading of distribution system reconfiguration is one important approach. The existing distribution networks are growing with complexity more and more, due to the gradual increase of power demand and variation of loads. Efficient operation of distribution networks can be achieved by reconfiguration of the network to reduce line losses and improve system reliability. Feeder reconfiguration is performed by opening sectionalizing (normally closed) and closing tie (normally open) switches of the network. These switching are performed in such a way that the radiality of the network is maintained and all the loads are energized. A normally open tie switch is closed to transfer a load from one feeder to another while an appropriate sectionalizing switch is opened to restore the radial structure [1].
Capacitors are widely used in electric power distribution systems to achieve power and energy loss reduction and to maintain a voltage profile within permissible limits. The scope of these benefits depends on the location, size, type and number of capacitors. Many attempts have been made to solve the problem using nonlinear optimization techniques and the combinatorial optimization techniques [18]. Although all these methods to solve capacitor allocation problem have various merits, their efficacy relies entirely on the goodness of the data used. At the present stage of research, load-flow on radial feeders is used to evaluate the fitness of arbitrary solutions. Optimum capacitor placement is achieved using sophisticated method such as genetic algorithms. From literature survey, many of the previous strategies for capacitor allocation are also limited for the application to planning, expansion or operation of distribution systems. Very few of these capacitor allocation techniques have the flexibility of being applicable to more than one of the above problems. Hence, this paper presents a genetic approach to determine suitable locations for capacitor placement and the sizing of the capacitor. This approach has the versatility of being applied to the planning, expansion, and operation studies of distribution systems. The proposed method was tested on two distribution systems consisting of 15 node distribution systems.
Proposed methodology:
In electrical distribution systems, power losses depend on the real and reactive power flows, which are related to the real and reactive loads. Here in this paper we have proposed a GA based optimal capacitor replacement method for improvement of the node voltages for a single feeder network. In the work done by Sandeep Chakravorty et al. in [16] an optimum feeder network has been obtained however the load flow analysis of the problem is not done. . Minimum power losses reconfiguration by means of controllable tie-switches installed on the network branches is tried [15].The position of tie switches and a load flow analysis of the result obtained in [10] are conducted and improvement of the node voltages by network reconfiguration using GA is tried [15]. Here in this paper we assume the model is developed with a 8 bit string of chromosomes.
The logic used in the method is described below:
Step 1: Get the number of load points to be considered m (in the problem considered m=8. Considering load points fed from substation 1.
Step 2 : Chose the initial population for genetic algorithm. Out of 8 bits the decimal numbers represent the size of capacitor bank to be installed whose actual MVAR rating is mentioned in the appendix.
Step 3: Compute the fitness value (F1) given as F1(x) = maximum of the lowest node voltage. Node voltages are calculated by load flow technique.
Step 4: Sort the chromosomes as per their fitness value and perform tournament selection and two point cross over to obtain the offspring. Select only those offspring which gives the maximum value of load points.
Step 5: Calculate the fitness function (F2) of the offspring. Compare F1 with F2 to check whether offspring are fit enough to give solution or not. If F1>F2 then go to step 4 and repeat complete step till F1<F2. Else, go to step 6. Step 6: Perform mutation on one chromosome.
Step 7: Replace the old population or (initial) with the new improved population generated and repeat steps 3 to 5. Step 8: If all the fitness values becomes almost constant or the maximum number of iterations have been reached then print the solution and stop.
the fitness function for that chromosome and we select those chromosomes for cross over which turns out to have the maximum fitness function.
Case Study & Result:
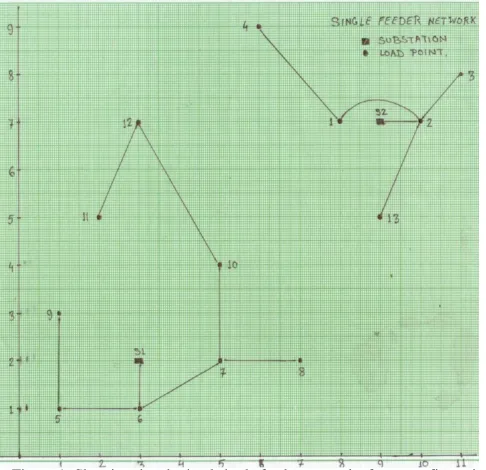
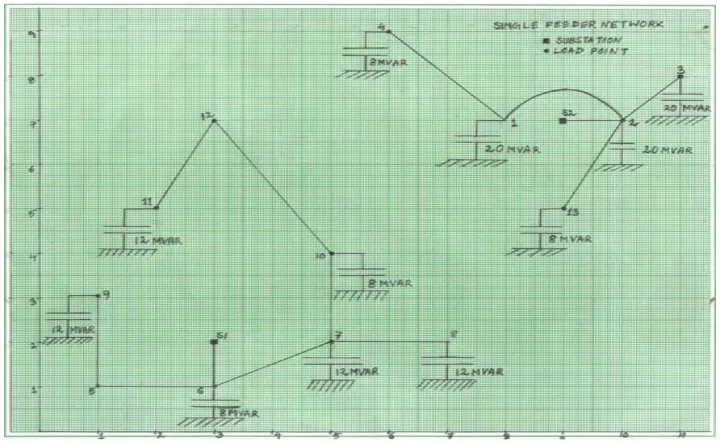
Let us consider the problem discussed in [15]. Assuming the optimum radial reconfigured system is available we can represent the problem in pictorial form as shown in figure 1.
Figure 1: Showing the obtained single feeder network after reconfiguration
The results obtained for choosing the single feeder layout from substation 1 after first iteration is shown in table 1. Results of two point cross over is as shown in table 2.
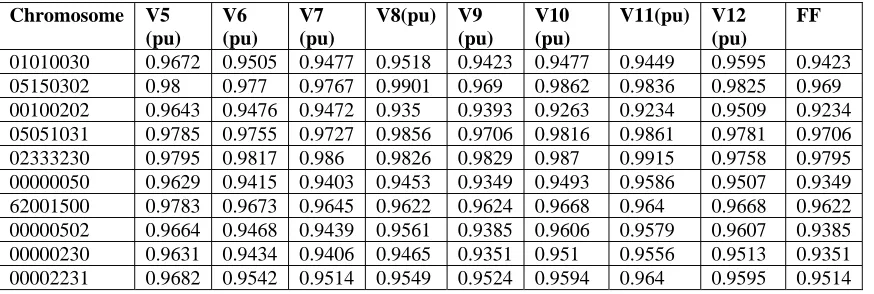
The results obtained for choosing the single feeder layout from substation 1 after second iteration is shown in table 3.
The ultimate result obtained is with Fitness function: 0.9795
The results obtained for choosing the single feeder layout from substation 2 after first iteration is shown in table 4. Results of two point cross over is as shown in table 5.
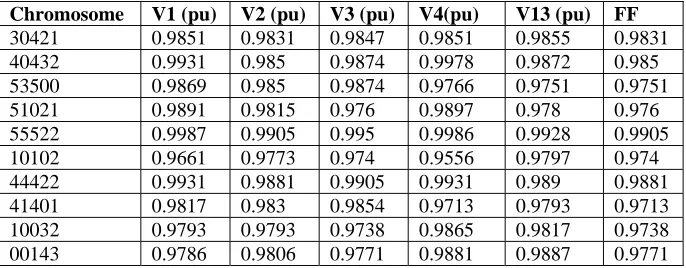
The results obtained for choosing the single feeder layout from substation 2 after second iteration is shown in table 6.
The ultimate result obtained is with Fitness function: 0.9905
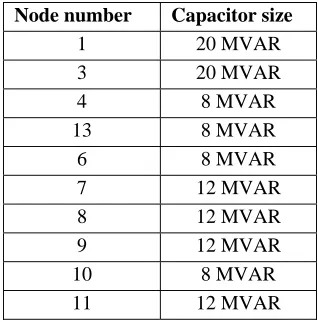
Node number Capacitor size
1 20 MVAR
3 20 MVAR
4 8 MVAR
13 8 MVAR
6 8 MVAR
7 12 MVAR
8 12 MVAR
9 12 MVAR
10 8 MVAR
11 12 MVAR
Conclusion:
In this paper efforts have been made to improve the node voltages by the optimal placement of capacitor in distribution system. Capacitor replacement is done by the use of genetic algorithm. It is proved that the optimum feeder layout obtained in [16] can be made more stable by the concept of placement of capacitor at the susceptible load points with the help of the capacitor bank available.
I. APPENDIX
Table 7: Showing the bus data
Bus Resistance Reactance
S2 ---- 1 0.08 0.05
1 ---- 2 0.15 0.1
1 ---- 4 0.2 0.15
2 ---- 3 0.08 0.06 2 ---- 13 0.25 0.18 3 ---- 4 0.29 0.22 3 --- 13 0.19 0.11 4 ---- 13 0.35 0.25 S2 ---- 2 0.08 0.05 1 ---- 13 0.25 0.18 S1 ---- 6 0.09 0.05
6 ---- 7 0.1 0.08
7 ---- 8 0.09 0.07 7 ---- 10 0.1 0.09 6 ---- 5 0.12 0.09 5 ---- 9 0.18 0.12 9 ---- 11 0.19 0.13 11 ---- 12 0.18 0.14 S1 ---- 5 0.11 0.04 S1 ---- 9 0.14 0.08 9 ---- 10 0.35 0.2 10 ---- 11 0.2 0.12
10 ---- 12 0.22 0.15 6 ---- 8 0.22 0.12 S1 ---- 7 0.12 0.045 S2 ---- 13 0.18 0.11
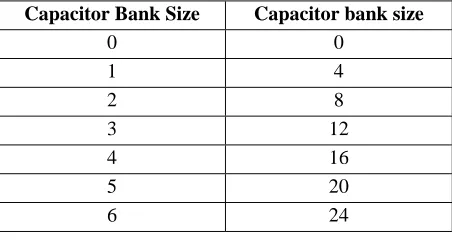
II. APENDIX
Table 8: Chosen Size of Capacitor bank to be installed
Capacitor Bank Size Capacitor bank size
0 0 1 4 2 8 3 12 4 16 5 20 6 24
References
[1] Huddelston, T. et al., (1990), “Reconfiguration algorithm for minimizing losses in radial electric distribution systems,” Electric Power System Research, vol. 18, pp. 57-60.
[2] Goswami, S.K., and Basu, S.K. (1992), “A new algorithm for the reconfiguration of distribution feeders for loss minimization,” IEEE Transactions on Power Delivery, vol. 7, pp. 1484-1491.
[3] Wagner, T.P. et al., (1991), “Feeder reconfiguration for loss reduction: an application of distribution automation,” IEEE Transactions on Power Delivery, vol. 6, pp. 1921-1933.
[4] Baran, M.E., and Wu, F.F. (1989), “Network configuration in distribution system for loss reduction and load balancing,” IEEE Transactions on Power delivery, vol. 4, pp. 1401-1407.
[5] Merlin, A., and Back, H. (1975), “ Search for a minimum loss operating spanning tree configuration in an urban power distribution systems,”
[6] Proceedings of the 5-th Power System Computation Conference, Cambridge, U.K., pp. 1-18 Belgin Turkay and Taylan Artac. (2005), “Optimal Distribution Network Design Using Genetic Algorithm,” Electric Power Components and Systems, 33; 513-524.
[7] J.F.Gomez et al. (2004), “Ant Colony System Algorithm for the Planning of Primary Distribution Circuits,” IEEE Transactions on Power Systems, Vol. 19, No. 2.
[8] K.K.Li and T.S.Chung. (2004), “Distribution Planning Using Rule Based Expert System Approach,” IEEE International Conference on Electric Utility Deregulation and Power Technologies(DRPT 2004).
[9] Eloy Diaz-Dorado et al. (2002), “Application of Evolutionary Algorithms for the Planning of Urban Distribution Networks of Medium Voltage,” IEEE Transaction Power System, Vol. 17, No. 3.
[10] Sujit Mondal and Anil Pahwa. (2002), “Optimal Selection of Conductors for Distribution Feeders,” IEEE Transactions on Power Systems, Vol. 17, No. 1.
[11] Sandeep Chakravorty and Manish Thukral. (2008), “Using Genetic Algorithm to Determine the Optimum Location of the Sub Station”, International Workshop and IEEE EDS Mini Colloquia on NAnometer CMOS Technology (WIMNACT 2008) on Nanoelectronics 6-8 March 2008.
[12] Sandeep Chakravorty, Smarajit Ghosh, (2009), “An Improvised Method for Distribution of Loads and Configuration of Distribution Sub Station”, International Journal of Engineering Research and Industrial Applications. Vol.2 No. II, pp. 269-280. 2009.
[13] Sandeep Chakravorty, Smarajit Ghosh, “Fuzzy Based Distribution Planning Technique”, Journal of Electrical Engineering. Volume 9 / 2009 -Edition: 2, pp. 38-43.
[14] Sandeep Chakravorty, Smarajit Ghosh, (2009), “Distribution Planning Based on Reliability and Contingency Criteria”, International Journal of Computer and Electrical Engineering. Vol.1 No. 2, pp. 156-161. 2009.
[15] Sandeep Chakravorty,Jaydeep chakravorty, Shweta Sarkar,(2009),”Node Voltage Improvement by Network Reconfiguration: A Soft Computing Approach; “ Proceedings of Inter national Conference on ACT 2009, Trivandrum. India.
[17] Sandeep Chakravorty and Smarajit Ghosh (2009), “A Novel Approach to Distribution Planning in an Unstructured Environment”, International Journal of Computer and Electrical Engineering. Vol.1 No. 3, pp.362-367.
[18] P.V. Prasad
1
, S. Sivanagaraju
2
and N.Sreenivasulu
3
A fuzzy genetic algorithm for optimal capacitor placement in radial distribution systems; ARPN Journal of Engineering and Applied Sciences ©2006-2007 Asian Research Publishing Network (ARPN). Vol. 2, No. 3, June 2007 ISSN 1819-6608
Table 1: Showing the results obtained for choosing the single feeder layout from substation 1 after first iteration
Table 2: Result after two points cross over
Chromosome V5 (pu) V6 (pu) V7 (pu) V8 (pu) V9 (pu) V10 (pu) V11 (pu) V12 (pu) FF
00101032 0.9674 0.9535 0.9532 0.9447 0.9485 0.9404 0.945 0.9567 0.9404 62000500 0.9768 0.963 0.9601 0.9606 0.9549 0.9651 0.9624 0.9651 0.9549 00002230 0.9667 0.9527 0.9498 0.9501 0.9508 0.9547 0.9592 0.9549 0.9498 01010300 0.964 0.9472 0.9444 0.9422 0.939 0.9381 0.9353 0.95 0.9353 02330050 0.975 0.9692 0.9736 0.9772 0.9612 0.9811 0.9901 0.9708 0.9612 00001502 0.9681 0.9514 0.9485 0.9579 0.9463 0.9624 0.9597 0.9625 0.9463 05150032 0.9799 0.977 0.9766 0.9899 0.969 0.9859 0.9903 0.9823 0.969 00000231 0.9648 0.945 0.9422 0.9512 0.9369 0.9558 0.9603 0.956 0.9422 05050201 0.9761 0.9704 0.9676 0.9776 0.9624 0.9693 0.9666 0.9734 0.9624 00003230 0.9683 0.957 0.9541 0.9519 0.9582 0.9563 0.9609 0.9565 0.9519
Table 3: Showing the final result obtained for choosing the single feeder layout from substation 1
Chromosome V5 (pu) V6 (pu) V7 (pu) V8(pu) V9 (pu) V10 (pu) V11(pu) V12 (pu) FF
01010030 0.9672 0.9505 0.9477 0.9518 0.9423 0.9477 0.9449 0.9595 0.9423 05150302 0.98 0.977 0.9767 0.9901 0.969 0.9862 0.9836 0.9825 0.969 00100202 0.9643 0.9476 0.9472 0.935 0.9393 0.9263 0.9234 0.9509 0.9234 05051031 0.9785 0.9755 0.9727 0.9856 0.9706 0.9816 0.9861 0.9781 0.9706 02333230 0.9795 0.9817 0.986 0.9826 0.9829 0.987 0.9915 0.9758 0.9795 00000050 0.9629 0.9415 0.9403 0.9453 0.9349 0.9493 0.9586 0.9507 0.9349 62001500 0.9783 0.9673 0.9645 0.9622 0.9624 0.9668 0.964 0.9668 0.9622 00000502 0.9664 0.9468 0.9439 0.9561 0.9385 0.9606 0.9579 0.9607 0.9385 00000230 0.9631 0.9434 0.9406 0.9465 0.9351 0.951 0.9556 0.9513 0.9351 00002231 0.9682 0.9542 0.9514 0.9549 0.9524 0.9594 0.964 0.9595 0.9514
Chromoso me V5 (pu) V6 (pu) V7 (pu) V8 (pu) V9 (pu) V10 (pu) V11 (pu) V12 (pu) FF
Table 4: Showing the results obtained for choosing the single feeder layout from substation 2 after first iteration
Chromosome V1 (pu)
V2 (pu) V3 (pu) V4(pu) V13 (pu) FF
10032 0.9676 0.979 0.9734 0.9823 0.9813 0.9676 00143 0.9786 0.9806 0.977 0.9881 0.9887 0.977 45012 0.987 0.985 0.9794 0.982 0.9873 0.9794 10432 0.9779 0.9821 0.9845 0.9826 0.9843 0.9779 30521 0.9856 0.9836 0.9881 0.9854 0.9801 0.9801 41502 0.9834 0.9846 0.9891 0.9731 0.987 0.9731 51420 0.9925 0.9842 0.9867 0.9923 0.9744 0.9744 50421 0.9918 0.9835 0.9861 0.9917 0.9752 0.9752 51402 0.9865 0.9846 0.9871 0.9762 0.987 0.9762 43021 0.9881 0.983 0.9774 0.988 0.9794 0.9774
Table 5: Result after two points cross over
Chromosome V1 (pu) V2 (pu) V3 (pu) V4(pu) V13 (pu) FF
10522 0.9783 0.9829 0.9873 0.9781 0.9851 0.9781 30431 0.9883 0.9834 0.9859 0.9931 0.9798 0.9798 53020 0.9913 0.983 0.9774 0.9911 0.9748 0.9748 41421 0.9889 0.9838 0.9862 0.9888 0.9755 0.9755 55012 0.9914 0.9861 0.9816 0.9863 0.9885 0.9816 41402 0.9825 0.9838 0.9862 0.9721 0.9861 0.9721
40422 0.989 0.984 0.9854 0.989 0.9862 0.9854
51501 0.9865 0.9846 0.9891 0.9762 0.981 0.9762 10142 0.9788 0.98 0.9765 0.9883 0.9823 0.9765 00033 0.9739 0.9789 0.9733 0.9787 0.987 0.9733
Table 6: Showing the final result obtained for choosing the single feeder layout from substation 2
Chromosome V1 (pu) V2 (pu) V3 (pu) V4(pu) V13 (pu) FF
30421 0.9851 0.9831 0.9847 0.9851 0.9855 0.9831 40432 0.9931 0.985 0.9874 0.9978 0.9872 0.985 53500 0.9869 0.985 0.9874 0.9766 0.9751 0.9751 51021 0.9891 0.9815 0.976 0.9897 0.978 0.976
55522 0.9987 0.9905 0.995 0.9986 0.9928 0.9905 10102 0.9661 0.9773 0.974 0.9556 0.9797 0.974 44422 0.9931 0.9881 0.9905 0.9931 0.989 0.9881 41401 0.9817 0.983 0.9854 0.9713 0.9793 0.9713 10032 0.9793 0.9793 0.9738 0.9865 0.9817 0.9738 00143 0.9786 0.9806 0.9771 0.9881 0.9887 0.9771