Abstract— The rapid increase of the urban population in developing countries such as India, has forced the reevaluation of the importance of high rise buildings. The structural systems of high rise buildings are usually sensitive to the effects of wind. Gust is the most critical effect of the wind. The gust effectiveness factor method takes into account the dynamic properties of the structure , the wind-structure interactions and then determines the wind loads as equivalent static loads.
In this paper, different shapes of building of height 150 m having equal plan area, equal stiffness of column are considered for wind load analysis. Wind loads are determined based on gust effectiveness factor method. The critical gust loads for design are determined. After the application of calculated wind loads to the building models prepared in finite element software package ETAB’s 13.1.1v. having different shapes are compared in various aspects such as storey displacements, storey drifts, storey shear, axial forces in column etc.
Based on the results, conclusions are drawn showing the effectiveness of different shapes of the structure under the effect of wind loads.
Index Terms— Storey displacement, Storey drift, storey shear Gust, Wind load
I. INTRODUCTION
Wind is air in motion relative to the surface of the earth. It varies with time and space. Due to the unpredictable nature of wind, it is necessary to design the tall structures by considering the critical effects of wind on the structure. Wind force depends upon exposed area of the structure. The wind force depends upon terrain and topography of location as well as the nature of wind, size and shape of structure and dynamic properties of building. It is very important to consider fluctuating component of wind pressure while designing. Wind gusts cause fluctuating force on the structure which induced large dynamic motions and oscillations. The performance of a structure can be improved when a wind acts by improving the shape of the structure by providing curved edges so that the wind load will be less. The evaluation of along wind load can be done by using gust factor method. The gust factor method uses the statistical concepts of a stationary time series to calculate the response of structure to a gusty wind. Hence it is important for the estimation of wind loads on the flexible structures.
It is important to evaluate the characteristics of fluctuating wind forces and the dynamic characteristics of the building. The wind induced building response of tall buildings can be reduced by means of aerodynamic based design and
modifications that change the flow pattern around the building or break up the wind affecting the building face.
II. METHODOLOGY
In this study, the gust response factors for various along wind response components at different shape of building as per I.S 875(part3)-1987 are calculated and analyzed with the help of ETAB‟s 13.1.1v.
Table -1: Parameters considered for the study
No. of Storey 50
Bottom storey height 3m
Storey height 3m
Soil type Medium
Wind zone I
Terrain category II
Shape of buildings Rectangular, square, circular and elliptical
Plan area 2500 m2 Grid size 5 m x 5m Thickness of slab 0.125m Beam size 0.3m x 0.6 m Column size 1m x 1m Material Properties Grade of concrete M40
Grade of steel Fe500
Dead load intensities
FF on floors 1.75 kN/m²
FF on roof 2 kN/m²
Live load intensities
LL on floors 2 kN/m²
LL on roof 1 kN/m2
2.1 DESIGN WIND SPEED
The basic wind speed (Vz) for any site shall be obtained
from Fig.1 IS: (875(Part 3)-1987) and shall be modified to include the following effects to get design wind velocity at any height (Vz) for the chosen structure:
a) Risk level
b) Terrain roughness, height and size of structure; and c) Local topography
Vz = Vb.k1.k2.k3
Vz= hourly mean wind speed in m/s, at height z
Vb = regional basic wind speed in m/s
k1 = probability factor (risk coefficient) (Clause 5.3.1 of IS:
875(Part 3)-1987)
Effects of Shape on Wind Forces of High Rise
Buildings Using Gust Factor Approach
k2 = Terrain and height factor (Clause 5.3.2 of IS: 875(Part
3)-1987)
k3 = topography factor (Clause 5.3.3 of IS: 875(Part 3)-1987)
2.2 DESIGN WIND PRESSURE
The design wind pressure at any height above mean level shall be obtained by the Following relationship between wind pressure and wind velocity:
Pz=0.6 Vz2
Where, Pz= Design wind pressure in N/m2 at height 'z' m
Vz= design wind velocity in m/s at height „z‟ m
2.3 BUILDING MODELS
Fig-1: Plan and 3-D view of square building
Fig-2: Plan and 3-D view of rectangular building
Fig-4: Plan and 3-D view of elliptical building 2.4 GUST FACTOR METHOD
A gust factor, defined as the ratio between a peak wind gust and mean wind speed over a period of time can be used along with other statistics to examine the structure of the wind. Gust factors are heavily dependent on upstream terrain conditions (roughness).
Since early 1960‟s, when Davenport‟s (1961) explained statistical concepts of the stationary time series for the determination of the response of simple structures to a turbulent gusty wind, efforts had been made to express peak stresses, accelerations, etc., in terms of the mean wind velocity, the spectrum of the gustiness and the mechanical and aerodynamic properties of the structure. Still today Davenport‟s (1967) „gust loading factor approach‟ forms the most acceptable approach for prediction of mean and fluctuating response of slender structures.
2.5 ANALYSIS
Constants and parameters used for gust factor analysis are: i. T = Time period (pg.48, IS 875(part-3)-1987)
ii. Cf = Force coefficient for clad building (fig. 4 of IS
875(part-3)-1987)
iii. gf = Peak Factor and Roughness Factor (fig. 8 of IS
875(part-3)-1987)
iv. B = Background factor (fig. 9 of IS 875(part-3)-1987) v. S = Size reduction factor (fig. 10 of IS
875(part-3)-1987) vi. Ø = Constant
vii. E = Gust energy factor (fig. 11 of IS 875(part-3)-1987) viii. β = (pg.52, IS 875(part-3)-1987)
ix. G = Gust factor
x. Fx = Along wind load on the structure on a strip area at
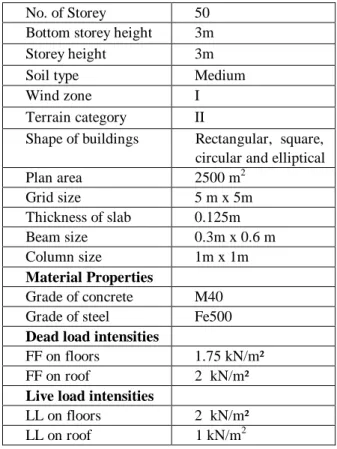
Table -2: Parameters considered for gust factor analysis Name of parameter Square model Rectangular model Circular model Elliptica l model k1 1 1 1 1 k3 1 1 1 1 Class B C C C Tx 1.9 1.61 2.54 2.18 Ty 1.9 2.25 2.54 2.94 Cf 1.25 1.1 0.7 0.2 gf 0.85 0.85 0.85 0.85 B 0.85 0.85 0.85 0.85 Ø 0 0 0 0 β 0.016 0.016 0.016 0.016
Table -3: Wind loads with gust factor (kN)
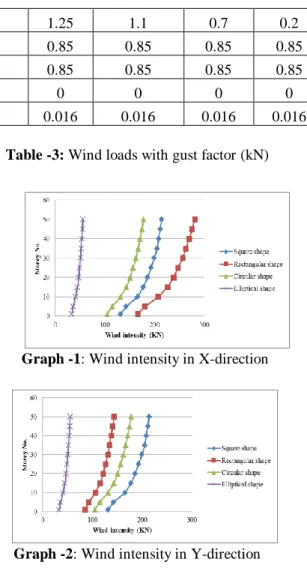
Graph -1: Wind intensity in X-direction
Graph -2: Wind intensity in Y-direction III RESULTS AND DISCUSSION
This section contains behavior of various buildings of different shapes.
3.1 LATERAL DISPLACEMENT
It is displacement caused by the lateral force on the each storey level of structure.
Table -4: Comparison of storey displacement with gust factor (X-direction) (kN)
Storey No.
Height m
Square Rectangular Circular Elliptical
Storey displacemen t Storey displacemen t % Decrease Storey displacemen t % Decrease Storey displacemen t % Decrease (mm) (mm) (mm) (mm) 0 0 0.7 0.6 14.286 0.8 -14.286 0.2 71.429 10 30 25.2 21.7 13.889 26 -3.175 7.4 70.635 20 60 48.7 37.6 22.793 50.4 -3.491 14.2 70.842 30 90 67.5 49.9 26.074 69.7 -3.259 19.5 71.111 40 120 80.5 58.1 27.826 83 -3.106 23.1 71.304 50 150 87.4 62.1 28.947 90.1 -3.089 24.9 71.510 Floor no. Squar e Rectangular Circula r Elliptical X Y X Y 1 96.46 116.57 67.26 94.77 30.17 29.22 5 111.76 134.82 78.52 109.81 35.17 33.85 10 136.45 162.67 95.85 132.90 42.91 40.80 15 153.23 181.94 107.96 149.22 48.41 45.84 20 165.27 194.96 116.17 160.49 52.06 49.17 25 175.29 204.68 122.30 168.74 54.74 51.67 30 183.98 214.61 128.60 177.10 57.98 54.23 35 191.70 223.33 134.15 184.53 60.85 56.44 40 197.03 229.23 137.91 189.55 62.69 57.96 45 203.04 235.21 141.72 194.60 64.47 59.52 50 209.79 241.27 145.57 200.41 66.31 61.10
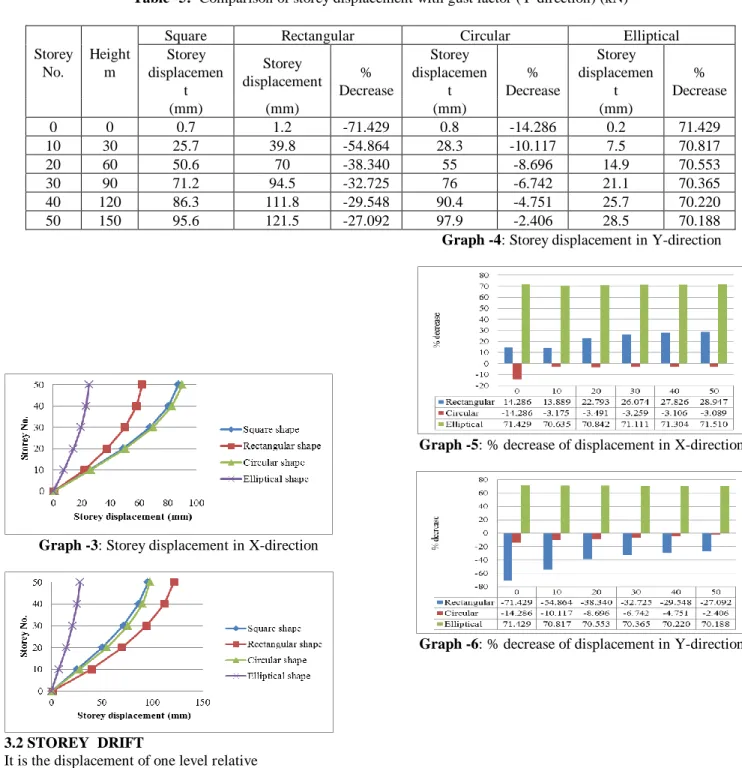
Table -5: Comparison of storey displacement with gust factor (Y-direction) (kN) Storey No. Height m
Square Rectangular Circular Elliptical
Storey displacemen t Storey displacement % Decrease Storey displacemen t % Decrease Storey displacemen t % Decrease (mm) (mm) (mm) (mm) 0 0 0.7 1.2 -71.429 0.8 -14.286 0.2 71.429 10 30 25.7 39.8 -54.864 28.3 -10.117 7.5 70.817 20 60 50.6 70 -38.340 55 -8.696 14.9 70.553 30 90 71.2 94.5 -32.725 76 -6.742 21.1 70.365 40 120 86.3 111.8 -29.548 90.4 -4.751 25.7 70.220 50 150 95.6 121.5 -27.092 97.9 -2.406 28.5 70.188
Graph -3: Storey displacement in X-direction
Graph -4: Storey displacement in Y-direction
Graph -5: % decrease of displacement in X-direction
Graph -6: % decrease of displacement in Y-direction
3.2 STOREY DRIFT
It is the displacement of one level relative of the other level above or below.
Table -6: Comparison of Storey drift with gust factor (X-direction)
Storey No.
Height m
Square Rectangular Circular Elliptical
Storey drift Storey drift Decrease % Storey drift Decrease % Storey drift Decrease % 0 0 0.246 0.173 29.675 0.258 -4.878 0.076 69.106 10 30 0.849 0.583 31.331 0.885 -4.240 0.243 71.378 20 60 0.71 0.482 32.113 0.741 -4.366 0.2 71.831
Table -7: Comparison of Storey drift with gust factor (Y-direction) Storey No. Height m
Square Rectangular Circular Elliptical
Storey
drift Storey drift %
Storey
drift %
Storey
drift %
Decrease Decrease Decrease
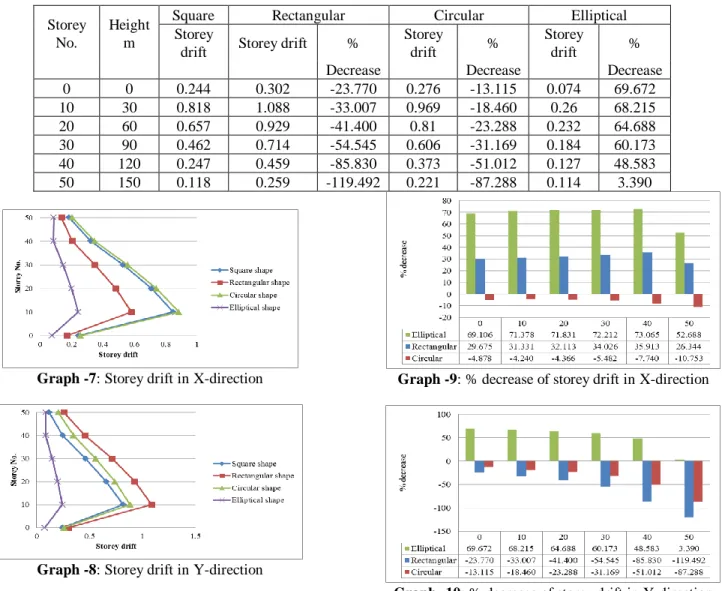
0 0 0.244 0.302 -23.770 0.276 -13.115 0.074 69.672 10 30 0.818 1.088 -33.007 0.969 -18.460 0.26 68.215 20 60 0.657 0.929 -41.400 0.81 -23.288 0.232 64.688 30 90 0.462 0.714 -54.545 0.606 -31.169 0.184 60.173 40 120 0.247 0.459 -85.830 0.373 -51.012 0.127 48.583 50 150 0.118 0.259 -119.492 0.221 -87.288 0.114 3.390
Graph -7: Storey drift in X-direction
Graph -8: Storey drift in Y-direction
Graph -9: % decrease of storey drift in X-direction
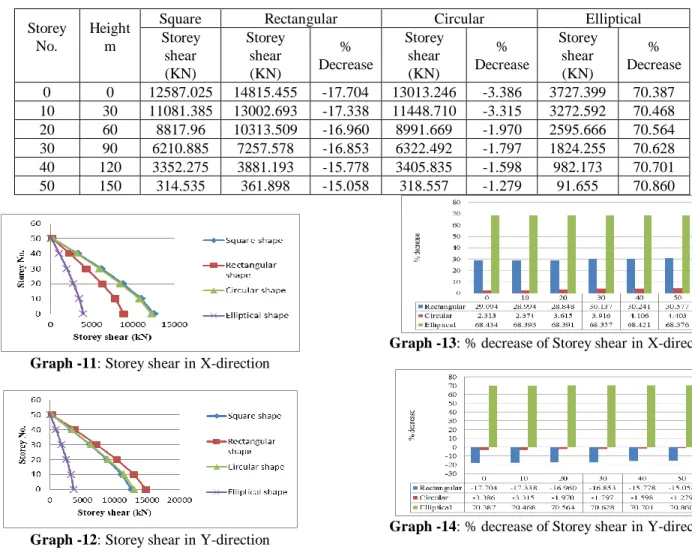
Graph -10: % decrease of storey drift in Y-direction 3.3 STOREY SHEAR
The summation of design lateral forces at levels above the storey under consideration.
Table -8: Comparison of Storey shear with gust factor (X-direction) (kN)
Storey No.
Height m
Square Rectangular Circular Elliptical
Storey shear Storey shear % Decrease Storey shear % Decrease Storey shear % Decrease (KN) (KN) (KN) (KN) 0 0 12573.615 8915.481 29.094 12282.82 9 2.313 3969.000 68.434 10 30 11068.875 7859.618 28.994 10806.05 7 2.374 3498.495 68.393 20 60 8805.45 6265.258 28.848 8487.108 3.615 2783.305 68.391 30 90 6210.885 4339.087 30.137 5967.661 3.916 1965.336 68.357 40 120 3352.275 2338.503 30.241 3214.616 4.106 1058.619 68.421 50 150 314.535 218.360 30.577 300.688 4.403 99.469 68.376
Table -9: Comparison of Storey shear with gust factor (Y-direction) (kN) Storey No. Height m
Square Rectangular Circular Elliptical
Storey shear Storey shear % Decrease Storey shear % Decrease Storey shear % Decrease (KN) (KN) (KN) (KN) 0 0 12587.025 14815.455 -17.704 13013.246 -3.386 3727.399 70.387 10 30 11081.385 13002.693 -17.338 11448.710 -3.315 3272.592 70.468 20 60 8817.96 10313.509 -16.960 8991.669 -1.970 2595.666 70.564 30 90 6210.885 7257.578 -16.853 6322.492 -1.797 1824.255 70.628 40 120 3352.275 3881.193 -15.778 3405.835 -1.598 982.173 70.701 50 150 314.535 361.898 -15.058 318.557 -1.279 91.655 70.860
Graph -11: Storey shear in X-direction
Graph -12: Storey shear in Y-direction
Graph -13: % decrease of Storey shear in X-direction
Graph -14: % decrease of Storey shear in Y-direction
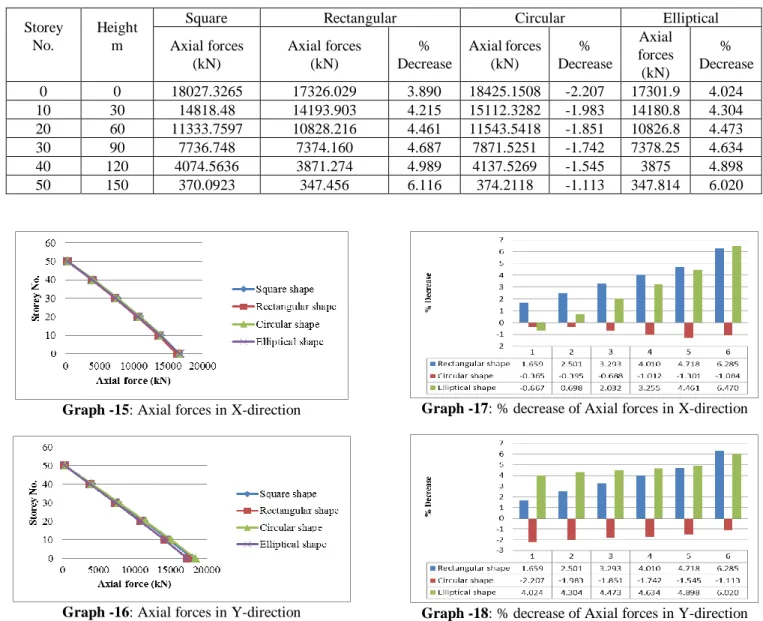
3.4 AXIAL FORCES
Axial forces of column which is common in various shape of buildings is taken for the comparison of results of all the buildings.
Table -10: Comparison of Axial forces in column with gust factor (X-direction) (kN)
Storey No.
Height m
Square Rectangular Circular Elliptical
Axial forces (kN) Axial forces (kN) % Decrease Axial forces (kN) % Decrease Axial forces % Decrease (kN) 0 0 16642.4241 16366.337 1.659 16703.1668 -0.365 16753.4 -0.667 10 30 13949.2225 13600.285 2.501 14004.3564 -0.395 13851.9 0.698 20 60 10899.3488 10540.476 3.293 10974.3874 -0.688 10677.9 2.032 30 90 7590.0918 7285.692 4.010 7666.9083 -1.012 7343.04 3.255 40 120 4072.5453 3880.404 4.718 4125.5469 -1.301 3890.89 4.461 50 150 375.8143 352.193 6.285 379.8881 -1.084 351.499 6.470
Table -11: Comparison of Axial forces in column with gust factor (Y-direction) (kN) Storey No. Height m
Square Rectangular Circular Elliptical
Axial forces (kN) Axial forces (kN) % Decrease Axial forces (kN) % Decrease Axial forces % Decrease (kN) 0 0 18027.3265 17326.029 3.890 18425.1508 -2.207 17301.9 4.024 10 30 14818.48 14193.903 4.215 15112.3282 -1.983 14180.8 4.304 20 60 11333.7597 10828.216 4.461 11543.5418 -1.851 10826.8 4.473 30 90 7736.748 7374.160 4.687 7871.5251 -1.742 7378.25 4.634 40 120 4074.5636 3871.274 4.989 4137.5269 -1.545 3875 4.898 50 150 370.0923 347.456 6.116 374.2118 -1.113 347.814 6.020
Graph -15: Axial forces in X-direction
Graph -16: Axial forces in Y-direction
Graph -17: % decrease of Axial forces in X-direction
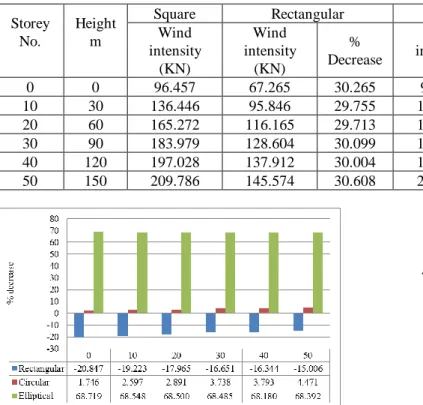
Graph -18: % decrease of Axial forces in Y-direction 3.5 WIND INTENSITY
It is the pressure exerted by the wind on the structure. Following tables and graph shows the variation of wind intensity from square shape to elliptical shape building.
Table -12: Comparison of Wind forces with gust factor (X-direction) (kN)
Storey No.
Height m
Square Rectangular Circular Elliptical
Wind intensity Wind intensity % Decrease Wind intensity % Decrease Wind intensity % Decrease (kN) (kN) (kN) (kN) 0 0 96.457 116.566 -20.847 94.773 1.746 30.172 68.719 10 30 136.446 162.674 -19.223 132.902 2.597 42.915 68.548 20 60 165.272 194.964 -17.965 160.494 2.891 52.061 68.500 30 90 183.979 214.612 -16.651 177.101 3.738 57.981 68.485 40 120 197.028 229.230 -16.344 189.554 3.793 62.695 68.180 50 150 209.786 241.265 -15.006 200.406 4.471 66.310 68.392
Table -13: Comparison of Wind forces with gust factor (Y-direction) (kN) Storey No. Height m
Square Rectangular Circular Elliptical
Wind intensity Wind intensity % Decrease Wind intensity % Decrease Wind intensity % Decrease (KN) (KN) (KN) (KN) 0 0 96.457 67.265 30.265 94.773 1.746 29.222 69.704 10 30 136.446 95.846 29.755 132.902 2.597 40.803 70.096 20 60 165.272 116.165 29.713 160.494 2.891 49.174 70.247 30 90 183.979 128.604 30.099 177.101 3.738 54.235 70.521 40 120 197.028 137.912 30.004 189.554 3.793 57.959 70.583 50 150 209.786 145.574 30.608 200.406 4.471 61.101 70.875
Graph -19: % decrease of Wind intensity in X-direction
Graph -20: % decrease of Wind intensity in Y-direction IV CONCLUSIONS
1. The percentage reduction in peak intensity of wind for circular building is 4.471 %, 68.392 % for elliptical building and it is more by 15 % for rectangular building when compared with square building with gust factor.
2. The percentage reduction in peak displacement is more by 3.08 % in circular building with gust factor in longitudinal direction when compared with square building. The percentage reduction in peak displacement is 70.18 % in elliptical building, it is more by 27 % in rectangular, 2.40 % in circular building when compared with
it is more by 119.49 % in rectangular, 87.28 % in circular building when compared with square building with gust factor in transverse direction. 4. The percentage reduction in peak storey shear is 30.57 % in rectangular building,4.40 % in elliptical building and 68.37 % in circular building with gust factor in longitudinal direction when compared with square building. The percentage reduction in peak drift is decreased by 70.86 % in elliptical building, it is more by 14 % in rectangular, 1.27 % in circular building when compared with square building with gust factor in transverse direction.
5. Buildings having circular or elliptical plan forms have a smaller surface perpendicular to the wind direction, the wind pressure is less than in prismatic buildings.
6. From the above results, with the change in shape of
building from square to elliptical the wind intensity, storey drifts, the lateral displacements, storey shear of the building decreased. Hence it is conclude that wind load is reduced by maximum percentage with an elliptical plan.
REFERENCES
[1] J. A. Amin and A. K. Ahuja “Experimental
study of wind-induced pressures on buildings of various geometries” Journal of engineering, science and technology Vol. 3, No. 5, 2011, pp. 1-19.
[2] Prof. Sarita Singla, Taranjeet Kaur, Megha
Kalra and Sanket Sharma “Behaviour of R.C.C. tall buildings having different shapes subjected to wind load” Journal on civil and environmental engineering 02, 2012, 3-17.
[3] P. Harikrishna, A. Abraham, S. Arunachalam, S. Selvi Rajan and G. Ramesh Babu “Pressure measurement studies on a
high-rise buildings as per IS 875(III)-1987 and proposed draft code (2011)” Global research analysis, ISSN no.2277-8160, Vol. 2, No. 5, May 2013.
[5] P. Mendis, T. Ngo, N. Haritos, A. Hira, B.
Samali, J. Cheung “Wind loading on tall buildings” Journal of science and engineering, Electronic journal of structural engineering special issue: loading on structures (2007).
[6] Ranjitha K. P, Khalid Nayaz Khan, Dr.
N.S.Kumar, Syed Ahamed Raza. “Effect of Wind Pressure on R.C Tall Buildings using gust Factor Method” Journal of engineering research and technology, ISSN:2278-0181, Vol. 3, No. 7, July 2014.
[7] Dr. B.Dean Kumar and Dr. B.L.P Swami
“Critical gust pressures on tall building frames- review of codal provisions” Journal of advanced technology in civil engineering, ISSN:2231-5721, Vol. 1, No.2, 2012.
[8] Yin Zhou, Ahsan Kareem and Ming Gu “Gust
loading factors for design application” Journal of structural
engineering, ASCE, Vol.127, No.2, pp.168-175.
[9] Achyut Khajuria, thesis report submitted to
“Thapar university on “Estimation of Wind Load on Tall Buildings”, 2006-2008
[10] Ryan Merrick and Girma Bitsuamlak “Shape
effects on the wind induced response on high rise buildings” Journal of Wind and Engineering, Vol. 6, No. 2, July 2009, pp. 1-18.
[11] ETABS nonlinear Version 13.1.1, Extended 3D analysis of the building systems, Computer and Structures.
[12] IS: 875-1987(Part 3) “Code of practices for design loads (other than earth quake) for buildings and structures”. Bureau of Indian standards, New Delhi
[13] An Explanatory handbook on “Indian
Standard Code Practice for Design Loads” (other than earthquake) for buildings and structures part 3 wind loads [IS 875 (Part 3): 1987]” , Bureau of Indian standards, New Delhi.
[14] An Explanatory handbook on “Proposed IS
875 (Part 3) wind loads on buildings and structures” by Dr. N. M. Bhandari, Dr. Prem Krishna, Dr. Krishen Kumar, Department of Civil engineering, Indian Institute of Technology, Roorkee and Dr. Abhay Gupta, Department of Civil engineering, Shri. G. S. Institute of Technology and Science, Indore.
BIOGRAPHIES
1. M. R. Wakchaure, Professor, Civil Engineering Department, Amrutvahini College Of Engineering, Sangamner, Maharashtra, India.
2. Sayali J. Gawali, Post Graduate Student, Civil Engineering Department, Amrutvahini College Of Engineering, Sangamner, Maharashtra, India.