_________________________________________________________ KEYWORDS
Watershed
Soil degradation
Soil properties
Soil evaluation
Benin
ABSTRACT
Soil degradation is a serious problem for people living in watersheds of Benin. This degradation is mainly due to poor farming practices and because of this poor management annual maize production reduced critically. This study was aimed to estimate the state of physical and chemical soil degradation of three watersheds of southern Benin. One reference site representing sacred forest was also chosen for comparing the results of watershed. Soil cores were also collected from these selected sites. Physical and chemical parameters were determined from the collected soil samples. Results of study revealed that the watershed soil is more compact and lower in nutrients than the soil of reference sites. The bulk soil density was significantly higher in Govié and Lokogba watersheds compared to their reference site. As a result of intensive farming and water erosion, root biomass of the soil has significantly decreased from 86 to 82% in Govié, 69 to 67% in Lokogba and 75 to 70% in Linsinlin. The total soil nitrogen of watershed declined significantly, from 33 to 24% in Govié, 32 to 30% in Lokogba and 38 to 25% in Linsinlin. Available soil phosphorus decreased from 10.93 ppm to 7.11 ppm in the Lokogba watershed. The soil phosphorus of Linsinlin watershed was reported highest from 5.5 ppm to 8.00 ppm compared to the reference site. The soil organic matter of watershed declined from 38 to 37% in Govié and 68 to 66% in Lokogba. Lokogba watershed is the most degraded one compared to three watersheds studied.
KOUELO ALLADASSI Félix
1*, HOUNGNANDAN Pascal
1, AZONTONDE Hessou Anastase
2,
BENMANSOUR Moncef
3, RABESIRANANA Naivo
4and MABIT Lionel
51
Laboratoire de Microbiologie des Sols et d’Ecologie Microbienne, Faculté des Sciences Agronomiques, Université d’Abomey-Calavi, 01 BP 526 R. P. Cotonou 2Laboratoire Sciences de Sol, Eau et Environnement, Institut National de Recherches Agricoles du Bénin (LSSEE/INRAB)
3Centre National de l’Energie, des Sciences et des Techniques Nucléaires (CNESTEN), Rabat, Maroc 4Institut National des Sciences et Technologies Nucléaires (INSTN), Antananarivo, Madagascar
5SWMCNS, Joint FAO/IAEA, Division of Nuclear Techniques in Food and Agriculture, Vienna – Seibersdorf. Received – October 05, 2015; Revision – November 04, 2015; Accepted – December 10, 2015
Available Online – December 15, 2015
DOI: http://dx.doi.org/10.18006/2015.3(6).529.540
ASSESSMENT OF THE LEVEL OF SOIL DEGRADATION IN THREE
WATERSHEDS AFFECTED BY INTENSIVE FARMING PRACTICES IN BENIN
E-mail: [email protected] (KOUELO ALLADASSI Félix)
Peer review under responsibility of Journal of Experimental Biology and Agricultural Sciences.
* Corresponding author
Journal of Experimental Biology and Agricultural Sciences, December - 2015; Volume – 3(6)
Journal of Experimental Biology and Agricultural Sciences
http://www.jebas.org
ISSN No. 2320 – 8694
Production and Hosting by Horizon Publisher (http://publisher.jebas.org/index.html). All rights reserved.
1 Introduction
Soil degradation is an important global problem because of its adverse impact on agricultural production, food security and the environment. Inadequate management of land, especially in areas with high population densities and fragile ecosystems, further increases the loss of productivity of farmers deprived of resources. This in turn affects their food security and living standards (FAO, 2003).The environmental degradation is a major problem that many countries face but the mechanisms involved in this degradation vary from country to country. In developed countries, the use of certain technologies and excessive consumerism leave behind volumes difficult to recycle waste. This phenomenon manifests itself in the South by over exploitation of wood resources and erosion of land each year led to the abandonment of seven million hectares and the disappearance often million hectares of tropical rainforests (Joseph, 2003; Amy, 2008).
In sub-Saharan Africa (SSA), agricultural production is subject to many uncertainties and constraints. The level of fertility is generally low (organic matter content less than 2% nitrogen). Population growth is also main constrain factor for the agriculture of the African savanna areas in SSA. Increasing scarcity of farmland in many cases leads to the abandonment of the long-term fallow (Dugué, 1998). The high density of the population in the area has resulted in pressure on the land. Surface sown by each household are decreasing (2 to 0.5 ha) due to the divisions of land at inheritance. Farmers are forced to exploit their land, use of fallow becoming rare and difficult. Sub-Saharan African countries are among those with the highest nutrient depletion rate (Stoorvogel & Smaling, 1990; Smaling, 1993; Smaling et al., 1997). According to the International Center for Soil Fertility and Agricultural Development (IFDC), Africa annually loses 8 million metric tons of soil nutrients and more than 95 million hectares of land have been degraded to the point significantly reduce productivity (Henao & Baanante, 2006). The environmental degradation evolves with bioclimatic conditions and human action. This soil degradation is particularly worrying. Development actors and researchers therefore cannot remain in different to this problem.
In watersheds of Benin, ecosystem degradation is a concern for the survival of populations whose number increases significantly from several years. Soil degradation is a considerable problem in Benin, because high rainfall intensities and low-input farming systems are prevalent. Soil degradation is aggravating due to a rapid expansion of cropland resulting from population growth including migration, lacking soil conservation activities and increased rainfall variability due to climate change (Hiepe, 2008). Due to so many problems, restore of the environment is a major challenge for the exchange and transmission of information must be of the best ways to encourage and support positive action. Aware of the increased degradation and the urgent need to reverse the process, a diagnostic study of the state of soil
degradation in three watersheds of southern Benin was undertaken to make proposals for their restoration. This study aims to evaluate the impact of farming practices on soil degradation. The study site is a cultivated soil, so under the effect of farming practices and the reference site is uncultivated soil, therefore without any influence of farming practices. The comparison of the state of their soil degradation through soil physical, chemical and biological properties will allow us to achieve the objectives of this study.
2 Materials and Methods
2.1 Experimental site
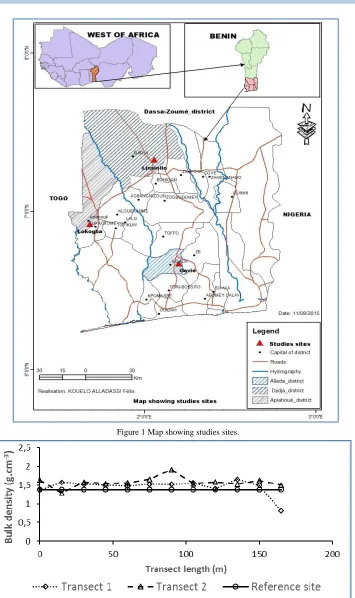
This study takes place in the districts of Allada (Latitude 6° 39' 52'’ North & Longitude 2° 9' 35'' East), Aplahoue (Latitude 6° 56' 32'’ North & Longitude1° 40' 25'' East) and Djidja (Latitude 7° 20' 46'’ North & Longitude 1° 56' 8'' East). Aplahoué and Djidja are located in the south-western Benin. This area is characterized by insecure tenure, land pressure and high irregularity in rainfall. Allada is located in the south of Benin, characterized by land pressure and low crop yields. In all the sea areas (Figure 1), soils are much degraded. Three watersheds i.e. Govié watershed in Allada, Lokogba watershed in Aplahoué and Linsinlin watershed in Djidja were selected from these three studies sites (one per site). From each watershed, a reference site was also chosen. The assumption is that the reference site may not be disturbed over at least 50 years.
The reference site is an uncultivated site for a long time, a site where no human or animal activity was performed. This site is nearby the study site (1 km in maximum) so both the site can share similar climatic and geological conditions. The comparison of these two sites allows us to study the effect of intensive farming practices on soil properties. This reference site is used as reference in the assessment of the rate of soil degradation in each watershed. The reference site in Lokogba is a sacred forest installed since 62 years. The reference site in Linsinlin is a natural forest near Couffo River under conservation more than 120 years by traditional religion. The reference site in Govié is a sacred forest established since 55 to 60 years.
2.2 Soil sampling
To estimate the soil degradation state in the three watersheds, in total 42 soil cores were collected from the Lokogba watershed. Among these 20 bulk cores and 1 sectioned core were collected from the transect 1 while 20 bulk cores and 1 sectioned core were collected on the transect 2 along the two parallel down slope transects. Similarly total 35 soil cores were collected from the Linsinlin watershed. Here also these soil cores were selected from the two parallel down slope transects i.e. 15 bulk cores and 1 sectioned core on transect 1, 18 bulk cores and 1 sectioned core on transect 2 were collected.
530 KOUELO et al
Figure 1 Map showing studies sites.
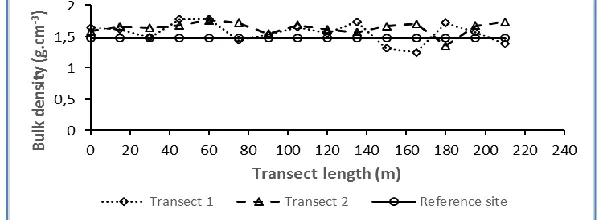
Figure 2 Effect of intensive farming practices on soil bulk density along two transects of Govié watershed.
Lowest numbers of soil cores (26) were collected from the Govié watershed. Among these, 12 bulk cores and 1 sectioned core were collected from the transect 1 while12 bulk cores and 1 sectioned core were collected from the transect two. 12 soil cores i.e. 10 bulk cores and 2 sectioned cores were collected in on the reference site of each study site. These soil samples were taken at a depth of 40 cm. For sectioned cores, samples are cut to 2 cm thickness from deep 0 to 20 cm, 4 cm from deep 20 to 40 cm. Thus, in a soil core, 15 samples were obtained. The cores in reference site were collected in a grid of 2 m x 2 m.
2.3 Soil Physical preparation
Each soil sample was air dried and oven dried at around 60°C for 48 hours and the weight of the dried sample was recorded (Mt). The sample was lightly ground or hand disaggregated and sieved through a 2 mm mesh to separate soil particles from the coarser rock fragments. The weights of the two fractions less and greater than 2 mm were recorded (Mf and Mc). The bulk density and porosity of the soil sample (fine fraction) were calculated by the formulas of Bulk density (g.cm-3) = Dry soil weight (g) / Soil volume (cm3) and Soil volume = 3.14 x r2 x h; h = depth of soil sampled. The biomass of the root available in each sample was also evaluated.
2.4 Chemical analysis of soil samples
For chemical analysis each soil sample was air dried and sieved through a 2 mm mesh. This sample was further taken for the chemical analysis and total soil nitrogen content was determined by Kjeldjal method (Jones et al., 1991) while the available form of P was estimated by Bray 1 method (Bray &
Kurtz, 1945) and total P was calculated by Duval method (Duval, 1962). Potassium content of these collected samples determined by atomic absorption method (Fishman & Downs, 1966) and soil organic matter content (SOM) measured by Walkley and Black method (Walkley & Black, 1934).
2.5Statistical analysis
T-test was performed with SAS version 9.2 software to compare physical and chemical characteristics of watershed transect soil to those of reference site. Average equality of two independent samples test was performed with the same software to compare the two transects soil characteristics.
3 Results
3.1 Soil bulk density and root biomass
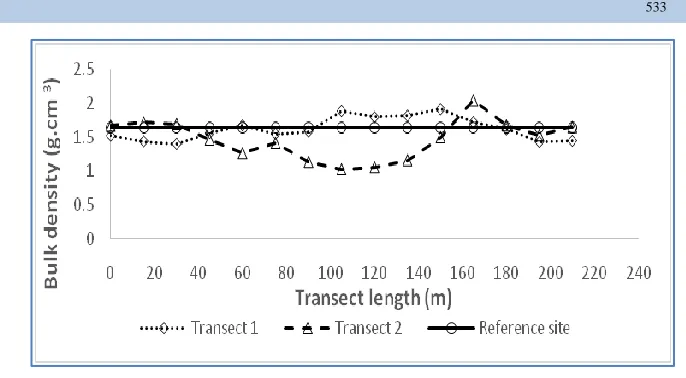
Bulk soil density and root biomass of the soil collected from Lokogba watershed suggested that along with the transect 1 and 2, the density of the soil is greater than the reference site and this stands for soil compaction due to overexploitation and tillage. These results are confirmed by the root biomass content of the soil which was reported very low along transect relative to the reference site. A significant difference was reported between soil bulk density of transect 2 and that of the reference site (p < 0.0001) while between thetransect 1 and the reference site, this difference was not reported significant at the 5% level (p = 0.062). Independent two samples T-test showed that the soil bulk density of the transect 1 is not different from that of the transect 2 (p = 0.136). Bulk density of the soil is same in the two transects (Figure 2 and 3).
Figure 3 Effect of intensive farming practices on soil root biomass along two transects of Govié watershed.
Figure 4 Effect of intensive farming practices on soil bulk density along two transects of Lokogba watershed.
532 KOUELO et al
Figure 5: Effect of intensivee farming practices on soil root biomass along two transects of Lokogba watershed.
Figure 6 Effect of intensive farming practices on soil bulk density along two transects of Linsinlin watershed.
Figure 7 Effect of intensive farming practices on soil root biomass along two transects of Linsinlin watershed.
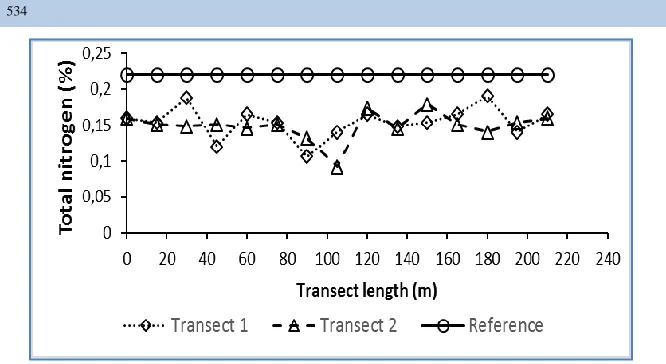
Figure 8 Effect of intensive farming practices on soil nitrogen content along two transects of Govié watershed.
Figure 9 Effect of intensive farming practices on soil nitrogen content along two transects of Lokogba watershed.
Figure 10 Effect of intensive farming practices on soil nitrogen content along two transects of Linsinlin watershed.
Figure 11 Effect of intensive farming practices on soil available P along two transects of Govié watershed.
Figure 12 Effect of intensive farming practices on soil available P along two transects of Lokogba watershed.
534 KOUELO et al
Figure 13 Effect of intensive farming practices on soil available P along two transects of Linsinlin watershed.
Figure 14 Effect of intensive farming practices on soil organic matter along two transects of Govié watershed.
Figure 15 Effect of intensive farming practices on soil organic matter along two transects of Lokogba watershed.
Figure 16 Effect of intensive farming practices on soil organic matter along two transects of Linsinlin watershed.
Similarly from the Linsinlin watershed, the density of the soil along transects was reported substantially equal to that from the reference site. But root biomass of soil along transect is lower than the reference site. This can be justified that this reducing biomass may be because of continuous cropping (Figure 4 and 5). There is nosignificant difference between soil bulk density of the two transects and it is p = 0.757 for transect1 and p = 0.059 for the transect 2. The two transects have a similar soil bulk density and root biomass because the probability of independent two-samples T-test a rep = 0.137and p = 0.284 respectively, so more than 5%. However, the root biomass of the soil both transects is significantly different from that of the reference site (p <0.0001).
At the Govié watershed the density of the soil of transect 1 is greater than the reference site which stands for soil compaction due to overexploitation and tillage. One-sample T-test showed that the soil bulk density of transect 2 is very significantly different from that of the reference site. At the transect 1, the difference is not significant at 5% level (p = 0.272). The root biomass content of the soil is very low along transects relative to the reference site. There was a very highly significant difference between the soil root biomass of both transects and that of the reference site (p < 0.0001). The soil bulk density and root biomass are the same at both transects from the independent two-samples T-test (p = 0.109 and p = 0.283 respectively). The study site Watershed Goviéis homogeneous from the soil bulk density point of view of and root biomass (Figure 6 and 7).
3.2 Soil chemicals properties
3.2.1 Soil acidity
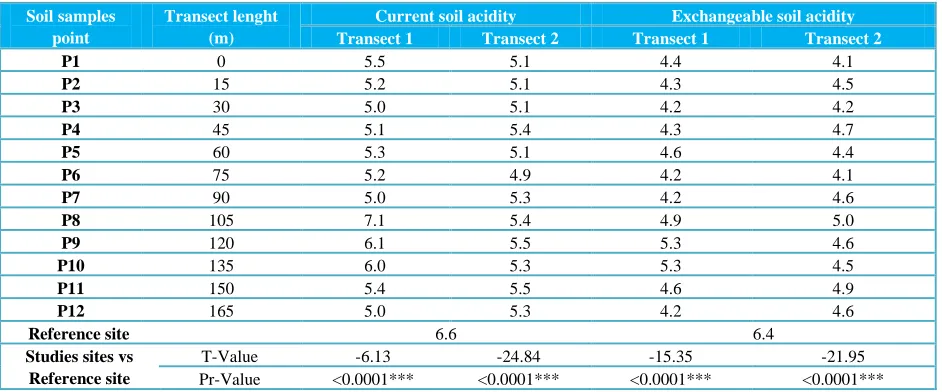
The reference site of the village Goviéis is characterized by neutral soil reaction (pH = 6.57) while the soil samples collected from the watershed are acidic in nature. This difference in soil acidity is significant at the 0.1% level (p < 0.0001) at both transects. The difference between the current acidity and exchangeable acidity shows that the watershed soil has an average acidification potential. Unlike Govié’s village, soil of reference site and soil of watershed in Lokogba and Linsinlin villages are low acid.
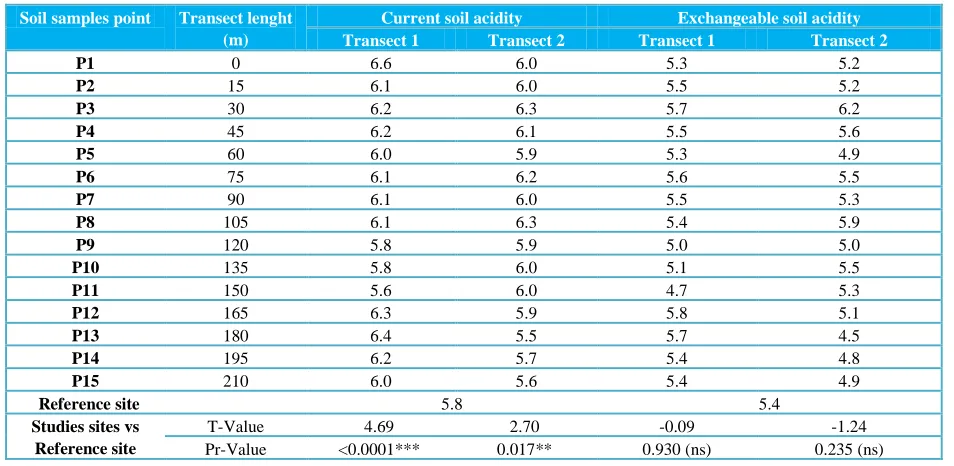
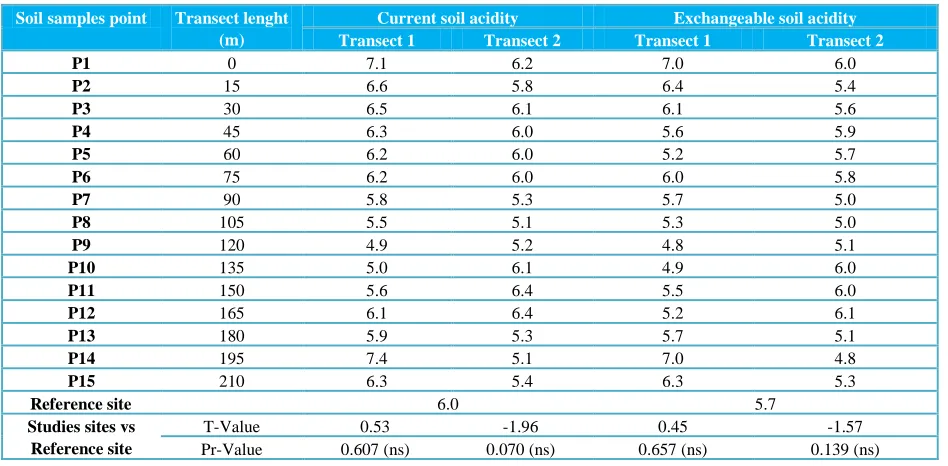
However, the t-test showed a significant difference of current soil acidity at the 5% level between the reference site and the Lokogba watershed. On this watershed, no significant difference was reported in the potential acidity. In the village of Linsinlin, there is no significant difference between the current and potential acidity of the reference site and the watershed. The potential for soil acidification in Lokogba watershed is average. However, this potential is low in the village of Linsinlin because the difference pHH2O - pHKCl is below 0.5 (Table1, 2 and 3).
3.2.2 Soil nitrogen content
Reference sites of the three watersheds are rich in nitrogen and this content varies between 0.15 and 0.25% depending on the interpretation standards (Calvet & Villemin, 1986). In case of watershed, the soil of Govié watersheds are rich in nitrogen at both transects and it is superior than the soil of reference site (Figure 8).This difference between the soil nitrogen content of the reference site and watershed is significant at the 0.1% level (p < 0.0001).
Table 1 Effect of intensive farming practices on soil acidity along two transects of Govié watershed.
Soil samples point
Transect lenght (m)
Current soil acidity Exchangeable soil acidity
Transect 1 Transect 2 Transect 1 Transect 2
P1 0 5.5 5.1 4.4 4.1
P2 15 5.2 5.1 4.3 4.5
P3 30 5.0 5.1 4.2 4.2
P4 45 5.1 5.4 4.3 4.7
P5 60 5.3 5.1 4.6 4.4
P6 75 5.2 4.9 4.2 4.1
P7 90 5.0 5.3 4.2 4.6
P8 105 7.1 5.4 4.9 5.0
P9 120 6.1 5.5 5.3 4.6
P10 135 6.0 5.3 5.3 4.5
P11 150 5.4 5.5 4.6 4.9
P12 165 5.0 5.3 4.2 4.6
Reference site 6.6 6.4
Studies sites vs Reference site
T-Value -6.13 -24.84 -15.35 -21.95
Pr-Value <0.0001*** <0.0001*** <0.0001*** <0.0001***
536 KOUELO et al
Table 2 Effect of intensive farming practices on soil acidity along two transects of Lokogba watershed
Soil samples point Transect lenght (m)
Current soil acidity Exchangeable soil acidity
Transect 1 Transect 2 Transect 1 Transect 2
P1 0 6.6 6.0 5.3 5.2
P2 15 6.1 6.0 5.5 5.2
P3 30 6.2 6.3 5.7 6.2
P4 45 6.2 6.1 5.5 5.6
P5 60 6.0 5.9 5.3 4.9
P6 75 6.1 6.2 5.6 5.5
P7 90 6.1 6.0 5.5 5.3
P8 105 6.1 6.3 5.4 5.9
P9 120 5.8 5.9 5.0 5.0
P10 135 5.8 6.0 5.1 5.5
P11 150 5.6 6.0 4.7 5.3
P12 165 6.3 5.9 5.8 5.1
P13 180 6.4 5.5 5.7 4.5
P14 195 6.2 5.7 5.4 4.8
P15 210 6.0 5.6 5.4 4.9
Reference site 5.8 5.4
Studies sites vs Reference site
T-Value 4.69 2.70 -0.09 -1.24
Pr-Value <0.0001*** 0.017** 0.930 (ns) 0.235 (ns)
The soil of Lokogba watershed is not rich in nitrogen unlike the reference site (Figure 9).The t-test showed that the nitrogen content of the soil of Lokogba watershed is significantly different from the reference site at 0.1% level (p < 0.0001). These results are similar to those obtained on the Linsinlin watershed where the soil is very rich in nitrogen as well (Figure 10).
3.2.3 Soil phosphorus content
Soil of the Govié watershed (Figure 11) have very low phosphorus availability in the two transects and the reference site (P2O5 < 40 ppm). The t-test showed no significant difference between the available phosphorus content of the soil of the watershed and the reference site (p = 0.8415). Phosphorus availability for the crop is 4.43% on the reference site while it 4.38% to 4.56% in the two transect of watershed respectively. The soil of this watershed therefore has a problem in phosphorus solubilization and soil has an available phosphorus deficiency. In the Lokogba watershed, reference site and watershed soil are also very low in available phosphorus (Figure12) but the available phosphorus content of the reference site was higher (10.93 ppm) than the watershed and phosphorus level was 7.92 ppm for the transect 1 and 7.11 ppm for the transect 2. There is a significant difference between the content of available phosphorus on reference site and the watershed at 0.1% level. The one sample t-test showed that the two transects have almost similar available phosphorus content. Similarly, the availability of phosphorus in the Lokogba watershed soil (Available P / Total P) was also very low and it was 10.56% for the reference site and 10.40 to 11.08% in the watershed. The soil of Lokogba’s village has
also a phosphorus retrogradation problem, but not as much as the soil of Govié. The results are similar at the Linsinlin watershed where phosphorus availability varies from 8.47% to 11.16% on the watershed against 8.79% in the reference site (Figure 13). The three sites are very low in available phosphorus for the crop. The ratio Nt/Pt (Total nitrogen / Total P) is higher than 4 at all sites and then shows an imbalance between phosphate and nitrate supplies (Boyer, 1982).
3.2.4 Soil organic matter
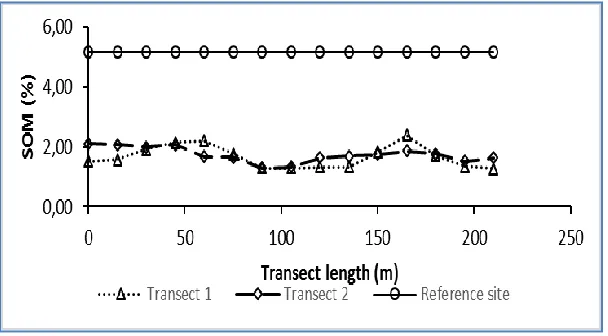
Reference sites of Lokogba and Govié had higher Soil Organic Matter (SOM) than the Linsinlin. The soil organic matter is lower in all studied sites than in reference sites. The soil organic matter content of the Govié and Lokogba watersheds is significantly different from that of their reference site at 0.1% level. But the difference is not significant at the Linsinlin watershed. The three watersheds have different behaviors towards the decomposition of soil organic matter. Compared to the reference site, decomposition of soil organic matter is fast in Linsinlin (C:N<8), normal in Govié (8 <C:N <12) and poor in Lokogba (C:N> 12) . In watershed, the decomposition of soil organic matter is fast in Govié and Lokogba, normal on the transect 2 in Linsinlin watershed but bad on the transect 1 of the site. This poor decomposition of soil organic matter on the transect 1 in Linsinlin watershed is due to the presence of several concave sampling points on this transect. In these concave points are cumulated soil fine particles, plant residues and water, resulting from water erosion, reducing the biological activity of the soil and organic matter leading to low humification (Figure 14, 15 and 16).
4 Discussions
4.1 Bulk density and root biomass content
Bulk density is an indicator of soil compaction. It is used to express soil physical, chemical and biological measurements on a volumetric basis for soil quality assessment and comparisons between management systems. High bulk density is an indicator of low soil porosity and high soil compaction (Arshad et al., 1996). The soil the study sites has a higher bulk density than that of the reference sites. So under the effect of farming practices, soil becomes compact, an indicator of soil degradation. Compaction can result in shallow plant rooting and poor plant growth, influencing crop yield and reducing vegetative cover available to protect soil from erosion. Agricultural activities significantly influence the bulk density in the horizons A of cultivated soils (Brady & Weil, 2002).
The high value of bulk density at watershed compared to forests (reference site) reflects the effects of repeated brush fires and bare with no plant protection updates after deforestation and generally absence of any input of organic matter on this land use (Boyer, 1982; Segalen, 1995). This leads to intense erosion due to heavy rainfall in the tropics and soil can quickly present a compacted horizon at shallow depth that limits and restricts rooting, water supply and minerals absorption (Alongo et al., 2013). Low bulk density values in the forest (reference site) are due to the process of humification
and decomposition of organic matter occurring initially in the upper soil horizons and root biomass development (Boa, 1990; Harmand & Nutti, 1998).
4.2 Soil acidity
Soil acidity is an indication of the general soil level equivalent chemical elements. Soil acidity is in direct relation with the exchangeable cations and anions (Brady & Weil, 2008). Soil acidification is a natural process and is generally accelerated by agriculture. The rate of acidification varies enormously depending on the soil type, land use, productivity and management of the farming system (Moore, 2001).The acidification is a natural phenomenon which born with pedogenesis and higher in humid tropical climates, also caused by the cultivation and the gradual deterioration in entire regions studied including alternate climate (Dabin, 1985).
Clearing and intensification of agriculture contributes to soil acidification. There is regular soil impoverishment with culture. Many experiments have been made in various areas, especially in alternate climates on ferralitic soil. These experiments showed that the soil is gradually depleted from the forest to the cultivation (Siban, 1972). Fauck (1956) indicates a reduction in pH from 0.15 to 0.20 units per year after clearing and in 6 years of cultivation, the pH is evolved from 6.5 to 5. There is almost no study on soil acidity along transects watershed.
Table 3 Effect of intensive farming practices on soil acidity along two transects of Lokogba watershed
Soil samples point Transect lenght (m)
Current soil acidity Exchangeable soil acidity
Transect 1 Transect 2 Transect 1 Transect 2
P1 0 7.1 6.2 7.0 6.0
P2 15 6.6 5.8 6.4 5.4
P3 30 6.5 6.1 6.1 5.6
P4 45 6.3 6.0 5.6 5.9
P5 60 6.2 6.0 5.2 5.7
P6 75 6.2 6.0 6.0 5.8
P7 90 5.8 5.3 5.7 5.0
P8 105 5.5 5.1 5.3 5.0
P9 120 4.9 5.2 4.8 5.1
P10 135 5.0 6.1 4.9 6.0
P11 150 5.6 6.4 5.5 6.0
P12 165 6.1 6.4 5.2 6.1
P13 180 5.9 5.3 5.7 5.1
P14 195 7.4 5.1 7.0 4.8
P15 210 6.3 5.4 6.3 5.3
Reference site 6.0 5.7
Studies sites vs Reference site
T-Value 0.53 -1.96 0.45 -1.57
Pr-Value 0.607 (ns) 0.070 (ns) 0.657 (ns) 0.139 (ns)
538 KOUELO et al
4.3 Soil nitrogen content, available phosphorus and organic matter
Soil organic matter, nutrients and soil structure are the main factors influencing soil fertility. Many of African countries soils are heavily depleted of nutrients, and soil organic matter is below 1.0% or even 0.5% in the top soil (Bot &Benites, 2005). The reason for a decline in SOM and the closely linked nutrient content is simply that the biomass and nutrient cycle is not sustained; meaning more material in the form of soil organic matter and / or nutrients (especially the macro-nutrients of nitrogen, phosphorous and potassium) leaves the system than is replenished. This results from removal of crop products and residues (plant biomass), loss through soil erosion, leaching of nutrients (below the rooting depth), volatisation of nutrients (e.g. nitrogen) and accelerated mineralization of SOM through tillage (FAO, 2011).
Nitrogen losses to other compartments of the ecosystem are related to its runoff in to the river, leaching, absorption by plants, organization by the microflora, biological denitrification and its volatilization from the soil (KauarkLeite, 1990). The low organic matter, nitrogen and available phosphorus in the watershed soil compared to the reference site, is due to farming activities and especially to water erosion. Water erosion of soils, it is not just the land that goes into the river. It carries with it many other nutrients. Nitrogen is highly soluble in water, can be found easily in runoff into streams or groundwater through leaching. Phosphorus mainly associated with soil particles is found in the river runoff (COGEBY, 2004). Organic matters are light enough, are transported by runoff.
Dautrebande et al. (2006) reported that the add to the loss of land out of watersheds associated starting nutrients (nitrogen, phosphorus) of organic matter dissolved in runoff water or attached to soil particles them- same. The organic material is transported either by surface runoff or as individual particulate form or attached to soil mineral particles (TBE, 2005). These departures thus explain the deficit of watershed soil in nutrients and organic matter.
Conclusion
Watersheds are very sensitive to degradation. With intensive farming practices, soils of these watersheds are degraded further. The results of this study confirm this assertion. Compared to nearby reference sites (undisturbed forest), the soil of studies watersheds is more compact (high bulk density) and has a very low total nitrogen, available phosphorus, organic matter and root biomass. To combat soil degradation of these watersheds, it will promote farming practices that preserve the physical, chemical and biological soil. This is necessary to improve crop productivity and food security of the population living in these watersheds.
Acknowledgments
We are grateful the International Atomic Energy Agency (IAEA), which, through the Regional Project RAF5063, made available to our laboratory the equipment used in this study.
Conflict of interest
Authors would hereby like to declare that there is no conflict of interests that could possibly arise.
References
Alongo S, Visser M, Drouet T, Kombele F, Colinet G, Btogaer J (2013) Effets de la fragmentation des forêts par l’agriculture itinérante sur la dégradation de quelques propriétés physiques d’un Ferralsol échantillonné à Yangambi, R.D. Congo. TROPICULTURA 31 : 36-43.
Amy A (2008) Diagnostic de la degradation du bassin versant de la rivière Marmelade en vue de son aménagement. Thèsed’IngénieurAgronome. UEH/FAMV, Damien, Haïti,Pp 71.
Arshad MA, Lowery B, Grossman B (1996) Physical Tests for Monitoring Soil Quality. In: Doran JW, Jones AJ (Eds). Methods for assessing soil quality. Madison, WI. Pp 123-41.
Boa D (1990) Caractéristiques morphologiques des gravillons ferrugineux sur le bassin versant de Boro Borotou. Agronomie Africaine 2 :83-94.
Bot A, Benites J (2005) The importance of soil organic matter. Key to drought-resistant soil and sustained food production. Bulletin FAO n° 80. A consulter sur http://www.fao.org/docrep/009/a0100e/a0100e00.htm
Boyer J (1982) Les sols ferrallitiques: facteurs de fertilité et utilisation des sols. Paris: ORSTOM édit. Tome X, 3e trimestre, Pp. 384.
Brady NC, Weil R (2002)The nature and properties of soils. 13th ed. Upper Saddle River, Pearson Education Inc, NJ, USA.
Brady NC, Weil R (2008) The Nature and Properties of Soils, 14 ed. Pearson-Prentice Hall, Upper Saddle River, NJ. Pp. 990.
Bray RH, Kurtz LT (1945) Determination of total, organic and available forms of phosphorus in soils. Soil Science 59: 39 – 45.
Calvet G, Villemin P (1986) Interprétation des analyses de terre. Ed, SCPA., pp-24.
COGEBY (2004) La lutte contre l’érosion, tout le monde y gagne, Pp. 4.
Dabin B (1985) Les sols tropicaux acides. Cahiers ORSTOM, série Pédologie, vol. XXI, no 1, 7-19
Dautrebande S, Cordonnier H, Thirion M, Bielders CH (2006) Lutter contre l’’érosion des terres. Livret de l’Agriculture n° 12 : Pp 41.
Dugué P (1998) Gestion de la fertilité et stratégies paysannes. Le cas des zones de savanes d'Afrique de l'Ouest et du Centre. Agriculture et développement 18 : 13-20.
Duval L (1962) Dosage céruléomolybdique de l’acide phosphorique dans les sols, les végétaux et les engrais. Annales Agronomiques 469-482.
FAO (2011) Produire plus avec moins. Guide à l’intention des décideurs sur l’intensification durable de l’agriculture paysanne, Rome, Pp 101.
FAO (2003) Gestion de la fertilité des sols pour la sécurité alimentaire en Afrique subsaharienne. FAO. 63p En ligne
available on
ftp://ftp.fao.org/docrep/fao/006/x9681f/x9681f00.pdf access on August 25, 2015.
Fauck R (1956) L’évolution du sol sous culture mécanisée, le problème du pH et sa correction. VI Congres International de la Science du Sol. Paris 1956, Commissions IV et VI.
Fishman MJ, Downs SC (1966) Method for analysis of selected metals in water by atomic absorption: U.S. Geological Survey Water-Supply Paper 1540-C, p. 36-38.
Harmand JM, Nutti CF (1998) Effets de jachères agroforestières sur les propriétés d’un sol ferrugineux et sur la production céréalière. In: Agriculture et Développement n° 18 - Juin 1998.
Henao J, Baanante CA (2006) Agricultural Production and SoilNutrientMining in Africa. Summary of IFDC Technical Bulletin, IFDC, Muscle Shoals, Alabama, USA.
Hiepe C (2008) Erosion Modelling in the Upper Ouémé Catchment - Status quo. In: Judex M, Thamm HP (Eds.) (2008): IMPETUS Atlas Benin. Research Results 2000 – 2007. 3rd edition. Department of Geography, University of Bonn, Germany, Pp: 69 – 70.
Jones Jr JB, Wolf B, Mills HA (1991) Methods of Elemental Analysis (Chapter 4) pp27-38. In: Plant Analysis Handbook. Micro-Macro Publishing, Inc. 183 Paradise Blvd., Suite 108, Athens, Georgia.
Joseph FR (2003) Diagnostic de la dégradation du bassin versant de la rivière de Fonds-Verrettes en vue de son aménagement. Mémoire de fin d'études agronomiques, UEH/FAMV, Damien, Haïti, Pp. 49.
KauarkLeite LA (1990) Réflexions sur l'utilité des modèles mathématiques dans la gestion de la pollution diffuse d'origine agricole, Thèse, Ecole Nationale des Ponts et Chaussées Pp. 342.
Moore G (2001) Soil guide: A handbook for understanding and managing agricultural soils, Bulletin 4343. The National Library of Australia, Cataloguing-in-Publication entry, Pp. 388.
Segalen P (1995) Les sols ferrallitiques et leur répartition géographique. Les sols ferrallitiques en Afrique et en Extrême-Orient, Australie et Océanie: conclusions générales. Paris: édit. ORSTOM, tome III, Pp. 201.
Siban P (1972) Etude de l’évolution des sols sous culture traditionnelle en haute Casamance. Principauxrésultats. AgronomieTropicale27 5: 574-591.
Smaling EMA, Nandwa SM, Janssen BH (1997) Soil fertility is at stakeIn:Buresh RJ, Sanchez PA, Calhoun F (Eds) Replenishing Soil Fertility in Africa, SSSA Special Publication Number 51, Soil Sciences Society of America, America Society of Agronomy, adison, Wisconsin, Pp47 – 61.
Smaling EMA (1993) An Agroecological Framework for Integrated Nutrient Management. Ph.D. Thesis submitted to the Wageningen Agricultural University, Wageningen (Pays-Bas).
Stoorvogel JJ, Smaling EMA (1990) Assessment of nutrient depletion in sub-saharan Africa: 1983- 2000. Vol. III. Literature review and description of land use systems. 2nd Ed., Report No.28, the Winand Starting Centre for Integrated Land. Soil and Water Research, Wageningen, The Netherlands.
TBE (2005) Confère les références « cellule Etat de l’environnement Wallon : Tableau de bord de l’Environnement Wallon » Ed. MRW-DGRNE
Walkley A, Black IA (1934) An examination of Degtjareff method for determining soil organic matter and a proposed modification of the chromic acid titration method. Soil Science 37: 29-37.
540 KOUELO et al