R E S E A R C H A R T I C L E
Open Access
Estimation of gestational age in early pregnancy
from crown-rump length when gestational age
range is truncated: the case study of the
INTERGROWTH-21
st
Project
Eric O Ohuma
1,2*, Aris T Papageorghiou
1, Jose Villar
1and Douglas G Altman
2Abstract
Background:Fetal ultrasound scanning is considered vital for routine antenatal care with first trimester scans recommended for accurate estimation of gestational age (GA). A reliable estimate of gestational age is key
information underpinning clinical care and allows estimation of expected date of delivery. Fetal crown-rump length (CRL) is recommended over last menstrual period for estimating GA when measured in early pregnancy i.e.
9+0-13+6weeks.
Methods:The INTERGROWTH-21stProject is the largest prospective study to collect data on CRL in geographically diverse populations and with a high level of quality control measures in place. We aim to develop a new gestational
age estimation equation based on the crown-rump length (CRL) from women recruited between 9+0-13+6weeks. The
main statistical challenge is modelling data when the outcome variable (GA) is truncated at both ends, i.e. at 9 and 14 weeks.
We explored three alternative statistical approaches to overcome the truncation of GA. To evaluate these strategies we
generated a data set with no truncation of GA that was similar to the INTERGROWTH-21stProject CRL data, which we
used to explore the performance of different methods of analysis of these data when we imposed truncation at 9 and 14 weeks of gestation. These 3 methods were first tested in a simulation based study using a previously published dating equation by Verburg et al. and evaluated how well each of them performed in relation to the model from which the data were generated. After evaluating the 3 approaches using simulated data based on the Verburg equations, the
best approach will be applied to the INTERGROWTH-21stProject data to estimate GA from CRL.
Results:Results of these rather“ad hoc”statistical methods correspond very closely to the“real data”for Verburg,
a data set that is similar to the INTERGROWTH-21stproject CRL data set.
Conclusions:We are confident that we can use these approaches to get reliable estimates based on INTERGROWTH-21st Project CRL data. These approaches may be a solution to other truncation problems involving similar data though their application to other settings would need to be evaluated.
Keywords:Truncation, INTERGROWTH-21stproject, Crown-rump length, Gestational age, Simulation, Extrapolation, Restriction, Inversion
* Correspondence:[email protected] 1
Nuffield Department of Obstetrics & Gynaecology and Oxford Maternal & Perinatal Health Institute (OMPHI), Green Templeton College, University of Oxford, Level 3 Women's Centre, John Radcliffe Hospital, Headington, Oxford OX3 9DU, UK
2
Centre for Statistics in Medicine, University of Oxford, Botnar Research Centre, Windmill Road, Oxford OX3 7LD, UK
Background
Fetal ultrasound scanning is considered an essential part of routine antenatal care with first trimester scans rec-ommended for confirming viability, accurate estimation of gestational age and determining the number of fetuses [1,2]. Fetal crown-rump length (CRL) is measured in early pregnancy primarily to determine the gestation
age (GA) of a fetus and is most reliable between 9+0
to 13+6 weeks’ gestation, but not beyond [3].
Assess-ment of gestational age based on ultrasound (US) bi-ometry was first introduced in 1969 by Campbell [4], and it has become the preferred method for dating pregnancy.
A reliable estimate of gestational age is key informa-tion as it underpins clinical care and allows estimainforma-tion of the expected date of delivery. There are 3 ways to es-timate gestational age early in pregnancy: a) based on a reliable first day of the last menstrual period (LMP)
alone; b) based on an early (9+0 to 13+6 weeks)
ultra-sound alone, or c) LMP and ultraultra-sound combined. Use of LMP is based on the assumption that pregnancy has a constant duration from the first day of the LMP with
ovulation on the 14th day [3]. This method of dating
pregnancies, even for women whose menstrual history is certain, has been shown to be unreliable [5,6]. Caution is recommended regarding use of last menstrual period (LMP) alone for dating because up to 50% of women are uncertain of their dates, have an irregular cycle, have re-cently stopped the oral contraceptive pill, are lactating or did not have a normal last menstrual period [7].
The National Institute for Health and Care Excellence (NICE) Guideline for Routine Antenatal Care (2008) and International Society of Ultrasound in Obstetrics and Gynaecology (ISUOG) recommend that all pregnant women should be offered an early US examination to date pregnancies [1,7,8]. It is stated that ideally this should be performed by the measurement of CRL
be-tween 10 and 13+6weeks which can reduce the need for
induction of labour after 41 weeks of gestation. Al-though there is always a margin of error in US-based es-timation [9], this error is relatively small compared to LMP-based estimations [8,10].
Many dating charts are now in use though developed from different populations resulting in discrepancies when compared or applied to a specified population hence there is a need for an international reference dating equation
and chart [11-15]. The INTERGROWTH-21stProject,
de-scribed below, aims to generate fetal growth charts and also a new dating chart. In the study gestational age is based on the first day of LMP and corroborated by CRL using a known dating equation [16]. Therefore, only
women between 9+0-13+6 weeks gestation whose
estima-tion by both methods agreed within 7 days were recruited into the fetal growth longitudinal study.
To develop charts of fetal size we need to model CRL as a function of GA while for dating we interchange the variables and model GA as a function of CRL. This latter analysis is problematic if the available data are con-strained by a restricted range of GA [17]; such a restric-tion is commonly in place, as fetal curling prevents
accurate measurement beyond 13+6weeks. In this paper
we describe an exploration of strategies to overcome truncation of GA when developing equations and charts for dating pregnancies from CRL measurements.
Methods
The International Fetal and Newborn Growth Consortium
for the 21st Century (INTERGROWTH-21st) is a
large-scale, population-based, multi-centre project involving health institutions from eight geographically diverse countries (i.e. Brazil, China, India, Oman, Kenya, UK, USA and Italy), which aims to assess fetal, newborn and preterm growth under optimal conditions, in a manner similar to that adopted by the WHO Multicentre Growth Reference Study [18]. This approach is important in the creation of fetal growth standards by selecting
women regarded as “healthy”, educated, affluent and
living in areas with minimal environmental constraints on growth [19].
The INTERGROWTH-21st Project has three major
components, which were designed to create: 1) Longitu-dinally derived, prescriptive, international, fetal growth standards using both clinical and ultrasound measures; 2) Preterm, postnatal growth standards for those infants
born≥26+0 but <37+0weeks of gestation in the
longitu-dinal cohort, and 3) Birth weight, newborn length, and head circumference for gestational age standards derived from all newborns delivering at the study sites over an approximately 12 month period [19]. To ensure that ultrasound measurements are accurate and repro-ducible, centres adopted uniform methods, used iden-tical ultrasound equipment in all the study sites; adopted standardised methodology to take fetal measurements, and employed locally accredited ultra-sonographers who underwent standardisation training and monitoring.
One aim of the longitudinal study of the
INTERGROWTH-21stProject is to develop a new gestational age estimation
equation based on the crown-rump length (CRL) from
women recruited between 9+0-13+6weeks. This will be the
largest prospective study to collect data on CRL in geo-graphically diverse populations, and with a high level of quality control measures in place.
INTERGROWTH-21st data to develop centiles for the distribution of GA for CRL values between 15 mm and 100 mm. The statistical challenge is this: How can we model data when the outcome variable (GA) is truncated at both ends, i.e. at 9 and 14 weeks, given the need to obtain estimates in the trun-cated regions? This restriction is part of the design of
the INTERGROWTH-21st study based on the fact
that CRL measurements are less reliable outside this range of GA [1,7,23-25].
Ignoring the truncation of GA would lead to seriously biased estimates. We explored three alternative statistical approaches to overcome the truncation of GA. To evaluate these strategies we generated a data set with no truncation of GA that was similar to the
INTERGROWTH-21st Project CRL data, which we used to explore the
performance of different methods of analysis of these data when we imposed truncation at 9 and 14 weeks of gestation. The choice of which approach is best is hard to justify through formal statistical testing, and is likely to depend on the specific data being analysed.
Statistical methods
Data were explored visually by a scatter plot of CRL by GA and vice versa. The relationship between GA and CRL is non-linear though the distribution of CRL is ditionally normal at any given gestational age. By con-trast GA has a positively skewed distribution for a given CRL [17]. We applied fractional polynomial (FP) models (which are very flexible) to the data by fitting separate models to the mean and standard deviation (SD) of GA to account for increase in variance with greater CRL and gestation [20,22]. Using equations of the mean and standard deviation one can easily compute any desired centiles using the relation
Pthcentile¼Median CRLþKSD
whereKis the normal equivalent deviate (z score)
corre-sponding to a particular centile, e.g.K= 1.88 for the 97th
centile and −1.88 for the 3rd centile, and the SD in this
equation are the predicted estimates from the regression
analysis. Fitted curves (3rd, 50th, and 97th centiles) from
different models were assessed visually for a good fit and by comparing the deviances from each model. The choice of centiles presented was purely based on what is commonly reported in the literature and also used in clinical practice as standard centiles. In addition; the
INTERGROWTH-21st Project aims to complement the
WHO-Multi-centre Growth Reference Study (MGRS) which produced reference standards for children aged
0-5 years where they also presented the 3rd and 97th
centiles [18]. Goodness of fit was assessed by a scat-ter plot of the distribution of residuals in z scores by
CRL and also by counting the number of observations
below the 3rd and above the 97th centiles.
We explored three approaches to deal with truncation of gestational age at 9 and 14 weeks by (a) Simulation, Restriction and Extrapolation (b) Simulation (c) Inversion of model for predicting CRL from GA. Extrapolation was applied purely for the purposes of obtaining reliable esti-mates between 9 and 14 weeks in the presence of trunca-tion at 9 weeks and 14 weeks. The resultant equatrunca-tion will not be used for dating beyond 14 weeks as this is not rec-ommended in clinical practice. The reliability of fractional polynomial models for extrapolation has been discussed previously by Royston & Altman where they show that fractional polynomial models extrapolate well at least for fetal measurements [22]. These 3 methods were first tested in a simulation based study using a previously pub-lished dating equation by Verburg et al. [2]. We evaluated how well each of the 3 approaches performed in relation to the model from which the data were generated.
The Verburg equation was selected from the many dating equations in use as it is one of the five preferred dating equations according to a recent systematic review of the methodology used for creating dating charts [13]; it is also recommended by the International Society of Ultrasound in Obstetrics and Gynaecology (ISUOG) [1,13]. The great strength of performing a simulation study based on a known dating equation is that it allows us to evaluate how well our proposed methods of dealing with truncation perform in a situation where we know the “truth”(i.e. the equations from which simulated data were obtained). After evaluating the 3 approaches using simu-lated data based on the Verburg equations, the best
approach will be applied to the INTERGROWTH-21st
Project data to estimate GA from CRL.
Data were simulated from Verburg’s dating equa-tions [2]:
Mean of log GA¼1:4653þ0:001737CRL
þ0:2313log CRL
SD of log GA¼0:04590
Here and throughout all logarithms are natural logarithms.
These equations assume that log GA has a normal dis-tribution for any value of CRL. From these equations we simulated 100 observations for each CRL value from 5 mm and 110 mm in 1 mm increments, resulting in 10,600 observations in total. A sample size of 100 was chosen as it represented the average number of CRL
ob-servations for each GA in the INTERGROWTH-21st
obtained. We log transformed GA in all analyses to sta-bilise variance [2,15,20,26].
Validation of the simulated data
We modelled the simulated data using fractional polyno-mial regression of log transformed GA on CRL and compared the fractional polynomial (FP) terms and the predicted median GA from the equation obtained to the original dating equation reported by Verburg et al. The equations obtained from simulated data were remarkably similar to Verburg’s original equations:
Mean of log GA¼1:4612þ0:001693CRL
þ0:2332log CRL
SD of log GA¼0:0458114−0:00000198CRL
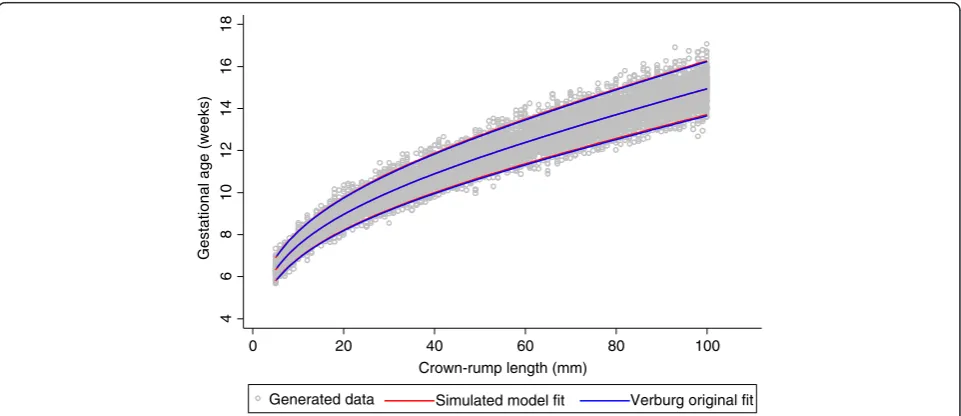
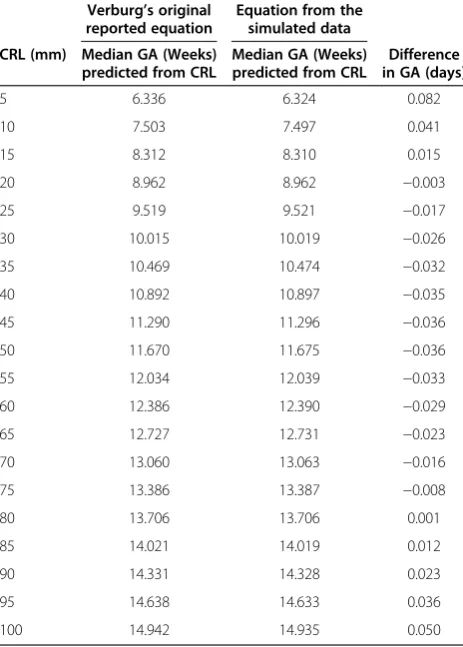
Both equations for the median were FP models of de-gree 2 with powers 0 and 1 (i.e. terms in CRL and log CRL). The equation for SD was a FP model of degree 1, power 1 (linear), compared to the SD obtained by Verburg which was a constant. The predicted GA from the two equations agreed within 0.08 days (Figure 1, Table 1).
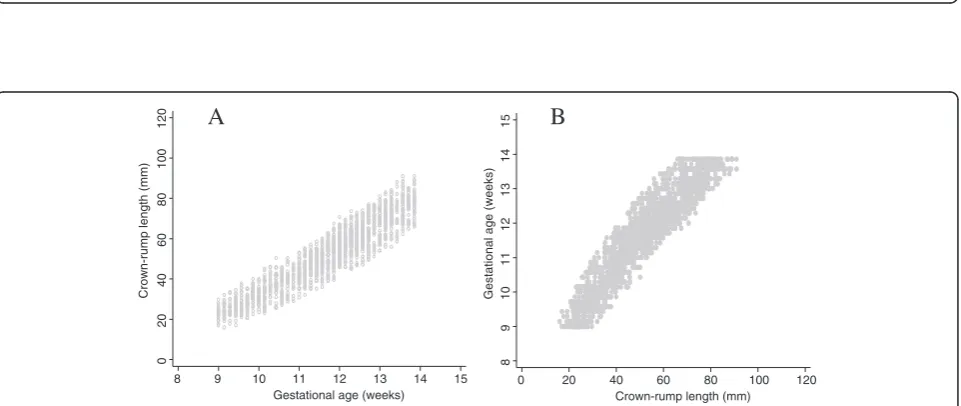
After successful validation of the simulated data we truncated gestational age at 9 and 14 weeks to match
the INTERGROWTH 21st data set. We note that
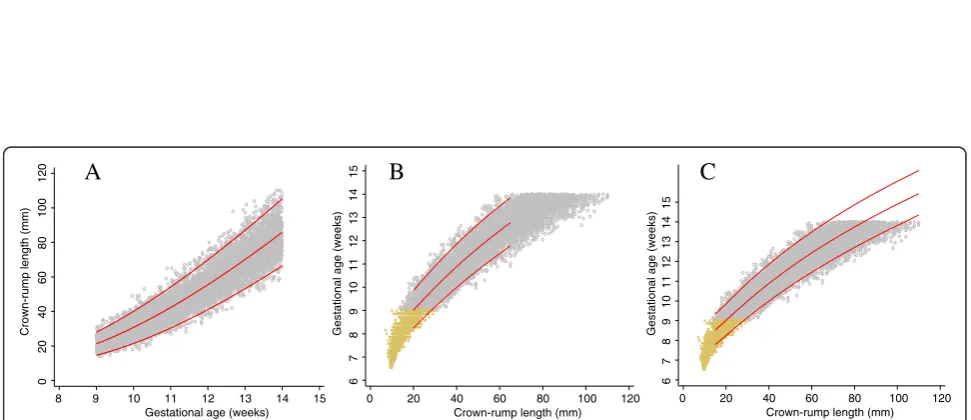
trun-cation is only a problem when we want to model GA as a function of CRL and not CRL as a function of GA (size chart) (Figure 2, panel A). All three sug-gested approaches make use of this fact, but in differ-ent ways.
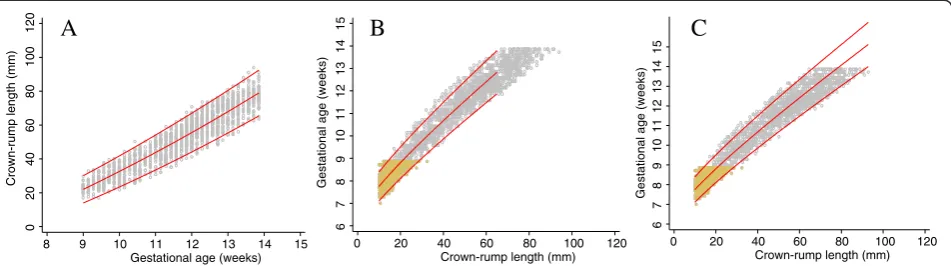
We applied the three proposed approaches to the trun-cated simulated data shown in Figure 2. Figure 3 shows a flow diagram summarising all the three methods.
Approach 1-simulation for small crown-rump length, restriction and extrapolation
The first approach is based on first modelling CRL as a function of GA (Figure 4, panel A). From the obtained equation of the median GA, we simulate 100 CRL obser-vations (about the same number of obserobser-vations for each day of GA in the un-truncated data set) for each day of gestation between 7 and 9 weeks, to overcome the trun-cation at the bottom end of the distribution of CRL measurements. The choice of 7 weeks as a lower limit for extrapolation was based on the desire to be able to obtain a good fit to the data at 9 weeks where the actual data is truncated and it was also the lowest limit where the fitted equations and range of gestational age remained plausible when extrapolated. Then, using the augmented data set, we model GA as a function of CRL
with CRL restricted to≤65 mm (lowest CRL
measure-ment reported at 14 weeks in the INTERGROWTH-21st
data set) as there remains a truncation problem at the upper end of the CRL distribution (Figure 4, panel B). We then extrapolated the mean and SD equations ob-tained to the rest of the data (Figure 4, panel C). The predicted GA from this approach was compared to that originally reported by Verburg (Table 2). A sensitivity analysis to establish which lower cut-off, i.e. truncating CRL at 10 mm, 15 mm or 20 mm had the best predic-tion, was performed by comparing the predicted GA
4
6
8
10
12
14
16
18
0 20 40 60 80 100
Crown-rump length (mm)
Generated data Simulated model fit Verburg original fit
Gestational age (weeks)
Figure 1Simulated data for crown-rump length measurements in relation to gestational age with fitted centiles.Full title: Simulated
data for crown-rump length (CRL) measurements in relation to gestational age (grey circles) with 3rdand 97thfitted centiles. Blue continuous lines
obtained using the derived equation to that reported by Verburg. We note that the choice of a cut-off affects the fit for large CRL and so has clinical implications, be-cause it is desirable to have predictions of GA from CRL between 15 mm and 95 mm (Table 2).
Approach 2–simulation for small and large crown-rump length
Approach 2 is very similar to Approach 1, with data sim-ulated from fitting a size equation and using the mean and SD equations of CRL by log GA (Figure 5, panel A). We use the model for CRL to simulate 100 observations of CRL (about the same number of observations for each day of GA in the un-truncated data set) for each day of gestation at both ends of the distribution, i.e. below 9 weeks (between 7 and 9 weeks) and above 14 weeks (between 14 and 17 weeks) of gestation (Figure 5, panel B). The choice of 7 weeks as a lower limit and 17 weeks as an upper limit for extrapolation was based on the de-sire to be able to obtain a good fit to the data between 9 and 14 weeks where the actual data is truncated. The two cut-offs (at 7 and 17 weeks) were also the lowest and upper limits where the fitted equations and range of gestational age remained plausible when extrapolated.
The simulated CRL measurements below 9 weeks and above 14 weeks overcomes the truncation problem pre-sented by the data thereby allowing us to model GA as a function of CRL more efficiently and obtain the respect-ive median and SD equation (Figure 5, panel C). The predicted GA from this approach was compared to that originally reported by Verburg (Table 3). A sensitivity analysis assessment was performed in relation to the value of the lower end cut-off of CRL.
Approach 3–interchanging the X and Y axes from a model for size
The third approach does not require simulating data. As before, we model CRL (Y axis) as a function of GA (X axis) using all the available data. We then extrapolate the obtained equations to larger GA to cover the desired range of CRL (Figure 6, panel A). We then interchange the X and Y axes to give GA (Y-axis) as a function of CRL (X-axis) (Figure 6, panel B). We do not now
Table 1 Crown-rump length (CRL) measurements in relation to gestational age for the original equation fit reported by Verburg et al. [2] compared to our model fit of the simulated data
Verburg’s original reported equation
Equation from the simulated data
CRL (mm) Median GA (Weeks) predicted from CRL
Median GA (Weeks) predicted from CRL
Difference in GA (days)
5 6.336 6.324 0.082
10 7.503 7.497 0.041
15 8.312 8.310 0.015
20 8.962 8.962 −0.003
25 9.519 9.521 −0.017
30 10.015 10.019 −0.026
35 10.469 10.474 −0.032
40 10.892 10.897 −0.035
45 11.290 11.296 −0.036
50 11.670 11.675 −0.036
55 12.034 12.039 −0.033
60 12.386 12.390 −0.029
65 12.727 12.731 −0.023
70 13.060 13.063 −0.016
75 13.386 13.387 −0.008
80 13.706 13.706 0.001
85 14.021 14.019 0.012
90 14.331 14.328 0.023
95 14.638 14.633 0.036
100 14.942 14.935 0.050
A
B
0
20
40
60
80
100
120
8 9 10 11 12 13 14 15
Gestational age (weeks)
8
9
10
11
12
13
14
15
0 20 40 60 80 100 120
Crown-rump length (mm)
Crown-rump length (mm) Gestational age (weeks)
Figure 2Simulated data generated from dating equation by Verburg and truncated at 9 and 14 weeks.Full title: Simulated data
generated from the dating equation by Verburg et al. and truncated at 9 and 14 weeks. PanelAshows crown-rump length (CRL) versus gestational
Generate un-truncated data from a previously published dating equation by Verburg et al.
Simulate 100 observations for CRL between 5mm and 110mm in 1mm increments
Model the simulated data relating GA (Y-axis) as a function of CRL (X-axis) using fractional polynomial regression
Compare fractional polynomial terms and predicted median GA from simulated data to the original dating equation reported by Verburg et al.
Truncate gestational age at 9 and 14 weeks to make it similar to the
INTERGROWTH-21stCRL data
Approach 1
1. Model CRL as function of GA to obtain mean and SD equations 2. Use this model to simulate CRL values for GA between 7 and 9 weeks 3. Model GA as function of CRL for CRL≤65 mm using observed data augmented by simulated CRL data 4. Extrapolate this model to extend the CRL range to 95 mm
Approach 2
1. Model CRL as function of GA to obtain mean and SD equations 2. Use this model to simulate CRL values between 7 and 9 weeks and between 14 and 17 weeks 3. Model GA as function of CRL using observed data augmented by simulated CRL data
Approach 3
1. Model CRL as function of GA to obtain mean and SD equations 2. Extrapolate this model beyond 14 weeks to 17 weeks GA 3. Interchange the Y and X axes from a model for size so that we now have GA as a function of CRL
Figure 3A Flow diagram summarising the process and methodology of the simulation study.Full title: A Flow diagram summarising the process and methodology of the simulation study to evaluate three methods to overcome the truncation problem inherent in the data set.
A
B
C
0
20
40
60
80
100
120
8 9 10 11 12 13 14 15 Gestational age (weeks)
6
7
8
9
10
11
12
13
14
15
0 20 40 60 80 100 120 Crown-rump length (mm)
6
7
8
9
10
11
12
13
14
15
0 20 40 60 80 100 120 Crown-rump length (mm)
Crown-rump length (mm) Gestational age (weeks) Gestational age (weeks)
Figure 4Crown-rump length measurements in relation to gestational age with fitted centiles (Approach 1).Full title: Crown-rump length
(CRL) measurements in relation to gestational age (grey circles) with 3rd, 50thand 97thfitted centiles (PanelA). Yellow small crosses in panelsB
andCrepresent data simulated from the fitted equation of the mean and SD from panelA. PanelBshows the model fit relating GA and CRL
have equations for the median and SD describing the relationship between GA to CRL but rather three sets
of X, Y coordinates of GA giving the predicted 3rd,
50th and 97th centiles for CRL. We can obtain a new
equation for the median by regressing GA on the pre-dicted median CRL. Similarly, we can obtain
equa-tions for the 3rd and 97th centiles (Figure 6, panel C).
The predicted GA from this approach was compared to that originally reported by Verburg (Table 4). Since we do
not have an equation for the SD, the full model cannot be written down simply. We describe how we obtained an equation for the SD as function of CRL that also allows prediction of any desired centiles.
Computing an equation for the standard deviation
We have described above how to obtain equations for
say the 3rd, 50th and 97th centiles by regressing GA on
the predicted pth centile of CRL measurements. Using
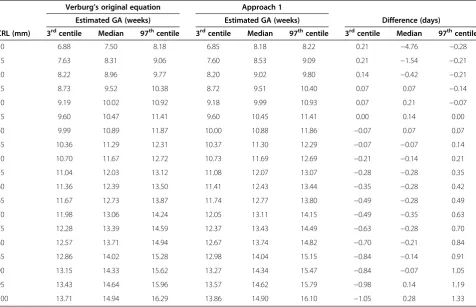
Table 2 Estimated gestational age in relation to crown-rump length (CRL) measurements for the original equation reported by Verburg and a model fitted to the simulated data (Approach 1)
Verburg’s original equation Approach 1
Estimated GA (weeks) Estimated GA (weeks) Difference (days)
CRL (mm) 3rdcentile Median 97thcentile 3rdcentile Median 97thcentile 3rdcentile Median 97thcentile
10 6.88 7.50 8.18 6.85 8.18 8.22 0.21 −4.76 −0.28
15 7.63 8.31 9.06 7.60 8.53 9.09 0.21 −1.54 −0.21
20 8.22 8.96 9.77 8.20 9.02 9.80 0.14 −0.42 −0.21
25 8.73 9.52 10.38 8.72 9.51 10.40 0.07 0.07 −0.14
30 9.19 10.02 10.92 9.18 9.99 10.93 0.07 0.21 −0.07
35 9.60 10.47 11.41 9.60 10.45 11.41 0.00 0.14 0.00
40 9.99 10.89 11.87 10.00 10.88 11.86 −0.07 0.07 0.07
45 10.36 11.29 12.31 10.37 11.30 12.29 −0.07 −0.07 0.14
50 10.70 11.67 12.72 10.73 11.69 12.69 −0.21 −0.14 0.21
55 11.04 12.03 13.12 11.08 12.07 13.07 −0.28 −0.28 0.35
60 11.36 12.39 13.50 11.41 12.43 13.44 −0.35 −0.28 0.42
65 11.67 12.73 13.87 11.74 12.77 13.80 −0.49 −0.28 0.49
70 11.98 13.06 14.24 12.05 13.11 14.15 −0.49 −0.35 0.63
75 12.28 13.39 14.59 12.37 13.43 14.49 −0.63 −0.28 0.70
80 12.57 13.71 14.94 12.67 13.74 14.82 −0.70 −0.21 0.84
85 12.86 14.02 15.28 12.98 14.04 15.15 −0.84 −0.14 0.91
90 13.15 14.33 15.62 13.27 14.34 15.47 −0.84 −0.07 1.05
95 13.43 14.64 15.96 13.57 14.62 15.79 −0.98 0.14 1.19
100 13.71 14.94 16.29 13.86 14.90 16.10 −1.05 0.28 1.33
A
B
C
0
20
40
60
80
100
120
8 9 10 11 12 13 14 15
Gestational age (weeks)
6
7
8
9
10
11
12
13
14
15
0 20 40 60 80 100 120
Crown-rump length (mm)
6
7
8
9
10
11
12
13
14
15
0 20 40 60 80 100 120
Crown-rump length (mm)
Crown-rump length (mm)
Gestational age (weeks) Gestational age (weeks)
Figure 5Crown-rump length measurements in relation to gestational age with fitted centiles (Approach 2).Full title: Crown-rump length
(CRL) measurements in relation to gestational age (grey circles) with 3rd, 50th, and 97thfitted centiles (PanelA). Yellow small crosses in panelsBandC
these equations (3rd, 50th and 97th centile) relating log GA and CRL we can get two estimates of the SD at a
given CRL from the difference between 97th and 50th
centiles and between the 50thand 3rdcentiles. Note that
the two are not exactly the same but are very similar because GA was modelled on the log scale. It is thus reasonable to estimate the SD for each value of CRL by simply taking the average of the 2 SDs. An equation for
the SD relating GA to CRL was then obtained by regres-sing this SD (of GA) on CRL. Estimates of any desired centiles can then be obtained using the relation:
Pthcentile¼Median CRLþKSD
whereKis the normal equivalent deviate (z score)
corre-sponding to a particular centile, e.g.K= 1.88 for the 97th
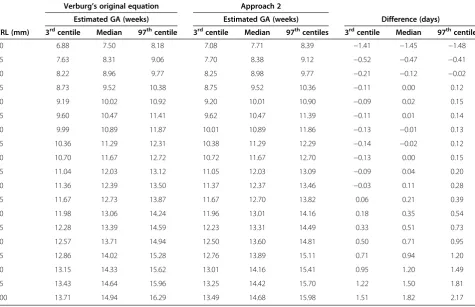
Table 3 Crown-rump length (CRL) measurements in relation to gestational age for the original equation fit reported by Verburg compared to model fit of the simulated data (Approach 2)
Verburg’s original equation Approach 2
Estimated GA (weeks) Estimated GA (weeks) Difference (days)
CRL (mm) 3rdcentile Median 97thcentile 3rdcentile Median 97thcentiles 3rdcentile Median 97thcentile
10 6.88 7.50 8.18 7.08 7.71 8.39 −1.41 −1.45 −1.48
15 7.63 8.31 9.06 7.70 8.38 9.12 −0.52 −0.47 −0.41
20 8.22 8.96 9.77 8.25 8.98 9.77 −0.21 −0.12 −0.02
25 8.73 9.52 10.38 8.75 9.52 10.36 −0.11 0.00 0.12
30 9.19 10.02 10.92 9.20 10.01 10.90 −0.09 0.02 0.15
35 9.60 10.47 11.41 9.62 10.47 11.39 −0.11 0.01 0.14
40 9.99 10.89 11.87 10.01 10.89 11.86 −0.13 −0.01 0.13
45 10.36 11.29 12.31 10.38 11.29 12.29 −0.14 −0.02 0.12
50 10.70 11.67 12.72 10.72 11.67 12.70 −0.13 0.00 0.15
55 11.04 12.03 13.12 11.05 12.03 13.09 −0.09 0.04 0.20
60 11.36 12.39 13.50 11.37 12.37 13.46 −0.03 0.11 0.28
65 11.67 12.73 13.87 11.67 12.70 13.82 0.06 0.21 0.39
70 11.98 13.06 14.24 11.96 13.01 14.16 0.18 0.35 0.54
75 12.28 13.39 14.59 12.23 13.31 14.49 0.33 0.51 0.73
80 12.57 13.71 14.94 12.50 13.60 14.81 0.50 0.71 0.95
85 12.86 14.02 15.28 12.76 13.89 15.11 0.71 0.94 1.20
90 13.15 14.33 15.62 13.01 14.16 15.41 0.95 1.20 1.49
95 13.43 14.64 15.96 13.25 14.42 15.70 1.22 1.50 1.81
100 13.71 14.94 16.29 13.49 14.68 15.98 1.51 1.82 2.17
A
B
C
0
20
40
60
80
100
120
8 9 10 11 12 13 14 15 16 17 Gestaional age (weeks)
8
9
10
11
12
13
14
15
16
17
0 20 40 60 80 100 120 Crown-rump length (mm)
8
9
10
11
12
13
14
15
0 20 40 60 80 100 120
Crown-rump length (mm)
Crown-rump length (mm)
Gestational age (weeks)
Gestational age (weeks)
Figure 6Crown-rump length measurements in relation to gestational age with fitted centiles (Approach 3).Full title: Crown-rump length
(CRL) measurements in relation to gestational age (GA) with fitted 3rd, 50thand 97thcentiles (PanelA). PanelBshows the relation between GA
and CRL after interchanging the axes and fitting new models to the three sets of coordinates. PanelCshows the model obtained by simply
centile and −1.88 for the 3rd centile, and the SD in this equation are the predicted estimates from the regression analysis just described.
Results
The agreement in estimated median GA between ap-proach 1 and Verburg’s original fit was within 0.4 days for CRL between 20 mm and 100 mm. The largest dif-ference was at the lower range of CRL i.e. 4.8 days and 1.5 days for CRL values of 10 mm and 15 mm respect-ively (Figure 4, Table 2, and Figure 7). This is notably be-cause the model was first fit for CRL between 20 mm and 65 mm and extrapolated to the rest of the data. Model fits beginning with lower CRL values i.e. 10 mm and 15 mm did not perform as well when extended to the rest of the data. There were 135/4600 (2.9%)
obser-vations below the 3rdcentile and 120/4600 (2.6%) above
the 97th centile for CRL between 20 mm and 100 mm
(Figure 4).
The predicted values of median GA from approach 2 agreed within 1 day for CRL between 15 mm and 85 mm with the largest difference at the 2 extremes of CRL, i.e. 1.5 days for CRL of 10 mm and 1.8 days for CRL of 100 mm (Figure 5, Table 3, and Figure 7). There
were 207/7640 (2.7%) observations below the 3rdcentile
and 232/7640 (3.0%) above the 97thcentile for CRL
be-tween 20 mm and 100 mm (Figure 5).
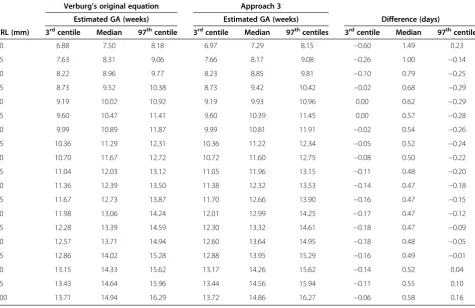
Approach 3 agreed within 1 day for CRL between 15 mm and 100 mm with the largest difference of 1.5 days ob-served at CRL of 10 mm. Approach 3 underestimated the predicted median GA across the whole range by ~0.6 days (Figure 6, Table 4, and Figure 7). There were 128/6448
(2.0%) observations below the 3rd centile and 221/6448
(3.4%) above the 97thcentile for CRL between 20 mm and
100 mm (Figure 6). The estimates obtained from the computation of SD for approach 3 were remarkably simi-lar to those obtained from the three sets of X, Y
coordi-nates of GA and the predicted 3rd, 50thand 97thcentiles
for CRL (Figure 6 panels B and C).
We have shown that these rather“ad hoc”approaches
correspond very closely to the “real data” for Verburg
(Figure 7), which is a data set that has similarities to the
INTERGROWTH-21st project CRL data set (Figure 8).
Hence we are confident that we can use these approaches
to get reliable estimates based on INTERGROWTH-21st
CRL data as demonstrated in the next section (Figures 9, 10, 11 and 12). We do not discuss any results of the
INTERGROWTH-21stCRL data as the data collection is
Table 4 Crown-rump length (CRL) measurements in relation to gestational age for the original equation fit reported by Verburg compared to model fit of the simulated data (Approach 3)
Verburg’s original equation Approach 3
Estimated GA (weeks) Estimated GA (weeks) Difference (days)
CRL (mm) 3rdcentile Median 97thcentile 3rdcentile Median 97thcentiles 3rdcentile Median 97thcentile
10 6.88 7.50 8.18 6.97 7.29 8.15 −0.60 1.49 0.23
15 7.63 8.31 9.06 7.66 8.17 9.08 −0.26 1.00 −0.14
20 8.22 8.96 9.77 8.23 8.85 9.81 −0.10 0.79 −0.25
25 8.73 9.52 10.38 8.73 9.42 10.42 −0.02 0.68 −0.29
30 9.19 10.02 10.92 9.19 9.93 10.96 0.00 0.62 −0.29
35 9.60 10.47 11.41 9.60 10.39 11.45 0.00 0.57 −0.28
40 9.99 10.89 11.87 9.99 10.81 11.91 −0.02 0.54 −0.26
45 10.36 11.29 12.31 10.36 11.22 12.34 −0.05 0.52 −0.24
50 10.70 11.67 12.72 10.72 11.60 12.75 −0.08 0.50 −0.22
55 11.04 12.03 13.12 11.05 11.96 13.15 −0.11 0.48 −0.20
60 11.36 12.39 13.50 11.38 12.32 13.53 −0.14 0.47 −0.18
65 11.67 12.73 13.87 11.70 12.66 13.90 −0.16 0.47 −0.15
70 11.98 13.06 14.24 12.01 12.99 14.25 −0.17 0.47 −0.12
75 12.28 13.39 14.59 12.30 13.32 14.61 −0.18 0.47 −0.09
80 12.57 13.71 14.94 12.60 13.64 14.95 −0.18 0.48 −0.05
85 12.86 14.02 15.28 12.88 13.95 15.29 −0.16 0.49 −0.01
90 13.15 14.33 15.62 13.17 14.26 15.62 −0.14 0.52 0.04
95 13.43 14.64 15.96 13.44 14.56 15.94 −0.11 0.55 0.10
A
B
C
D
6
7
8
9
10
11
12
13
14
15
0 20 40 60 80 100 120
Crown-rump length (mm)
Data Approach 1 Verburg
6
7
8
9
10
11
12
13
14
15
0 20 40 60 80 100 120
Crown-rump length (mm)
Data Approach 2 Verburg
6
7
8
9
10
11
12
13
14
15
0 20 40 60 80 100 120
Crown-rump length (mm)
Data Approach 3 Verburg
6
7
8
9
10
11
12
13
14
15
0 20 40 60 80 100 120
Crown-rump length (mm)
Data Approach 1 Approach 2 Approach 3 Verburg
Gestational age (weeks) Gestaional age (weeks)
Gestational age (weeks) Gestational age (weeks)
Figure 7Crown-rump length measurements in relation to gestational age comparing the 3 approaches with Verburg.Full title: Crown-rump
length (CRL) measurements in relation to gestational age for the simulated data for CRL from 9+0to 13+6weeks gestational age comparing each
of the 3 approaches with Verburg (PanelA,BandC) and all the 3 approaches with Verburg (PanelD).
A
B
8
9
10
11
12
13
14
15
0 20 40 60 80 100 120
Crown-rump length (mm)
0
20
40
60
80
100
120
8 9 10 11 12 13 14 15
Gestational age (weeks)
Gestational age (weeks)
Crown-rump length (mm)
Figure 8Crown-rump length versus gestational age using a sample of the INTERGROWTH-21stCRL project data.Full title: Crown-rump
length (CRL) versus gestational age for creating a size chart (PanelA) and gestational age versus crown-rump length data for creating a dating
chart (PanelB) using a sample of the INTERGROWTH-21stproject data (~35% of the overall target sample) for CRL from 9+0to 13+6weeks
still on-going and for demonstration purposes we have used ~35% of the overall target sample in this paper. Re-sults of the full sample and the new international dating equation will be published in a separate paper.
Figure 8 shows data from 1600 fetuses (~35% of the overall target sample) included in the INTERGROWTH
21st study, in the same format as Figure 2. The close
similarity between the two data sets is apparent. The
collection of INTERGROWTH-21st data will be
com-pleted in 2013.
Discussion
The main aim of this study was to explore the best methodology for modelling data when the outcome vari-able (GA) is truncated at both ends, i.e. at 9 and 14 weeks. We evaluated 3 approaches to overcome this difficulty by generating data from an existing equation (Verburg). The three approaches provided a good fit to the data (Figure 6) when compared to the original equation
reported by Verburg. We appreciate that the choice of which approach is the best is hard to justify through formal statistical testing. Approach 2 was considered the best since it gives excellent results (i.e. estimates agreed within 1 day for CRL between 15 mm and 85 mm with the largest difference of 1.8 days at the very extreme end) when compared to approach 1 which had the largest difference (4.7 days) at the lower end of CRL distribution while approach 3 consistently underestimated GA by about half a day over the entire range of CRL.
A recent systematic review of CRL dating equations and charts showed large variations between studies with only very few studies reporting complete information on
inclusion/exclusion criteria, maternal demographics,
ultrasound quality control, last menstruation reliability and sample selection [13]. This potential for bias, meth-odological heterogeneity and limitations would affect clinical decision-making depending on the equation used; hence the need for an international dating equation and
A
B
C
0
20
40
60
80
100
120
8 9 10 11 12 13 14 15
Gestational age (weeks)
6
7
8
9
10
11
12
13
14
15
0 20 40 60 80 100 120
Crown-rump length (mm)
6
7
8
9
10
11
12
13
14
15
0 20 40 60 80 100 120
Crown-rump length (mm)
Crown-rump length (mm) Gestational age (weeks)
Gestational age (weeks)
Figure 9INTERGROWTH-21stcrown-rump length measurements in relation to gestational age with fitted centiles (Approach 1).Full
title: Crown-rump length (CRL) measurements in relation to gestational age (grey small hollow circles) with 3rd, 50thand 97thfitted centiles
(PanelA). Brown small crosses in panelBandCrepresents the INTERGROWTH-21stproject data for CRL from 9+0to 13+6weeks gestational age of
the fitted equation of the mean and SD from panelA. PanelBshows the model fit relating GA and CRL with CRL restricted to≤65 mm and
panelCshows the extrapolated model fit in panelBto the rest of the data (Approach 1).
A
B
C
0
20
40
60
80
100
120
8 9 10 11 12 13 14 15 Gestational age (weeks)
6
7
8
9
10
11
12
13
14
15
0 20 40 60 80 100 120 Crown-rump length (mm)
6
7
8
9
10
11
12
13
14
15
0 20 40 60 80 100 120 Crown-rump length (mm)
Crown-rump length (mm)
Gestational age (weeks) Gestational age (weeks)
Figure 10INTERGROWTH-21stcrown-rump length measurements in relation to gestational age with fitted centiles (Approach 2).Full
title: Crown-rump length (CRL) measurements in relation to gestational age (grey small hollow circles) with 3rd, 50thand 97thfitted centiles
(PanelA). Brown small crosses in panelsBandCrepresents the INTERGROWTH-21stproject data for CRL from 9+0to 13+6weeks gestational age
chart. The INTERGROWTH-21st population which is carefully selected and actively followed up during pregnancy with a known outcome at birth provides a population that is ideal for developing such an international standard equation and chart. The
INTER-GROWTH-21stproject is the biggest study so far to
pro-spectively collect data on CRL. These data are of very high quality, with ultrasound measurements made by highly trained sonographers following a standardised proto-col using standard ultrasonography equipment with latest technology across 8 geographically diverse sites.
Gestational age estimation is an important component of clinical care and epidemiological studies. We believe that, as in other fields of medicine, all available informa-tion should be used for assessment, i.e. both LMP and ultrasound should be taken into account and agreement
between the two required to be certain of its validity. One should consider that discrepancy between LMP and ultrasound could be due to disturbances in early fetal growth rather than an automatic assumption of incorrect dates, leading to re-dating. There is wide agreement that CRL is the best measure for assessing gestational age, certainly up to 14 weeks GA, since LMP is affected by both random error and systematic tendency to overstate the duration of gestation, bio-logical variability and errors of the method including recall bias, digit preference, and additional bleeding after conception [5,27-32]. Ultrasound-based methods measure fetal size and use reliable LMP-based formu-las (of which many are in use) to estimate gestational age; however this assumes no biological variability as all fetuses of a given size are estimated to have the same gestational
A B
C
0
20
40
60
80
100
120
8 9 10 11 12 13 14 15 16 17
Gestational age (weeks)
8
9
10
11
12
13
14
15
16
17
0 20 40 60 80 100 120
Crown-rump length (mm)
8
9
10
11
12
13
14
15
0 20 40 60 80 100 120
Crown-rump length (mm)
Crown-rump length (mm) Gestational age (weeks) Gestational age (weeks)
Figure 11INTERGROWTH-21stcrown-rump length measurements in relation to gestational age with fitted centiles (Approach 3).
Full title: Crown-rump length (CRL) measurements in relation to gestational age (GA) (grey small hollow circles) with 3rd, 50thand 97th
fitted centiles (PanelA). PanelBand Crepresents shows the relation between GA and CRL after interchanging the axes and refitting the
model (Approach 3).
8
9
10
11
12
13
14
15
G
e
s
tat
io
na
l ag
e (
w
e
e
k
s
)
0 20 40 60 80 100 120 Crown-rump length (mm)
Data Approach 1 Approach 2 Approach 3
8
9
10
11
12
13
14
15
G
e
st
a
ti
o
n
a
l a
g
e
(w
e
e
k
s
)
0 20 40 60 80 100 120 Crown-rump length (mm)
Data Approach 1 Approach 2 Approach 3 Verburg
A
B
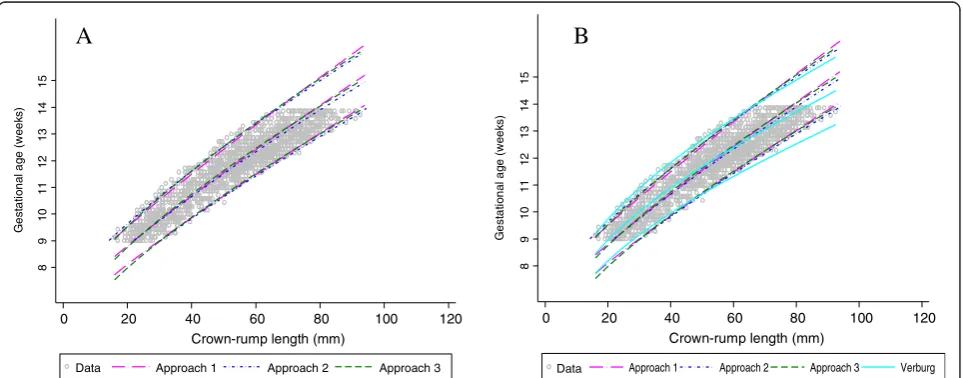
Figure 12INTERGROWTH-21stcrown-rump length measurements in relation to gestational age comparing the 3 approaches with
Verburg.Full title: Crown-rump length (CRL) measurements in relation to gestational age for the INTERGROWTH-21stproject data for CRL from
age. However, biological variability exists and this is com-pounded by variability due to measurement error due to equipment and observer. Thus, accurate measurements of CRL require rigorous standardisation before initiation of the study and continuous quality control measures should be implemented similar to those routinely used in labora-tory practices.
The implications of these different methods on research findings have recently been discussed [12]. Ultrasound can accurately determine the day of con-ception to within 5 days either way for 95% of cases and may be closer than LMP by an average of 2-3 days in predicting the date of a spontaneous delivery [1,17,27,28,33,34].
The unusual problem of truncation that we
encoun-tered in the INTERGROWTH-21st CRL data is not
unique in that it has been present in other studies, but has never been adequately addressed. This feature of the data has the potential to introduce considerable bias, mostly at the extremes of CRL, unless analysed carefully. Altman et al. [17] addressed a similar problem in the es-timation of GA using head circumference by restricting the range of measurements included in the regression analyses. As opposed to their HC data, for which the
GA range was 12-42 weeks, the INTERGROWTH-21st
CRL data span only 5 weeks so using CRL data un-affected by truncation leads to a large loss of data and limited clinical usefulness.
Conclusion
Although these approaches do not follow standard stat-istical analysis paradigms for modelling, we have shown
empirically that the results of these rather“ad hoc”
stat-istical methods correspond very closely to the“real data”
based on the study of Verburg et al. [2], which is a data
set similar to CRL data set of the INTERGROWTH-21st
project. They are more suitable for large data sets to reduce the effect of sampling variation and ensure reasonable extrapolation. We are thus confident that we can use these approaches to get reliable estimates
based on INTERGROWTH-21st CRL data. Although
only examined for CRL, these methods may be a so-lution to other truncation problems involving similar data and their applicability to other settings would need to be evaluated.
Details of ethics approval
The INTERGROWTH-21st Project was approved by
the Oxfordshire Research Ethics Committee‘C’(reference:
08/H0606/139) and the research ethics committees of the individual participating institutions and corre-sponding health authorities where the Project was implemented.
Abbreviations
INTERGROWTH-21st:The International Fetal and Newborn Growth
Consortium for the 21stCentury; GA: Gestational age; CRL: Crown-rump
length; LMP: Last menstrual period; ISUOG: International Society of Ultrasound in Obstetrics and Gynaecology; NICE: National Institute for Health and Care Excellence; FP: Fractional polynomials; SD: Standard deviation.
Competing interests
The authors declare that they have no competing interests.
Authors’contributions
EOO and DGA jointly originated the methodology and concept. EOO performed the statistical analysis and wrote the first draft of the manuscript including figures and tables. All authors contributed to revisions of the manuscript, and read and approved the final version.
Authors’information
EOO is a Medical Statistician, AT is Senior Fellow in Fetal Medicine, JV is Professor of Perinatal Medicine and Principal Investigator for the
INTERGROWTH-21stProject and DGA is Professor of Medical Statistics.
Eric O. Ohuma1,2, Aris T. Papageorghiou1, Jose Villar1, and Douglas G Altman2
1Nuffield Department of Obstetrics & Gynaecology and Oxford Maternal &
Perinatal Health Institute (OMPHI), Green Templeton College, University of Oxford, Oxford, OX3 9DU, UK: for the International Fetal and Newborn Growth Consortium for the 21st Century (INTERGROWTH-21st Project)
2Centre for Statistics in Medicine, University of Oxford, Botnar Research
Centre, Windmill Road, Oxford OX3 7LD, UK.
Funding
This Project was supported by the INTERGROWTH-21stGrant ID# 49038 from
the Bill & Melinda Gates Foundation to the University of Oxford, for which we are very grateful. DGA is supported by a programme grant from Cancer Research UK (C5529). AT is supported by the Oxford Partnership Comprehensive Biomedical Research Centre with funding from the Department of Health NIHR Biomedical Research Centres funding scheme.
Received: 2 September 2013 Accepted: 28 November 2013 Published: 7 December 2013
References
1. ISUOG:Practice guidelines: performance of first-trimester fetal ultrasound
scan.Ultrasound Obstet Gynecol2013,41(1):102–113.
2. Verburg BO, Steegers EAP, De Ridder M, Snijders RJM, Smith E, Hofman A,
Moll HA, Jaddoe VWV, Witteman JCM:New charts for ultrasound
dating of pregnancy and assessment of fetal growth: longitudinal data from a population-based cohort study.Ultrasound Obstet Gynecol
2008,31(4):388–396.
3. Treloar A, Behn BG, Cowan DW:Analysis of gestational interval.Am J
Obstet Gynecol1967,99:34–45.
4. Campbell S:The prediction of fetal maturity by ultrasonic measurement
of the biparietal diameter.BJOG1969,76(7):603–609.
5. Campbell S, Warsof SL, Little D, Cooper DJ:Routine ultrasound screening
for the prediction of gestational age.Obstet Gynecol1985,65(5):613–620.
6. Waldenström U, Axelsson O, Nilsson S:A comparison of the ability of a
sonographically measured biparietal diameter and the last menstrual period to predict the spontaneous onset of labor.Obstet Gynecol1990,
76(3 Pt 1):336–338.
7. Institute of Obstetricians and Gynaecologists; Royal College of Physicians of
Ireland; Directorate of Quality and Clinical Care: HSE:Ultrasound diagnosis
of early pregnancy miscarriage.Clin Pract Guidel2010, :4–7. Version 1. Guideline 1.
8. Haglund B:Birthweight distributions by gestational age: comparison of
LMP-based and ultrasound-based estimates of gestational age using data from the Swedish Birth Registry.Paediatr Perinat Epidemiol2007, 21:72–78.
9. Grange G, Pannier E, Goffinet F, Cabrol D, Zorn J-R:Dating biometry during
the first trimester: accuracy of an every-day practice.Eur J Obstet Gynecol Reprod Biol2000,88(1):61–64.
10. Dietz PM, England LJ, Callaghan WM, Pearl M, Wier ML, Kharrazi M:A
age using linked California livebirth and prenatal screening records.
Paediatr Perinat Epidemiol2007,21:62–71.
11. Ioannou C, Talbot K, Ohuma E, Sarris I, Villar J, Conde-Agudelo A,et al:
Systematic review of methodology used in ultrasound studies aimed at creating charts of fetal size.BJOG2012,119(12):1425–1439.
12. Salomon LJ, Bernard JP, Duyme M, Buvat I, Ville Y:The impact of choice of
reference charts and equations on the assessment of fetal biometry.
Ultrasound Obstet Gynecol2005,25(6):559–565.
13. Napolitano R, Dhami J, Ohuma E, Loannou C, Conde Agudelo A, Kennedy S,
Villar J, Papageorghiou AT:Systematic review of the methodology used
for creating dating charts based on fetal crown-rump length.BJOG2013. Accepted.
14. Sladkevicius P, Saltvedt S, Almström H, Kublickas M, Grunewald C, Valentin L:
Ultrasound dating at 12-14 weeks of gestation. A prospective cross-validation of established dating formulae in in-vitro fertilized pregnancies.
Ultrasound Obstet Gynecol2005,26(5):504–511.
15. Sahota DS, Leung TY, Leung TN, Chan OK, Lau TK:Fetal crown-rump length
and estimation of gestational age in an ethnic Chinese population.
Ultrasound Obstet Gynecol2009,33(2):157–160.
16. Robinson HP, Fleming JEE:A critical evaluation of sonar crown-rump
length measurements.BJOG1975,82(9):702–710.
17. Altman DG, Chitty LS:New charts for ultrasound dating of pregnancy.
Ultrasound Obstet Gynecol1997,10(3):174–191.
18. Multicentre Growth Reference Study WHO:Assessment of differences in
linear growth among populations in the WHO multicentre growth reference study.Acta Paediatr2006,450:56–65.
19. Villar J, Altman DG, Purwar M, Noble JA, Knight HE, Ruyan P,et al:The
objectives, design and implementation of the multicentre, population-based, INTERGROWTH-21st project.BJOG2013,120:9–26.
20. Altman DG, Chitty LS:Design and analysis of studies to derive charts of
fetal size.Ultrasound Obstet Gynecol1993,3(6):378–384.
21. Altman DG, Chitty LS:Charts of fetal size: 1. Methodology.BJOG1994,
101(1):29–34.
22. Royston P, Altman DG:Regression using fractional polynomials of
continuous covariates: parsimonious parametric modelling.J R Stat Soc: Ser C: Appl Stat1994,43(3):429–467.
23. Kalish RB, Thaler HT, Chasen ST, Gupta M, Berman SJ, Rosenwaks Z,
Chervenak FA:First-and second-trimester ultrasound assessment of
gestational age.Am J Obstet Gynecol2004,191(3):975–978.
24. Caughey AB, Nicholson JM, Washington AE:First- vs second-trimester
ultrasound: the effect on pregnancy dating and perinatal outcomes.
Am J Obstet Gynecol2008,198(6):e701–e703. e706.
25. Bennett KA, Crane JMG, O’Shea P, Lacelle J, Hutchens D, Copel JA:First
trimester ultrasound screening is effective in reducing postterm labor induction rates: a randomized controlled trial.Am J Obstet Gynecol2004,
190(4):1077–1081.
26. Royston P, Altman DG:Design and analysis of longitudinal studies of fetal
size.Ultrasound Obstet Gynecol1995,6(5):307–312.
27. MacGregor SN, Tamura RK, Sabbagha RE, Minogue JP, Gibson ME, Hoffman
DI:Underestimation of gestational age by conventional crown-rump length dating curves.Obstet Gynecol1987,70(3 Pt 1):344–348.
28. Savitz DA, Terry JW Jr, Dole N, Thorp JM Jr, Siega-Riz AM, Herring AH:
Comparison of pregnancy dating by last menstrual period, ultrasound scanning, and their combination.Am J Obstet Gynecol2002,
187(6):1660–1666.
29. Harville EW, Wilcox AJ, Baird DD, Weinberg CR:Vaginal bleeding in very
early pregnancy.Hum Reprod2003,18(9):1944–1947.
30. Bottomley C, Bourne T:Dating and growth in the first trimester.Best Pract
Res Clin Obstet Gynaecol2009,23(4):439–452.
31. No Author:Vaginal bleeding in early pregnancy.BMJ1980,281(6238):470.
32. Falco P, Milano V, Pilu G, David C, Grisolia G, Rizzo N, Bovicelli L:
Sonography of pregnancies with first-trimester bleeding and a viable embryo: a study of prognostic indicators by logistic regression analysis.
Ultrasound Obstet Gynecol1996,7(3):165–169.
33. Taipale P, Hiilesmaa V:Predicting delivery date by ultrasound and
last menstrual period in early gestation.Obstet Gynecol2001,
97(2):189–194.
34. Geirsson RT:Ultrasound instead of last menstrual period as the
basis of gestational age assignment.Ultrasound Obstet Gynecol1991,
1(3):212–219.
doi:10.1186/1471-2288-13-151
Cite this article as:Ohumaet al.:Estimation of gestational age in early pregnancy from crown-rump length when gestational age range is
truncated: the case study of the INTERGROWTH-21stProject.BMC
Medical Research Methodology201313:151.
Submit your next manuscript to BioMed Central and take full advantage of:
• Convenient online submission
• Thorough peer review
• No space constraints or color figure charges
• Immediate publication on acceptance
• Inclusion in PubMed, CAS, Scopus and Google Scholar
• Research which is freely available for redistribution