Volume 16, Number 4, pp. 437–448.
http://www.scpe.org
ISSN 1895-1767
c
⃝
2015 SCPE
ENERGY EFFICIENCY OF PARALLEL MULTICORE PROGRAMS
DAVOR DAVIDOVI ´C∗, MATJAˇZ DEPOLLI†, TOMISLAV LIPI ´C∗, KAROLJ SKALA∗, AND ROMAN TROBEC†
Abstract. The increasing energy consumption of large-scale high performance resources raises technical and economical concerns. A reduction of consumed energy in multicore systems is possible to some extent with an optimized usage of computing and memory resources that is tailored to specific HPC applications. The essential step towards more sustainable consumption of energy is its reliable measurements for each component of the system and selection of optimally configured resources for specific applications. This paper briefly surveys the current approaches for measuring and profiling power consumption in large scale systems. Then, a practical case study of a real-time power measurement of multicore computing system is presented on two real HPC applications: maximum clique algorithm and numerical weather prediction model. We assume that the computing resources are allocated in a HPC cloud on a pay-per-use basis. The measurements demonstrate that the minimal energy is consumed when all available cores (up to the scaling limit for a particular application) are used on their maximal frequencies and with threads binded to the cores.
Key words: Energy efficiency, high-performance, maximum clique, numerical weather prediction
AMS subject classifications. 65Y05, 68U20
1. Introduction.
Nowadays, a large number of hard problems is being solved efficiently on large-scale
computing systems such as clusters, grids and clouds. The main building blocks of such systems are
high-performance computing (HPC) clusters, since they are furthermore embedded both into grid computing systems
as well as cloud computing systems [1]. A great advantage of Graphical Processor Unit (GPU) accelerators over
multicore platforms was demonstrated in terms of energy efficiency [2] with an overall energy consumption for
an order of magnitude smaller for the GPUs. Inside the clusters, the many-core architectures, such as GPUs [3],
as well as even more specialized data-flow computers [4] are getting an increasingly large supporting role but
the main processing is still performed by the multi-core main processors because of simple programming model.
In this research, we analyze the energy consumption profile of the processors on a two processor multi-core
computer, while varying its workload.
With the increasing number of components in large-scale computing systems the energy consumption is
steeply increasing [5]. In computer systems, energy (measured in Joules) is represented as the electricity resource
that can power the hardware components to do computation. On the other hand, power is the amount of energy
consumed per unit time (measured in Joules per second or Watts). The ever-increasing energy consumption of
large-scale computing systems causes higher operation costs (e.g. electricity bills) and has negative environmental
impacts (e.g. carbon dioxide emissions). Therefore, when designing large-scale computing systems, the focus is
often shifting from performance improvements to energy efficiency.
Energy can be reduced at several levels of the distributed architecture: individually on each node or hardware
component-level, at the middleware level, at the networking level, and at the application level [6, 7, 8, 9].
Suboptimal use of systems resources (e.g. over-provisioning) is the primary source of energy inefficiency at
middleware layer [6, 7, 10]. In over-provisioned systems, components usually consume excessive power when
they are relatively idle or underutilized. This is important from the user point of view, because
pay-per-use approaches stimulate pay-per-users to maximally exploit rented resources during the execution period.
Energy-proportional computing [11] introduces the concept of consuming energy Energy-proportional to resource utilization so
that an idle or underutilized component consumes less energy. For improving the energy efficiency at middleware
layer, energy-aware resource and workload management algorithms are utilized [10]. Increased network traffic in
many bandwidth sensitive network applications results also in increased number of networking devices such as
switches and routers and therefore in increased energy consumption. Thus, different approaches for new energy
aware network protocols and network infrastructure, e.g., software defined networks and network functions
virtualization, are developed also for improving energy efficiency at network layer [12, 13].
∗Rudjer Boˇskovi´c Institute, Centre for Informatics and Computing, Zagreb, Croatia †Joˇzef Stefan Institute, Department of Communication Systems, Ljubljana, Slovenia
A processor is a component that dominates the energy consumption of each node. Thus, most of techniques
are designed to reduce energy consumption of the processor [14, 15, 16]. Most of the current processors are
implemented with dynamic voltage and frequency scaling regulators to optimally adjust the voltage/frequency at
run-time according to the workload behavior. Paper [17] focuses on the dynamic control of the voltage regulators
in a chip multicore processors platform. Results from detailed simulations based on realistic experimental setups
demonstrate up to 9% total energy saving. In [18] a minimum energy voltage scheduling on a single
multi-core processor with software controlled dynamic voltage scaling is proposed. Another hardware approach for
improving power management for multi-core systems is with implementation of multiple voltage islands [19].
Different frequency scaling schemes were investigated in the past that minimize the total energy consumption.
The problem is even more critical in the real-time applications scheduling with pre-specified tasks’ deadlines [20].
The energy consumption heavily depends on the characteristic of applications. Some applications are
com-putationally intensive, other are data intensive, while other are hybrid of both. Energy-aware programming
models, regarding various types of workloads and architectures, are required to develop energy efficient
appli-cations [21, 22]. Programming approaches, based on optimal utilization of shared hardware on-chip resources,
e.g. cache memory, memory bandwidth, threads or cores, for improved energy efficiency are becoming popular
because of their simple implementation. In heterogeneous multicore processors that integrate CPU cores and
data-parallel accelerators (GPU) last-level cache memory can be managed to minimize the energy
consump-tion [23]. The dynamic assignment of thread-to-core can be particularly beneficial in saving the energy [24, 25].
These approaches are particularly important in the case of modern multi-core building blocks that have a
lot of options for controlling the execution parameters, e.g., number of cores, system frequency, core binding,
etc. The energy can be thus saved at all levels of large-scale architectures, even dynamically, depending on the
application program characteristics.
In this research we experimentally test the effects of the workload, core binding strategies, and frequency
scaling on energy requirements for two existing applications. We build on the previous research [26] with
addition of a communication intensive use case that significantly influences energy consumption. Our approach
does not require any change in the original source code of the applications and is thus instantly applicable
on a wide range of applications without inspecting their code. Our findings suggest that modern multi-core
architectures perform best both energy-wise and performance-wise when all of the cores are used, the frequency
is not throttled and threads are not allowed to migrate between cores.
The paper starts with a brief survey of the current approaches for measuring and profiling power
consump-tion in Sect. 2. In Sect. 3, two different use cases are presented together with the descripconsump-tion of the experimental
computer for software-based energy measurements. In Sect. 4, the obtained results are shown under various test
conditions, which demonstrate significant differences in the consumed energy. The results are discussed in more
details in Sect. 5 in order to deduce some useful rules for users of HPC cloud resources. The paper concludes
with the summary of results and directions for further work.
2. Energy Measurement and Profiling Approaches.
The essential step towards the energy-efficiency
is accurate, reliable and continuous energy consumption measurement of the system components. Energy
measurement and profiling approaches can be classified as hardware-based, software-based and hybrid. In the
following subsections the basic characteristics of hardware-based and software-based approaches are outlined,
based on two extensive survey papers [27, 28].
2.1. Hardware-based Energy Measurement.
Hardware-based energy measurement approaches are
In their simplicity, multi-meters cannot be used when a higher control of the measurement process is
required. In those cases, more complex devices have to be used that are often custom designed. In 2000, Viredaz
et al. designed a platform called
Itsy
to measure the energy consumption of mobile devices [30]. Another example
of a complex device to measure the energy consumption is a single board on computer called
PLEB
[31]. PLEB
uses a design with a set of on-board current sensors, and an analogue-to-digital converter with a micro-controller
to read the sensors. Unlike Itsy, which measures only the energy consumption of mobile devices, PLEB can
be used to measure the energy of processors, memories, flash drivers, and I/O components. Precise and
fine-grained measuring is also available through
PowerPack, a system for power profiling on typical clusters or other
distributed systems [32]. PowerPack measures power on system DC power lines and then maps it to individual
components of the system, using computer models. It also measures AC power consumption to derive the
efficiency of AC to DC conversion. All measurement are processed on a separate computer to ensure the power
profiling does not impact the system under test. PowerPack profiling is enabled by the provided API calls, that
link the application under test to control and communicate with the meter control process and thus correlate
the power profiles with the application source code. Since PowerPack uses both hardware- and software-based
methods of measurements it is actually a hybrid meter.
2.2. Software-based Energy Measurement.
The disadvantages of hardware-based energy
measure-ment techniques are in their dependence on the expensive sensing components and complex additional hardware
design. Considering the expensive and cumbersome setup, they are also not well suited for online monitoring
and designing of energy-aware policies. In contrary, software-based approaches can be used to supply more
fine-grained online information, although with reduced accuracy. They are more flexible because they can be
applied to different platforms without changing the hardware.
A software-based approach usually builds power/energy models to estimate the energy consumption at the
CPU instruction level, program block level, process level, hardware component level or full system level. These
models are built based on selection and optimization of power/energy indicators of a software or a hardware
component of interests. Regarding the power/energy indicators type, software based approaches can be classified
as system profile-based approaches or hardware performance counter (PMC) based approaches.
System profile or system events are a set of performance statistical information supplied by the operating
system or a special software. These events can describe the current state of hardware, software, and operating
system. For example, Joulemeter [33], tracks the energy consumption of a virtual machine using power/energy
models for three system hardware components, i.e. CPU, memory and disk. The CPU energy model uses CPU
utilization, the memory energy model uses the number of last level cache misses, while the disk energy model
uses the bytes of data written to and read from the disk as inputs to their energy consumption estimates.
Hardware performance counters are a group of special registers that count the hardware-related activities
within the computer systems. The PMC-based modelling [34] is implemented either with top-down or bottom-up
approaches. The first do not depend on modelled architecture thus enabling a fast and an easy deployment [35],
while the second depends on the underlying architecture and is therefore able to produce more informative,
responsive and accurate power/energy models. The bottom-up approach enables a breakdown of the energy
consumption per architectural components, but is more complex to deploy and less portable than the simpler
top-down approach [36].
3. Use Cases and Experimental Setup.
The use cases, presented in this section, have been used as
test applications for the analyses of energy consumption using real-time power monitoring. The experimental
computer comprised multi-core components, which are the main building blocks of the contemporary
large-scale computing systems, including those offered by the cloud infrastructure providers. The two use cases are
of different types based on their scalability characteristics. The first is characterized by high scalability on the
multi-core computer systems, and second is characterized by high communication costs, which limit the
scala-bility. The use cases are also implemented with different parallelization techniques, master-slave parallelization
and domain decomposition, and are consequently not equally sensitive to the computer architecture details,
such as the amount of cache memory and the number of its levels.
3.1. Maximum Clique Algorithm.
For the first use case, we use an application that implements the
parallel maximum clique algorithm [37], which is essentially a recursive program for traversing in a search
tree under the branch and bound strategy. The algorithm takes an input graph and returns its maximal fully
connected sub-graph. The maximum clique algorithm is characterized as a compute-bound algorithm and will
thus benefit if more processing units are employed for its solution. It is parallelized by using threads for searching
the tree branches asynchronously. The threads are synchronized only when accessing one global variable - the
size of the current clique. On large graphs - these are graphs that take at least a few seconds to search through
- the algorithm experiences a near-linear speedup on average.
As in all branch and bound approaches, the order in which the branches are searched influences the time
required to find the optimal solution. In general, the concurrent search of several branches influences on which
branches are searched and which not, which results in varying efficiency of the approach when used on various
number of threads. The effects of parallel speedup, which influences the energy consumption greatly, can thus
be hidden in the noise, generated by the varying branch and bound efficiency, which could make this algorithm
tricky to evaluate.
For our experiments, a small graph named p hat300-3 from the DIMACS collection of benchmark graphs
for the maximum clique problem [38] was used. This graph comprises 300 vertices and 33390 edges, while its
maximum clique spans over 36 of its vertices. The time required to find the maximum clique of p hat300-3 on
a single core of the experimental computer setup is about 1.3 seconds. A quality of this graph when searched
by the selected maximum clique algorithm is also that it experiences relatively smooth speedup with almost
constant branch and bound efficiency across the range of the experimented number of cores. By using this
graph, we streamline the experiments that would otherwise have to be made on a large set of input graphs just
to cover the average algorithm speedup.
3.2. WRF meteorological model.
The second use case is a public domain Weather Research and
Fore-casting model (WRF-ARW) [39, 40]. This is a next-generation numerical weather prediction system designed to
serve both operational forecasting and atmospheric research needs. The model, based on the input parameters
and data, gives as an output a prediction of several atmospheric phenomena such as temperature, moisture,
wind speed and direction, and precipitations. The model operates on a target geographical domain that is
divided into a grid. The distance between the grid points is called resolution. To increase the accuracy of
the forecast for a specific region, a smaller nested domain is defined within the main domain. The forecast is
conducted at each grid point on multiple vertical levels (3D grid) for each time step.
In the experiments we compute a 6-hour weather forecast for Croatia with one nested domain. The main
domain consists of 100
×
68 points and the nested domain of 58
×
61 points with 18 and 6 km resolution,
respectively, and 27 vertical levels. The time step is 2 minutes for the main, and 40 seconds for the nested
domain, thus, the number of iterations/steps is 180 and 1080 for the main and nested domain, respectively. The
total number of performed steps, for the 6-hour simulation, is 1.36
×
10
8.
The model applies different model for parallelism: MPI, OpenMP and hybrid MPI+OpenMP, that enable
execution on various computing architectures such as distributed and shared-memory (SMP) systems, clusters of
SMPs, and vector and multiprocessors base systems. The parallelism in the model is achieved by decomposition
of geographical domain (a domain on which the model simulation is run) into a 2D grid. The grid consists
of
patches, the rectangular sections of the model domain, each one allocated to a distributed memory node
and executed by one MPI process. On a node level, each patch is further divided into
tiles, which are the
square sections of a patch, allocated to a shared-memory processor and each tile is executed by a single thread
(i.e. OpenMP thread). Since our testing system is a shared-memory multi-core machine, only the OpenMP
parallel version was considered. Thus, the domain is decomposed into 1 patch and the number of tiles equals
to the number of threads (in our case up to 12 threads). The tiles are processed concurrently by different
threads, but, if the tile size cannot fit into the CPU’s cache memory, an additional communicational overhead
is exhibited.
3.3. Experimental Setup.
The performance of the use cases was evaluated in terms of execution time
and the corresponding power consumption. All results are shown as the average of 15 experiments. The
experimental computing system was running Ubuntu 12.04 server version OS and was composed of a dual CPU
2.3 GHz Intel Xeon E5-2630, each of CPUs with six physical cores. Both applications were compiled with the
GNU Compiler Collection (GCC), with parallelization flags
-O3 -march=native
and with
-lpthread
for the
MaxClique problem and
-fopenmp
for the WRF problem to exploit multi-threaded level of parallelism.
Use cases were executed on a varying number of cores up to the maximum available cores
nc
= [1..12], two
CPU clock frequencies
f
= [1.2 GHz, 2.3 GHz] which represent the minimum and maximum software settings for
the clock frequency in the experimental computer, and two binding policies -
bind
and
nobind. The
bind
policy
stands for enforced binding of the
n-th thread on the
n-th core (as listed by the OS), and
nobind
denotes that
binding is not enforced and thread management is completely up to the OS. It is worth noting that OS tends to
migrate threads among cores often, which is expected to adversely effect performance by causing some unneeded
cache misses in the core-local caches. On the other hand, the OS tends to distribute threads equally among all
available CPUs, and thus make available to the application the CPU-local caches of all the installed CPUs. The
effects of more caches can be difficult to predict, since they depend both on the application and on the values
of parameters to the application, but more often than not, they correspond to a better performance [41].
Additional feature of core binding is that when all the required threads can be loaded onto cores of a singe
CPU, the second CPU can be idle most of the time, unless loaded by the OS processes. Depending on the OS
and the processor used, the idle processor can be put into one of its sleep states. The OS indexes cores of the
first CPU as [1..6] and the cores of the second CPU as [7..12]. Therefore, while the enforced binding is used
and the number of cores is set to 6 or lower, only the cores of the first CPU will be used by the application,
enabling the OS to power down the second CPU. When binding is not enforced, OS tends to distribute the
threads among cores of both CPUs, even when only 2 threads are requested. OS also switches threads among
available cores at random intervals, which increases the number of cache misses, and consequently lowers the
performance of the application. Binding of threads to processor cores is performed through the
pthread API
for the MaxClique case and through the
likwid-pin
tool, which comes with likwid Performance monitoring and
benchmarking suite [42], for the WRF case.
Threads that are bound to cores are known to perform well by minimizing the low level cache flushing and
reloading, which happens if threads are moved between cores. The effect is very application dependent though.
In addition, when the program is executed on cores of multiple CPUs, instead of a single CPU, more cache is
available to it, which can speedup the execution [41]. This effect is very application and problem dependent
and rarely visible outside a narrow range of problem sizes. In our case there are only two CPUs available, which
makes the possible effects of such experiment severely limited, therefore we do not test such arrangement at all.
4. Experimental results.
4.1. Maximum clique program.
In this section we demonstrate the impacts of scaling the number of
computational cores, CPU frequencies and binding policies on the performance and energy consumption on
our use cases. The total execution time, power and energy consumption of the two use cases are shown in
Figs. 4.1, 4.2 and 4.3, respectively. Since the measurement of the performance and energy consumption can be
influenced by other running processes on the system (e.g. those managed by OS), we repeated each test 15 times
(with the same experimental setup). The results presented in the figures are calculated as an average value of
these repeated runs.
Figure 4.1(a) shows that the program for solving the maximum clique problem scales well on all test
configurations, with the speedup between 8.1 and 9.4 on 12 cores for different clock frequencies and binding
policies. The respective power consumption and energy consumption for the maximum clique problem are
shown in Fig. 4.2(a), and Fig. 4.3(a), respectively. A closer look at Fig. 4.3(a) reveals that at higher frequencies,
binding is significantly more energy efficient than leaving the thread management to OS, which spreads and
moves the threads around the cores of both CPUs. Also, note that by binding the threads to physical cores,
both the power and energy consumption are slightly reduced if the clock frequency is at its maximum while no
significant difference is noticed if the clock frequency is at its minimum.
2 4 6 8 10 12 0
0.5 1 1.5 2 2.5 3
Number of cores
t [seconds]
1.2 GHz 1.2 GHz (bind) 2.3 GHz 2.3 GHz (bind)
(a)
2 4 6 8 10 12
0 200 400 600 800 1000 1200 1400
Number of cores
t [seconds]
1.2 GHz 1.2 GHz (bind) 2.3 GHz 2.3 GHz (bind)
(b)
Fig. 4.1: Execution times for the maximum clique program (a) and the WRF model (b) as functions of the
number of used cores, clock frequency, and binding policy.
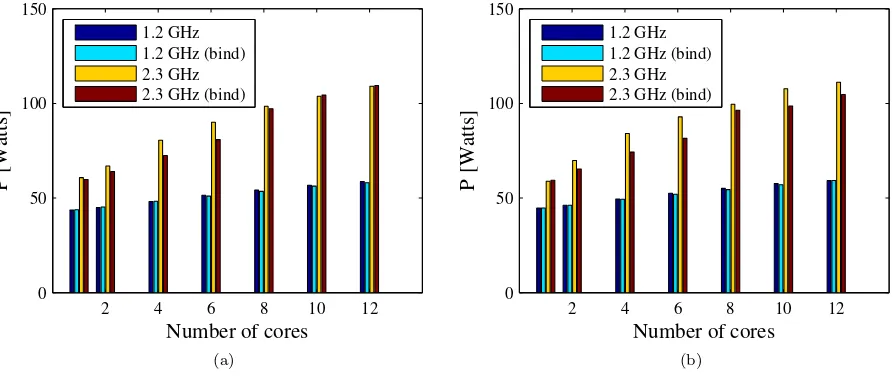
2 4 6 8 10 12
0 50 100 150
Number of cores
P [Watts]
1.2 GHz 1.2 GHz (bind) 2.3 GHz 2.3 GHz (bind)
(a)
2 4 6 8 10 12
0 50 100 150
Number of cores
P [Watts]
1.2 GHz 1.2 GHz (bind) 2.3 GHz 2.3 GHz (bind)
(b)
Fig. 4.2: Power consumption for the maximum clique program (a) and for the WRF model (b) as functions of
the number of used cores, clock frequency, and binding policy.
2 4 6 8 10 12 0
20 40 60 80 100 120 140
Number of cores
W [Joules]
1.2 GHz 1.2 GHz (bind) 2.3 GHz 2.3 GHz (bind)
(a)
2 4 6 8 10 12
0 1 2 3 4 5 6 7
x 104
Number of cores
W [Joules]
1.2 GHz 1.2 GHz (bind) 2.3 GHz 2.3 GHz (bind)
(b)
Fig. 4.3: Energy consumption for the maximum clique program (a) and for the WRF model (b) as a function
of the number of used cores, clock frequency, and binding policy.
on 1
−
4 cores than the improved data locality. Although the differences in performance are small, they are
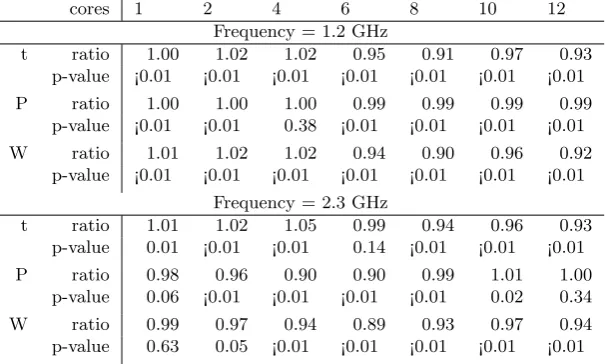
mostly statistically significant. Table 4.1 summarizes the differences in policy performance separately for each
performance measure (t, P, and W), each tested frequency and each number of cores. For each set of parameter
values, the performance is expressed by two statistics -
ratio
and
p-value.
Ratio
is the mean ratio between
the value obtained with
bind
policy and the value obtained with
nobind
policy.
P-value
is the p-value of the
paired Student’s
t
-test, on the null hypothesis that the performance is the same for both policies. Statistics are
collected from 15 repeats of the maximum clique program execution for each set of input parameters (binding
policy, number of cores, and clock frequency).
Table 4.1: Difference in performance of binding policies expressed as the statistics of
bind
policy relative to
nobind
policy for the maximum clique program.
cores 1 2 4 6 8 10 12
Frequency = 1.2 GHz
t ratio 1.00 1.02 1.02 0.95 0.91 0.97 0.93
p-value ¡0.01 ¡0.01 ¡0.01 ¡0.01 ¡0.01 ¡0.01 ¡0.01
P ratio 1.00 1.00 1.00 0.99 0.99 0.99 0.99
p-value ¡0.01 ¡0.01 0.38 ¡0.01 ¡0.01 ¡0.01 ¡0.01
W ratio 1.01 1.02 1.02 0.94 0.90 0.96 0.92
p-value ¡0.01 ¡0.01 ¡0.01 ¡0.01 ¡0.01 ¡0.01 ¡0.01
Frequency = 2.3 GHz
t ratio 1.01 1.02 1.05 0.99 0.94 0.96 0.93
p-value 0.01 ¡0.01 ¡0.01 0.14 ¡0.01 ¡0.01 ¡0.01
P ratio 0.98 0.96 0.90 0.90 0.99 1.01 1.00
p-value 0.06 ¡0.01 ¡0.01 ¡0.01 ¡0.01 0.02 0.34
W ratio 0.99 0.97 0.94 0.89 0.93 0.97 0.94
4.2. WRF program.
Our second use case is the WRF model, a computationally-intensive problem whose
performance is tackled by the communication speed and the size of the cache memory. As presented in
Fig. 4.1(b), the scalability rate drops with the number of cores used, for both clock frequencies and
bind-ing policy configurations. The problem scales well up to 10 cores (speedup is between 4.3 and 5.9), but exhibits
modest speedup on 12 cores only for variants using the
bind
policy, while the execution time for the
nobind
variants already increases. In contrast to the maximum clique algorithm, the speedup on 12 cores is a bit
lower, and amounts between 4.9 and 6.5 due to a higher communication cost between the running threads. The
explanation for that lays in the fact that when more cores are utilized, the tile size that can fit into the cache
decreases, which increases the number of cache misses.
The corresponding power consumption and the energy consumption are illustrated in Figs. 4.2(b) and 4.3(b),
respectively. Similar to the maximum clique problem, the tests show that the best energy-efficient strategy is
to use all the available cores at their maximum performance. The same statistics as for the Maximum clique
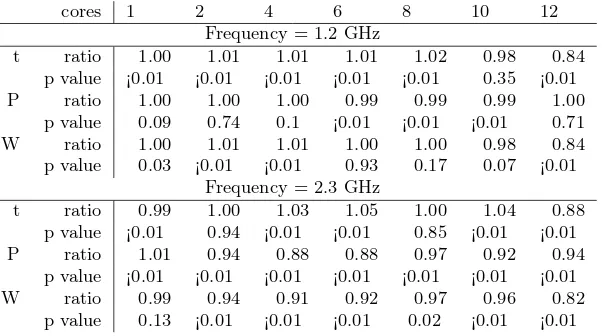
problem are gathered from 15 runs of the WRF model and summarized on Table 4.2. These show that for
the clock frequency of 1.2 GHz, on one hand, binding has a very limited effect on execution time and power
consumption (except on 12 cores), regardless of the binding policy. For the clock frequency of 2.3 GHz, on the
other hand, binding the threads to physical cores reduces the power consumption considerably, while it does
not change the execution times much.
Table 4.2: Difference in performance of binding policies expressed as the statistics of
bind
policy relative to
nobind
policy, for the WRF model
cores 1 2 4 6 8 10 12
Frequency = 1.2 GHz
t ratio 1.00 1.01 1.01 1.01 1.02 0.98 0.84
p value ¡0.01 ¡0.01 ¡0.01 ¡0.01 ¡0.01 0.35 ¡0.01
P ratio 1.00 1.00 1.00 0.99 0.99 0.99 1.00
p value 0.09 0.74 0.1 ¡0.01 ¡0.01 ¡0.01 0.71
W ratio 1.00 1.01 1.01 1.00 1.00 0.98 0.84
p value 0.03 ¡0.01 ¡0.01 0.93 0.17 0.07 ¡0.01 Frequency = 2.3 GHz
t ratio 0.99 1.00 1.03 1.05 1.00 1.04 0.88
p value ¡0.01 0.94 ¡0.01 ¡0.01 0.85 ¡0.01 ¡0.01
P ratio 1.01 0.94 0.88 0.88 0.97 0.92 0.94
p value ¡0.01 ¡0.01 ¡0.01 ¡0.01 ¡0.01 ¡0.01 ¡0.01
W ratio 0.99 0.94 0.91 0.92 0.97 0.96 0.82
p value 0.13 ¡0.01 ¡0.01 ¡0.01 0.02 ¡0.01 ¡0.01
4.3. Energy consumption in detail.
The energy consumption - calculated as power consumption times
execution time and shown in Tables 4.1 and 4.2 - indicates that energy-wise, best strategy is using all available
cores in combination with the thread binding strategy. This finding holds even though the WRF program
exhibits relatively low speedup at 12 cores.
A significant observation on both use cases is the jump in the power consumption from 6 to 8 cores when
threads are bound to cores. For up to 6 cores all threads are bound to one CPU, and the second CPU is
in idle state, while for 8 or more cores the threads are distributed on both CPUs, which increases the power
consumption in one large step (observe the jump between 6 and 8 cores bind versions, red color bars, in Fig. 4.2).
Note that the energy consumption continues to decrease due to the lower computational time caused by adding
additional cores. Once the second CPU is active, adding more cores again causes the execution time and the
energy consumption to decrease. Therefore using only one processor with all available cores is worth considering
for programs that might experience worse speedups than our use cases.
policy is used, compared to the
no-bind
policy. Note that the results for the maximum clique use case on the
higher clock frequency are very similar, while the results for both use cases on the low frequency display much
less difference in binding policies. These results indicate the level of randomness inserted into the measurements
by the OS regulated thread management.
1 1.5 2 2.5 3 3.5 4
x 104
1 2 4 6 8 10 12
Number of cores
W [Joules]
(a) No-bind
1 1.5 2 2.5 3 3.5 4
x 104
1 2 4 6 8 10 12
Number of cores
W [Joules]
(b) Bind
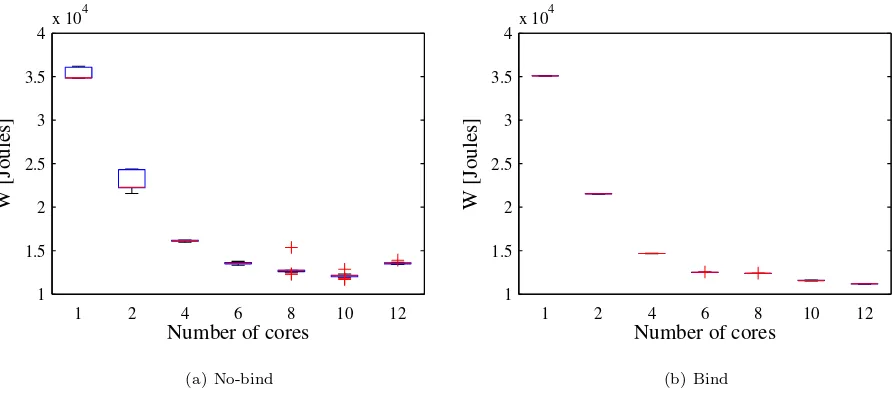
Fig. 4.4: Energy consumption for WRF model as a function of the number of used cores and binding policy
-(a) the no-bind policy, and (b) the bind policy. Graphs show the median (red line), 25 and 75 percentiles (blue
box), min and max values (blue whiskers), and outliers (red plus signs).
5. Discussion.
A simple experimental study of a real-time power measurement in a multi-core computing
system was presented. The energy consumption of two HPC parallel algorithms was measured, by the PCM
library, as a function of the number of cores, the system clock frequency, and the binding policy. The main
results of this research are listed below.
While we often believe that the two most influential factors on energy consumption are clock frequency and
execution time, it turns out that execution time dominates clock frequency. The lower the execution time, the
higher the energy efficiency, regardless of the clock frequency. This is caused by the relatively high baseline
power consumption of the CPU, memory, and the rest of the system, which was not even considered in this
study.
Second result shows that even less efficient parallel programs perform better, energy-wise, if executed on
more cores. Note that the baseline consumption of the other computer parts, which was not included in the study,
would again strengthen this finding even further. Of course, such a conclusion holds under the assumption that
the computer is not multitasking - its unused cores actually remain idle and that the idle time of the computer
can be ignored, which, for example, is not the case on computer resources rented for a fixed amount of time.
A scenario where our findings hold is for computer resources that are rented on the cloud for the time of the
execution only.
not monitored.
The fourth result is that the energy consumption for
bind
policy exhibits very small variation of the energy
consumptions between runs as illustrated in Fig. 4.4. This enables a precise and accurate prediction of the
energy consumption, especially if observed from the perspective of the cost reduction in utilizing public clouds
with the pay-per-use policy. Small variation is possible because no flushing and reloading of cache are performed
since threads are not moved among the cores. On the other hand, the
nobind
strategy, especially when applied
on a smaller number of cores, exhibits a large difference between the best and the worst run. This can be
explained by the fact that when the number of threads is small, OS is more likely to switch threads among cores
and CPUs, causing cache flushing on various cache levels.
6. Conclusion.
The obtained results show that idle power consumption of the CPU is significant. To
achieve highest energy efficiency, the whole application should be executed in the shortest possible time. This
can be achieved with cores at the highest possible system clock frequency, threads bound to cores and using
the maximum number of cores at which the speedup is still satisfactory high. To apply the optimization of
the energy consumption on general applications, a profiling of their speedup is required. In the tested cases,
for example, each additional core causes about 4.5% (mean of measured increases on the high clock frequency
setting) higher power consumption of the CPU. Therefore, when deciding weather to use
n
cores or
n
+ 1 cores,
one should favour
n
cores only if the relative decrease in execution time when raising the number of cores to
n
+ 1 is less than 4.5%.
Aside from affecting the execution time, binding threads to cores also directly lowers the power consumption
by limiting the number of cache flushes and main memory reads. This has been demonstrated in the WRF
model case, but not in the maximum clique case, since the WRF model is a memory intensive application, while
the maximum clique is more processing intensive. Caching is thus proved as another area, where more control
should have to be given to the program designer, to be able to get maximal performance of the computer at
the minimal energy cost.
To optimize the energy consumption more aggressively, one should be able to shut down the computing
cores and banks of memory completely, or at least put them in a sleep state with a significantly lower power
consumption. There are also some interesting possibilities of executing programs on multiple cores with
het-erogeneously set clock frequencies. In scenarios when computing resources are reserved for a predefined time
frame - as in some Clouds services for example - measuring the power consumption during the whole time frame
would be more to the point, instead of just for the time the program is executing. For such scenarios the role
of the execution time in the energy consumption will be lowered and throttling the clock frequency might start
to pay off. These are the topics of our current research and future work.
Acknowledgement.
The work presented in this paper has been supported by the Ministry of Education,
Science, Culture and Sport of the Republic of Slovenia and the Ministry of Science, Education and Sports of
the Republic of Croatia under the bilateral project ’Energy Efficiency at Distributed Computing Systems’, and
partially supported by EU under the COST programme Action IC1305, ’Network for Sustainable Ultrascale
Computing (NESUS)’.
REFERENCES
[1] G. L. Valentini, W. Lassonde, S. U. Khan, N. Min-Allah, S. A. Madani, J. Li, L. Zhang, L. Wang, N. Ghani, and J. Kolodziej,An overview of energy efficiency techniques in cluster computing systems, Cluster Computing, 16 (2011), 1, pp. 3–15.
[2] J. Liu, D. Feld, Y. Xue, J. Garcke, T. Soddemann, Multicore Processors and Graphics Processing Unit Accel-erators for Parallel Retrieval of Aerosol Optical Depth From Satellite Data: Implementation, Performance, and Energy Efficiency, IEEE Journal of Selected Topics in Applied Earth Observations and Remote Sensing, (2015), doi=10.1109/JSTARS.2015.2438893, Article in Press.
[3] G. Kosec and P. Zinterhof,Local strong form meshless method on multiple Graphics Processing Units, CMES: Computer Modeling in Engineering and Sciences, 91 (2013), pp. 377–396.
[4] M. J. Flynn, O. Mencer, V. Milutinovic, G. Rakocevic, P. Stenstrom, R. Trobec, and M. Valero,Moving from Petaflops to Petadata, Commun. ACM, 56 (2013), pp. 39–42.
[6] A. Beloglazov, R. Buyya, Y. C. Lee, and A. Zomaya,A Taxonomy and Survey of Energy-Efficient Data Centers and Cloud Computing Systems, Advances in Computers, 82 (2011), 2, pp. 47–111.
[7] C. Cai, L. Wang, S. U. Khan, and J. Tao,Energy-aware high performance computing - A taxonomy study, in Proceedings of the International Conference on Parallel and Distributed Systems - ICPADS, 2011, pp. 953–958.
[8] J. Shuja, S. A. Madani, K. Bilal, K. Hayat, S. U. Khan, and S. Sarwar,Energy-efficient data centers, Computing, 94 (2012), pp. 973–994.
[9] J. Mukherjee and S. Raha,Power-aware Speed-up for Multithreaded Numerical Linear Algebraic Solvers on Chip Multicore Processors, Scalable Computing: Practice and Experience, 10 (2009), 2, pp. 217–228.
[10] A. Y. Zomaya and C. L. Young,Energy-efficient Distributed Computing, Awareness Magazine, January (2012). [11] L. A. Barroso and U. H¨olzle,The case for energy-proportional computing, Computer, 40 (2007), pp. 33–37.
[12] K. Bilal, S. U. K. Kashif, S. A. Madani, K. Hayat, M. I. Khan, N. Min-Allah, J. Kolodziej, L. Wang, S. Zeadally, and D. Chen,A survey on Green communications using Adaptive Link Rate, Cluster Computing, 16 (2012), 3, pp. 575–589. [13] A. P. Bianzino, C. Chaudet, D. Rossi, and J.-L. Rougier,A survey of green networking research, IEEE Communications
Surveys and Tutorials, 14 (2012), pp. 3–20.
[14] Y. Liu and H. Zhu,A survey of the research on power management techniques for high-performance systems, Software -Practice and Experience, 40 (2010), pp. 943–964.
[15] N. B. Rizvandi and A. Y. Zomaya,A Primarily Survey on Energy Efficiency in Cloud and Distributed Computing Systems. arXiv preprint, 2012.
[16] S. Libutti, G. Massari, P. Bellasi, W. Fornaciari,Exploiting performance counters for energy efficient co-scheduling of mixed workloads on multi-core platforms, ACM International Conference Prceeding Series, (2014), pp. 27–32.
[17] W. Lee, Y. Wang, M. Pedram,,Optimizing a Reconfigurable Power Distribution Network in a Multicore Platform, IEEE Transactions on Computer-Aided Design of Integrated Circuits and Systems, 34 (2015), 7, pp. 1110–1123.
[18] A. Mishra, A. K. Tripathi,Energy efficient voltage scheduling for multi-core processors with software controlled dynamic voltage scaling, Applied Mathematical Modelling, 38 (2014), 14, pp. 3456–3466.
[19] S. Pagani, J.-J. Chen, M. Li,Energy efficiency on multi-core architectures with multiple voltage islands, IEEE Transactions on Parallel and Distributed Systems, 26 (2015), 6, pp. 1608–1621.
[20] G. M. Tchamgoue, J. Seo, K. H. Kim, Y.-K. Jun,Compositional power-aware real-time scheduling with discrete frequency levels, Journal of Systems Architecture, 61 (2015), 7, pp. 269–281.
[21] C. Zhang, K. Huang, X. Cui, and Y. Chen,Power-aware programming with GPU accelerators, in Proceedings of the 2012 IEEE 26th International Parallel and Distributed Processing Symposium Workshops, IPDPSW 2012, 2012, pp. 2443–2449. [22] C. Lively, X. Wu, V. Taylor, S. Moore, H.-C. Chang, C. Yi Su, and K. Cameron,Power-aware predictive models of hybrid (MPI/OpenMP) scientific applications on multicore systems, Computer Science - Research and Development, 27 (2012), pp. 245–253.
[23] A. Holey, V. Mekkat, P.-C. Yew, A. Zhai,Performance-energy considerations for shared cache management in a hetero-geneous multicore processor, ACM Transactions on Architecture and Code Optimization, 12 (2015), 1, pp. 1–29. [24] V. Petrucci, O. Loques, D. Moss, R. Melhem, N. A. Gazala, S. Gobriel,Energy-efficient thread assignment optimization
for heterogeneous multicore systems, ACM Transactions on Embedded Computing Systems, 14 (2015), 1, pp. 1–26. [25] M. Li, Y. Zhao, Y. Si,Dynamic core allocation for energy-efficient thread-level speculation, Computational Science and
Engineering (CSE), 2014 IEEE 17th International Conference on, 2014, pp. 682–689.
[26] R. Trobec, M. Depolli, K. Skala, and T. Lipic,Energy efficiency in large-scale distributed computing systems, in Infor-mation Communication Technology Electronics Microelectronics (MIPRO), 2013 36th International Convention on, May 2013, pp. 253–257.
[27] S. Benedict,Energy-aware performance analysis methodologies for HPC architectures - An exploratory study, Journal of Network and Computer Applications, 35 (2012), pp. 1709–1719.
[28] H. Chen and S. Weisong,Power Measuring and Profiling: the State of Art, andbook of Energy-Aware and Green Computing, pp. 649–674.
[29] Watts up. https://www.wattsupmeters.com, 2014.
[30] M. A. Viredaz and D. A. Wallach,Power evaluation of Itsy version 2.3, tech. report, 2000.
[31] D. C. Snowdon, S. M. Petters, and G. Heiser,Power measurement as the basis for power management, Proceedings of the 2005 Workshop on Operating System Platforms for Embedded Real-Time Applications, Palma, Mallorca, Spain, 2005.
[32] A. Y. Zomaya and Y. C. Lee,Energy Efficient Distributed Computing Systems, Wiley-IEEE Computer Society Pr, Hoboken, NJ, USA, 1st ed., 2012.
[33] A. Kansal, F. Zhao, J. Liu, N. Kothari, and A. A. Bhattacharya,Virtual machine power metering and provisioning, in Proceedings of the 1st ACM Symposium on Cloud Computing, SoCC ’10, 2010, pp. 39–50.
[34] R. Bertran, M. Gonzalez, X. Martorell, N. Navarro, and E. Ayguade,Counter-based power modeling methods: Top-down vs bottom-up, The Computer Journal, 56 (2013), pp. 198–213.
[35] W. L. Bircher and L. K. John,Complete system power estimation using processor performance events, IEEE Transactions on Computers, 61 (2012), pp. 563–577.
[36] R. Bertran,A systematic methodology to generate decomposable and responsive power models for CMPs, IEEE Transactions on Computers, 62 (2013), 7, pp. 1289–1302.
[37] J. Konc and D. Janeˇziˇc,An improved branch and bound algorithm for the maximum clique problem, Match, 58 (2007), pp. 569–590.
[39] J. Michalakes, S. Chen, J. Dudhia, L. Hart, J. Klemp, J. Middlecoff, and W. Skamarock,Development of a Next Generation Regional Weather Research and Forecast Model, in Developments in Teracomputing: Proceedings of the Ninth ECMWF Workshop on the Use of High Performance Computing in Meteorology, 2001, pp. 269–276.
[40] J. Michalakes, J. Dudhia, D. Gill, T. Henderson, J. Klemp, W. Skamarock, and W. Wang,The Weather Research and Forecast Model: Software Architecture and Performance, in Proceedings of the Eleventh ECMWF Workshop on the Use of High Performance Computing in Meteorology, World Scientific, 2005, pp. 156–168.
[41] G. Kosec, M. Depolli, A. Rashkovska, and R. Trobec,Super Linear Speedup in a Local Parallel Meshless Solution of Thermo-fluid Problems, Comput. Struct., 133 (2014), pp. 30–38.
[42] Likwid. https://github.com/rrze-likwid/likwid, 2015.