The Effect of Color Light and Stocking Density on Some
Biochemical Traits of Broilers and Layers
Mudhar A. S. Abu Tabeekh
Basra Veterinary Hospital, Basra, Iraq
Abstract
This study was designated to investigate the effect of light color and stocking density on some biochemical traits such as proteins, lipids, uric acid and glucose of broilers and layers. A total of 675 Ross 308 one day old broiler chicks were used in this study were exposed to white light (WL) as a control , red light (RL), blue light (BL), green light (GL), and Blue – Green mix light (BGL) by a light-emitting diode (LED) applied for 24 hours daily in separated rooms with light intensity 5watt/m2. The birds were randomly housed into 9 wooden sealed pens of 1m2 in three replicates for each density 12, 15 and 18
broilers/m2. In the second treatment, a total of 180 Isa Brown layers were raised from 25 week until 36 week of age. They
divided into 5 treatments with an average of 36 birds for each of five color light rooms (16 hours light- 8 hours dark) in
three replicates for each density 5 and 7 birds/m2 in the room. The present study indicated an absence of significant effect of
light color on serum glucose, cholesterol, high density lipoprotein (HDL) and low density lipoprotein (LDL) but positive effects were recorded on serum total protein and albumin of broilers under BGL, globulin under GL and uric acid under BL and triglyceride under GL. For layers, the results of this work showed a significant effect on glucose, globulin and HDL under WL, total protein under BL. cholesterol under BGL and LDL under RL but no effect in the level of albumin and triglyceride level of layers serum, whereas no effect for stocking density on these traits were observed. It was concluded that there is an advantage in the blood measurements of birds raised under the influence of BGL compared with those raised under other light programs.
Keywords
Biochemical traits, Broilers, Color light, Layers, Stocking density1. Introduction
Light is as an important management tool to regulate broiler production. Artificial lighting for broilers consists of 3 aspects: photoperiod, wavelength, and light intensity [1]. Color is an important aspect of light that has been considered at one time as a management tool in poultry production [2]. The associated colors are Blue B (435-500 nm); Green G (500-565 nm) and Yellow Y (500-600nm), Orange O (600-630 nm) and Red R (630-700 nm) [3]. The eye of the chicken appears to be more sensitive to a broader spectrum than humans, in addition, chickens can see ultraviolet and infrared as well. These characteristics have to be taken into consideration in the selection of artificial light sources and the design of lighting programs for chickens [4]. One of the characteristics of large commercial broiler operations is the
stocking density of birds per 1 m2 area and the choice of
appropriate genetic material to ensure rapid attainment of required weight gains and the best feed conversion possible [5]. Stocking density is inherently confounded with either
* Corresponding author:
[email protected] (Mudhar A. S. Abu Tabeekh) Published online at http://journal.sapub.org/zoology
Copyright © 2016 Scientific & Academic Publishing. All Rights Reserved
the number of animals in a group, or with the total amount of space available to this group [6].
Biochemical values of chicken's serum may be influenced by several factors including color light and stocking density. Plasma total protein represents a complex mixture of proteins of different structural and functional properties. The major plasma proteins include albumins, globulins and fibrinogen. In birds, the plasma albumin constitute about 40-60% of the total protein [7]. The normal plasma total protein concentration of normal birds generally range between 2.5 and 4.5 g/dl [8]. The evaluation of the levels of total protein and its fractions supply the information required to interpret the occurrence of dehydration, infections, immune diseases, and inflammatory responses [9]. On his study about turkey at 25 and 40 week of age [10] showed no significant differences in plasma albumin and albumin to globulin ratio due to different color of lights (ultraviolet light, fluorescent and infrared lights). On the other hand [11] concluded that serum total protein, albumin and globulin were not significantly affected by different color of lights. Also [12] found that albumin to globulin ratio was not significantly affected by different light treatments.
Triglycerides are also present in blood plasma, and in association with cholesterol they form the plasma lipids [13]. Lipids in the laying hen are about fourfold higher than in non-laying hen [8]. During stress, plasma cholesterol levels are increased, as are HDL levels, because the function of HDL is to transport cholesterol to liver from body tissues [14]. On his research [15] failed to detect any effects of density on glucose, and cholesterol levels in broilers reared
between 0.14 and 0.052 m2 space allowance per bird (20 and
55 kg/m2). Normal blood glucose concentration of most
birds ranges between 200 and 500 mg/dl whereas the normal blood uric acid concentration for most birds and reptiles is less than 10 mg/dl. Hyperuricemia is indicated by uric acid values greater than 15 mg/dl and is usually associated with renal disease diet [8]. The aim of this study was to investigate the effects of light color lights and stocking density and their interaction on performance of broilers and layers as measured by some biochemical parameters as physiological index in birds.
2. Materials and Methods
2.1. Birds and Husbandry
A total of 675 Ross 308 one-day-old broiler chicks were used in the first experiment. The chicks were reared in the poultry farm at the College of Veterinary Medicine, Basra University for 7 weeks. All broilers were cared for in 5 light-controlled rooms (n = 135) and were exposed to white light as control (WL), red light (RL), blue light (BL), green light (GL), and Blue – Green mixed light (BGL), at birds eye level with an light-emitting diode system (LED) for 7 weeks applied for 24 hours daily in separated rooms (3 x 3 x
4 meters) with light intensity 5 watt/m2. The birds were
randomly housed into 9 wooden sealed pens of 1m2 in three
replicates for each density 12, 15 and 18 birds/m2. Room
temperature was initially 34°C and was subsequently reduced by 2°C/week to 26°C at 35 day. In the second treatment, a total of 180 Isa Brown layers were raised under control condition from 25 week until 36 week of age. They divided into 5 treatments with an average of 36 birds for each of five color light rooms (16 hours light- 8 hours dark)
in three replicates for each density 5 and 7 birds/m2 in the
room. Half cylinder plastic feeders were placed in each pen. The birds were supplied with feed and water ad libitum, and Pellet diets were formulated to meet the nutrient recommendations for poultry according to [16]. In broilers, total dietary metabolic energy for the starter, grower and finisher were 2925, 3111 and 3171 kcal/kg respectively, while the values of crude protein were 22.21, 20.14 and 18.08 % respectively. In layers, total dietary metabolic energy was 2759 kcal/kg and 17.75% crude protein according to Isa Brown programs [17]. A nipple water drinking system was set up in each pen and was manually adjusted as birds grew to ensure the watering system was kept at a proper level.
2.2. Biochemical Traits
At the end of 5 week age for broilers and 36 week for layers, 1 birds of average weight from each replicate were selected and blood was collected from the wing vein. Blood samples were taken in test tubes without anticoagulant and labeled according to each replicate and treatment and then the samples centrifuged and the collected serum stored at -20°C until analyzed [18]. Specific kits were used for each test. The biochemical parameters determined by routine methods for glucose as described by [19], total protein [20], uric acid [21] and lipids according to [22].
2.3. Models of Analysis
Data was analyzed using completely randomized design (CRD) according to [23]. The significant tests for the differences between each two means for any studied trait were done according to Duncan’s multiple rang test.
The model was: Yijk = M + Li + Dj+ (LD) ij + eijk
Where: Yijk = Observation on the ij individual
M = Overall mean Li = light effect
Dj = density effect
(LD) ij= Interaction between light and density
Eijk = Random error
3. Results and Discussion
3.1. Biochemical Traits of Broilers
The importance of hematological and biochemical parameters as diagnostic tools and physiological indicators in birds has been documented [24]. These parameters are greatly affected by sex, age, nutrition and season [25]. The present study showed an absence of significant effect of light color on serum glucose concentration of broilers. Two lighting programs were used by [26], continuous lighting (24 hours light: 0dark) and intermittent lighting (16 hours light: 8 hours dark). The researcher reported that the two lighting programs did not influence serum glucose in broilers. On the other hand, stocking density had no significant effect on serum glucose; result of the current study may be due to the absence of stress. Increasing blood glucose levels, due to the effect of glucocorticoid are described as an important indicator of stress conditions [27]. The result also agreed with [15] who found that stocking density did not cause physiological adaptive changes indicative of stress.
probably by enhancing proliferation of skeletal muscle satellite cells and BL enhanced growth at a later age, probably by elevation in plasma androgens. Androgens enhance protein synthesis and reduce protein breakdown [30]. The researcher [31] found that illuminating with monochromatic green or blue light may increases their muscle growth by affecting satellite cell proliferation and subsequent addition of muscle fibers. [32] Proved that the hypothalamic photoreceptors of chicken are more sensitive to blue/green light when illuminated directly. [33] Referred that green and blue light enhance the immune response better than red light. [34] Found both blue and green lights were more effective to stimulate testosterone secretion and myofiber growth which increased body growth. The results of present study disagreed with findings of [10] that referred to the absence of significant differences in the level of total protein and albumin and globulin in the blood serum as a result of colored light in turkey.
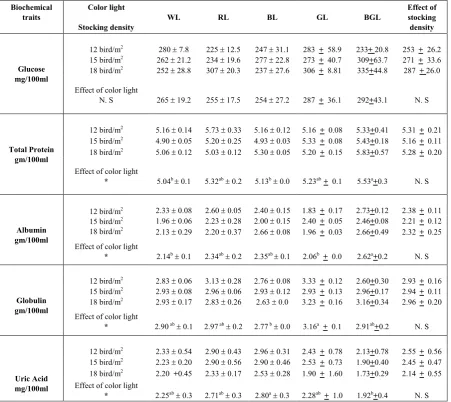
As noted in Table 1, these parameters showed no significant differences between various groups of birds at different densities. The results were in agreement with the corresponding values reported by [35] who pointed to the absence of significant differences in the level of total protein, albumin and globulin in the serum of birds at
densities 10, 14 and 18 birds / m2. As shown in Table 1, A
significant effect (P <0.05) to the color light used in the concentration of uric acid in serum of broilers at different experimental treatments at the age of 35 days, the highest rate recorded in the birds reared under the influence of BL 2.80 mg/100 ml while the lowest rate was 1.92 mg /100 ml recorded for broilers reared under the influence of BGL. This result reflect the significant increase in the value of total protein in broilers of BGL group as well as the significant decrease in broilers of BL group. The results can be attributed to the presence of inverse relationship between the total protein and uric acid [36], since higher plasma uric acid reflects a breakdown of body protein [37].
Table 1. Effect of color light and stocking density on some biochemical traits of broilers at 35th day of age (M±SE)
Effect of stocking density BGL GL BL RL WL Color light Stocking density Biochemical traits Glucose mg/100ml
253 + 26.2 233+ 20.8
283 + 58.9 247 ± 31.1
225 ± 12.5 280 ± 7.8
12 bird/m2
271 + 33.6 309+63.7
273 + 40.7 277 ± 22.8
234 ± 19.6 262 ± 21.2
15 bird/m2
287 + 26.0 335+44.8
306 + 8.81 237 ± 27.6
307 ± 20.3 252 ± 28.8
18 bird/m2
N. S 292+43.1
287 + 36.1 254 ± 27.2
255 ± 17.5 265 ± 19.2
Effect of color light N. S
Total Protein gm/100ml
5.31 + 0.21 5.33+0.41
5.16 + 0.08 5.16 ± 0.12
5.73 ± 0.33 5.16 ± 0.14
12 bird/m2
5.16 + 0.11 5.43+0.18
5.33 + 0.08 4.93 ± 0.03
5.20 ± 0.25 4.90 ± 0.05
15 bird/m2
5.28 + 0.20 5.83+0.57
5.20 + 0.15 5.30 ± 0.05
5.03 ± 0.12 5.06 ± 0.12
18 bird/m2
N. S 5.53a+0.3
5.23ab + 0.1
5.13b± 0.0
5.32ab± 0.2
5.04b ± 0.1
Effect of color light
*
Albumin gm/100ml
2.38 + 0.11 2.73+0.12
1.83 + 0.17 2.40 ± 0.15
2.60 ± 0.05 2.33 ± 0.08
12 bird/m2
15 bird/m2
18 bird/m2 1.96 2.13 ±± 0.06 0.29 2.23 2.20 ±± 0.37 0.28 2.66 2.00 ±± 0.15 0.08 2.40 1.96 ++ 0.05 0.03 2.662.46++0.08 0.49 2.32 2.21 ++ 0.12 0.25
N. S 2.62a+0.2
2.06b+ 0.0
2.35ab ± 0.1
2.34ab± 0.2
2.14b± 0.1
Effect of color light
*
Globulin gm/100ml
2.93 + 0.16 2.60+0.30
3.33 + 0.12 2.76 ± 0.08
3.13 ± 0.28 2.83 ± 0.06
12 bird/m2
2.94 + 0.11 2.96+0.17
2.93 + 0.13 2.93 ± 0.12
2.96 ± 0.06 2.93 ± 0.08
15 bird/m2
2.96 + 0.20 3.16+0.34
3.23 + 0.16 2.63 ± 0.0
2.83 ± 0.26 2.93 ± 0.17
18 bird/m2
N. S 2.91ab+0.2
3.16a + 0.1
2.77 b± 0.0
2.97 ab± 0.2
2.90 ab± 0.1
Effect of color light
*
Uric Acid mg/100ml
2.55 + 0.56 2.13+0.78
2.43 + 0.78 2.96 ± 0.31
2.90 ± 0.43 2.33 ± 0.54
12 bird/m2
2.45 + 0.47 1.90+0.40
2.53 + 0.73 2.90 ± 0.46
2.90 ± 0.56 2.23 ± 0.20
15 bird/m2
2.14 + 0.55 1.73+0.29
1.90 + 1.60 2.53 ± 0.28
2.33 ± 0.17 2.20 +0.45
18 bird/m2
N. S 1.92b+0.4
2.28ab + 1.0
2.80a± 0.3
2.71ab± 0.3
2.25ab± 0.3
Effect of color light
*
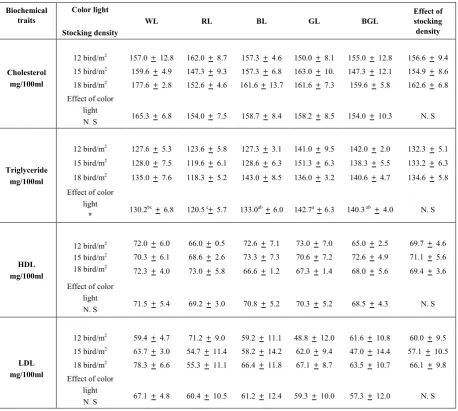
The results of the lipid biochemical traits as affected by different light colors and stocking densities were presented in Table 2. There were no significant differences in serum cholesterol, high density lipoprotein (HDL) and low density lipoprotein (LDL), while a significant increase (P< 0.05) reported in serum triglyceride under GL 142.7 mg/100 ml. However, it was found to be agreeing with results obtained by [10] who referred that plasma cholesterol was not affected by light color and sex of turkeys, meaning that different light colors did not induce physiological stress. Similar results were reported by [11] who found that plasma cholesterol as an indication of environmental stress was not significantly affected by different light treatments. The overall mean for triglyceride under GL showed in this study is partial consistent with the results of [38], which showed positive effect of green light in abdominal fat as well as other production performance such as body weight, weight gain, feed intake, feed conversion, dressing percentage and liver
weight. On the other hand [39] found that cholesterol and triglyceride levels did not differ significant among different lighting groups. The insignificant results of HDL and LDL reflected the insignificant results that have merged in the cholesterol values. The result of this study revealed that values of the lipid biochemical parameters studied were not differed significantly within broilers of same age at various densities. However, these values reported here were the same results found by [35] and [15] who found no significance on serum cholesterol under different bird densities. For Stocking density, [26] recorded that cholesterol levels (p < 0.05) were statistically higher in broilers reared at 17.5
bird/m2 than broilers reared at 11.9 bird/m2. For triglyceride,
the researcher noted that the results not differed significantly in the blood serum of broilers reared at the level of density
(11.9 and 17.5 birds/m2) and possibly due to the lack of
exposure of birds to stress or metabolic disorder [40].
Table 2. Effect of color light and stocking density on lipid traits of broilers at 35th day of age (M+SE)
Effect of stocking density BGL
GL BL
RL WL
Color light
Stocking density Biochemical
traits
156.6 + 9.4 155.0 + 12.8
150.0 + 8.1 157.3 + 4.6
162.0 + 8.7 157.0 + 12.8
12 bird/m2
Cholesterol mg/100ml
154.9 + 8.6 147.3 + 12.1
163.0 + 10. 157.3 + 6.8
147.3 + 9.3 159.6 + 4.9
15 bird/m2
162.6 + 6.8 159.6 + 5.8
161.6 + 7.3 161.6 + 13.7
152.6 + 4.6 177.6 + 2.8
18 bird/m2
N. S 154.0 + 10.3
158.2 + 8.5 158.7 + 8.4
154.0 + 7.5 165.3 + 6.8
Effect of color light N. S
Triglyceride mg/100ml
132.3 + 5.1 142.0 + 2.0
141.0 + 9.5 127.3 + 3.1
123.6 + 5.8 127.6 + 5.3
12 bird/m2
133.2 + 6.3 138.3 + 5.5
151.3 + 6.3 128.6 + 6.3
119.6 + 6.1 128.0 + 7.5
15 bird/m2
134.6 + 5.8 140.6 + 4.7
136.0 + 3.2 143.0 + 8.5
118.3 + 5.2 135.0 + 7.6
18 bird/m2
N. S 140.3 ab + 4.0
142.7a+ 6.3
133.0ab+ 6.0
120.5 c+ 5.7
130.2bc+ 6.8
Effect of color light
*
HDL mg/100ml
69.7 + 4.6 65.0 + 2.5
73.0 + 7.0 72.6 + 7.1
66.0 + 0.5 72.0 + 6.0
12 bird/m2
15 bird/m2
18 bird/m2
71.1 + 5.6 72.6 + 4.9
70.6 + 7.2 73.3 + 7.3
68.6 + 2.6 70.3 + 6.1
69.4 + 3.6 68.0 + 5.6
67.3 + 1.4 66.6 + 1.2
73.0 + 5.8 72.3 + 4.0
N. S 68.5 + 4.3
70.3 + 5.2 70.8 + 5.2
69.2 + 3.0 71.5 + 5.4
Effect of color light N. S
LDL mg/100ml
60.0 + 9.5 61.6 + 10.8
48.8 + 12.0 59.2 + 11.1
71.2 + 9.0 59.4 + 4.7
12 bird/m2
57.1 + 10.5 47.0 + 14.4
62.0 + 9.4 58.2 + 14.2
54.7 + 11.4 63.7 + 3.0
15 bird/m2
66.1 + 9.8 63.5 + 10.7
67.1 + 8.7 66.4 + 11.8
55.3 + 11.1 78.3 + 6.6
18 bird/m2
N. S 57.3 + 12.0
59.3 + 10.0 61.2 + 12.4
60.4 + 10.5 67.1 + 4.8
Effect of color light N. S
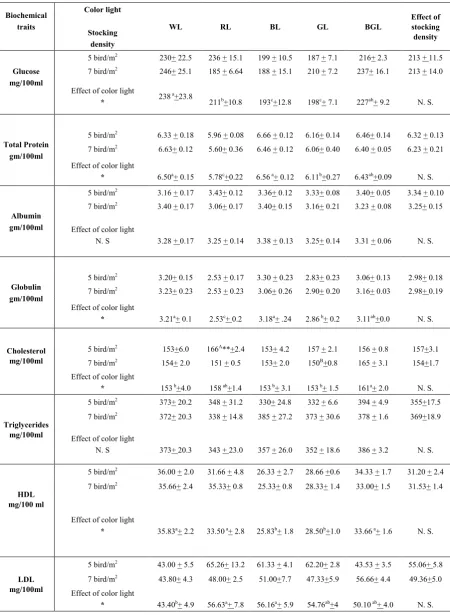
Table 3. Effect of color light and stocking density on some biochemical traits of layers at 36th week of age (M+SE) Effect of stocking density BGL GL BL RL WL Color light Stocking density Biochemical traits
213 + 11.5 216+ 2.3
187 + 7.1 199 + 10.5
236 + 15.1 230+ 22.5
5 bird/m2
Glucose mg/100ml
213 + 14.0 237+ 16.1
210 + 7.2 188 + 15.1
185 + 6.64 246+ 25.1
7 bird/m2
N. S. 227ab+ 9.2
198c+ 7.1
193c+12.8
211b+10.8
238 a+23.8
Effect of color light
*
Total Protein gm/100ml
6.32 + 0.13 6.46+ 0.14
6.16+ 0.14 6.66 + 0.12
5.96 + 0.08 6.33 + 0.18
5 bird/m2
6.23 + 0.21 6.40 + 0.05
6.06+ 0.40 6.46 + 0.12
5.60+ 0.36 6.63+ 0.12
7 bird/m2
N. S. 6.43ab+0.09
6.11b+0.27
6.56 a+ 0.12
5.78c+0.22
6.50a+ 0.15
Effect of color light
*
3.34 + 0.10 3.40+ 0.05
3.33+ 0.08 3.36+ 0.12
3.43+ 0.12 3.16 + 0.17
5 bird/m2
Albumin gm/100ml
3.25+ 0.15 3.23 + 0.08
3.16+ 0.21 3.40+ 0.15
3.06+ 0.17 3.40 + 0.17
7 bird/m2
N. S. 3.31 + 0.06
3.25+ 0.14 3.38 + 0.13
3.25 + 0.14 3.28 + 0.17
Effect of color light N. S Globulin gm/100ml 2.98+ 0.18 3.06+ 0.13 2.83+ 0.23 3.30 + 0.23
2.53 + 0.17 3.20+ 0.15
5 bird/m2
2.98+ 0.19 3.16+ 0.03
2.90+ 0.20 3.06+ 0.26
2.53 + 0.23 3.23+ 0.23
7 bird/m2
N. S. 3.11ab+0.0
2.86 b+ 0.2
3.18a+ .24
2.53c+ 0.2
3.21a+ 0.1
Effect of color light
*
Cholesterol mg/100ml
157+3.1 156 + 0.8
157 + 2.1 153+ 4.2
166A**+2.4
153+6.0 5 bird/m2
154+1.7 165 + 3.1
150B+0.8
153+ 2.0 151 + 0.5
154+ 2.0 7 bird/m2
N. S. 161a+ 2.0
153 b+ 1.5
153 b+ 3.1
158 ab+1.4
153 b+4.0
Effect of color light
*
355+17.5 394 + 4.9
332 + 6.6 330+ 24.8
348 + 31.2 373+ 20.2
5 bird/m2
Triglycerides mg/100ml
369+18.9 378 + 1.6
373 + 30.6 385 + 27.2
338 + 14.8 372+ 20.3
7 bird/m2
N. S. 386 + 3.2
352 + 18.6 357 + 26.0
343 + 23.0 373+ 20.3
Effect of color light N. S
31.20 + 2.4 34.33 + 1.7
28.66 +0.6 26.33 + 2.7
31.66 + 4.8 36.00 + 2.0
5 bird/m2
HDL mg/100 ml 31.53+ 1.4 33.00+ 1.5 28.33+ 1.4 25.33+ 0.8 35.33+ 0.8 35.66+ 2.4
7 bird/m2
N. S. 33.66 a+ 1.6
28.50b+1.0
25.83b+ 1.8
33.50 a+ 2.8
35.83a+ 2.2
Effect of color light
*
55.06+ 5.8 43.53 + 3.5
62.20+ 2.8 61.33 + 4.1
65.26+ 13.2 43.00 + 5.5
5 bird/m2
LDL
mg/100ml 7 bird/m 43.80+ 4.3 48.00+ 2.5 51.00+7.7 47.33+5.9 56.66+ 4.4 49.36+5.0
2
N. S. 50.10 ab+ 4.0
54.76ab+4
56.16a+ 5.9
56.63a+ 7.8
43.40b+ 4.9
Effect of color light
*
3.2. Biochemical Traits of Layers
The results of this work showed a significant effect (P < 0.05) of WL on serum glucose concentration 238.3 mg/100 ml as shown in Table 3. The results of the current study were inconsistent with results obtained by [41] who indicated the presence of significant increase on serum glucose by using the lighting program (red light 12 hours and then green light two hours followed by blue light two hours) compared with other programs (the red light program 14 hours and then the green light two hours, white light, blue light, light green, red light). There were no significant differences among various bird densities. This result was disagreed with [42] who measured blood parameters to evaluate the effect of different cage systems; the result indicated that housing systems had no significant effect. Similar results were recorded by [43] in his study on Brown laying hens (Hyline Brown), were allocated as one, three or five hens in each cage. Significantly higher mean estimates for serum glucose was higher in cages with one hen than that with five hens. The overall mean of total protein was 6.56 gm/100 ml under BL. This result is higher significantly (P < 0.05) compared with other groups. Perhaps, the result may reflect the high increase on body weight of layers under the influence of BL as referred by [44], thus the increase in protein synthesis linked positively to the rise total protein concentration in blood serum [19]. A significant increase (P < 0.05) on globulin level under WL 3.21 gm/100 ml. The result disagreed with [10] who found insignificant differences in the level of serum globulin as a result of colored light in turkey. No significant difference was noted on serum albumin level. The result of this work is in accordance with previous studies and results obtained by [41] and [10]. On the other hand, the effects of stocking density on mentioned traits were showed as in Table 3. No statistical significance was found in serum total protein, albumin and globulin concentration between different groups although there was a trend toward increasing stress with higher stocking density. The serum parameters related with lipid responses to the influence of color light and stocking density were measured. Serum cholesterol was increased significantly (P < 0.05) under BGL161 mg/100ml, HDL under WL 35.83 mg/100ml and LDL under RL 56.63 mg/100ml whereas no effect of color lights on serum triglyceride of layers. The significant value of cholesterol was inconsistent with [41] who found that the serum cholesterol in laying hens at 22 week was insignificant under the influence of different light colors (white, blue, green and red light), while triglyceride value was significant under RL. In addition, no effects for stocking density on these traits were observed. Our results were disagreement with the previous report of [42] who suggested that housing systems had no significant effect on hormonal and metabolic status including cholesterol, triglyceride, HDL and LDL. [43] Studied Brown laying hens were allocated as one, three or five hens in each cage. The researcher recorded significantly higher mean estimates for serum cholesterol in cages with
one hen than that with five hens. The analysis of variance as shown in Table 3 referred to the presence of an interaction between color light and stocking density on cholesterol value. However, the interaction results observed to has high significant (P <0.05) differences. The overall mean of cholesterol was remarkably higher under the RL treatment at
the level of density5 bird/m2 (166 mg/100ml) but lower
under the GL treatment at the level of density 7 bird/m2 (150
mg/100ml).
4. Conclusions
It is well known that biochemical system can reflect the
condition of the birds and the changes under the influence of different light colors and various densities. A significant effects were recorded on serum total protein and albumin of broilers under BGL, globulin under GL uric acid under BL and triglyceride under GL. For layers, the results showed a significant effect on glucose, globulin and HDL under WL, total protein under BL. cholesterol under BGL and LDL under RL. The present study concludes that there is an advantage in the use of BGL and partially WL more than RL which increased the LDL level. The study also showed that the serum traits were not significantly affected by stocking density, nor there significant differences due to the interaction between light color and bird density except for cholesterol value. More research needs to be conducted
further investigating these traits.Broiler and layer welfare is
increasingly becoming important to consumers who prefer that birds are raised in improved and comfortable conditions.
REFERENCES
[1] Deep, A., Schwean-Lardner, k., Crowe, T.G., Fancher, B. I., and Classen, H. L., 2010, Effect of light intensity on broiler production, processing characteristics, and welfare. Poult. Sci., 89, 2326–2333.
[2] Prayitno, D. S., Phillips, C.J.C., and Omed, H., 1997, The Effects of color of lighting on the behavior and production of meat Chickens. Poult. Sci., 76, 452–457.
[3] Hakan, B., and Ali, A., 2005, Effects of light wavelength on broiler performance. Hayvansal Uretim., 46, 22-32.
[4] Thiele, H.H., 2009, Light Stimulation of Commercial Layers. Lohman Information. 44 (2), Lohmann Tierzucht GmbH, Cuxhaven, Germany.
[5] Skomorucha, I., Sosnowka Czajka, E., and E. Herbut, 2004, Effect of stocking density on production effects and welfare of broiler chickens. Ann. Anim. Sci., Suppl., 1, 129 – 131. [6] Buijs, S., Van Poucke, E., Van Dongen, S., Lens, L., Baert J.,
[7] Gentry, P.A., Blood coagulation and haemostasis. In: Reece, W.O. (Ed.). Duke’s Physiology of Domestic Animals. 12th Edn. Panima Publishing Corporation, New Delhi, Pp: 53-70, 2005.
[8] Campbell, T. W., Blood Biochemistry of Lower Vertebrates. In: 55th Annual Meeting of the American College of Veterinary Pathologists (ACVP) and 39th Annual Meeting of the American Society of Clinical Pathology.2004.
[9] Silva, P.R.L, Freitas Neto, O.C., Laurentiz, O.M. Junqueira, A.C., and Fagliari, J. J., 2007, Blood serum components and serum protein test of Hybro-PG broilers of different ages. Brazil. J. Poult. Sci., 9, 229 – 232.
[10] El-Fiky, A., Soltan, M., Kalamah, M.A., and Abou-Saad, S., 2008, Effect of light color on some productive, reproductive, egg quality traits and free radicalsin turkey. Egypt. Poult. Sci., 28, 677-699.
[11] Saad, A. Y., 1995. Effect of some managemental and feeding treatments on ducks production. M. Sc. thesis, Faculty of Agriculture, Cairo University. Egypt.
[12] Faltes, A.A., Galal, A. Gh., El-Moty, A. K. I. and Gallil, M.A., 1988, Effect of different lighting regimes on broiler performance and its physiological response. Minia J. Agric. Res. and develop., 3,1425-1440.
[13] Hermier, D., Quignard-Boulange, A., Dugail, I., Guy, G., Salichon, M.R., Brigand, L., Ardouin, B. and Leclercq, B., 1989, Evidence of enhanced storage capacity in adipose tissue of genetically fat chickens. J. Nutr., 119, 1369-1375. [14] Sahin, R., and Kucukm, O., 2001, A simple way to reduce
heat stress in laying hens as judged by egg laying, body weight gain and biochemical parameters. Acta Vetenarium Hungarcia, 49,421–430.
[15] Thaxton, J.P., Dozier, W.A., Branton, S.L., Morgan, G.W., Miles, D.M., Roush, W.B., Lott, B.D., and Vizzier-Thaxton, Y., 2006, Stocking density and physiological adaptive responses of broilers. Poult. Sci., 85,819-824.
[16] NRC, 1994, Nutrient Requirements of Poultry.9th rev. ed. Natl. Acad. Press, Washington DC, USA.
[17] Isa Brown, 2010, Commercial Management Guide.
[18] Al-Daraji, H. J., Al-Hayani, W. K., andAl- Hassani, A.S., 2008, Avian Hematology. College of Agriculture, University of Baghdad, Ministry of Higher Education and Scientific Research, Iraq.
[19] Colse, E.H., Vet. ClinicalPathology.4thed. W.B. Saunders Company. Philadelphia, London, 1986.
[20] Wootton, I. D. P., In Microanalysis in Medical Biochemistry, 4th ed., p. 147. Churchill, London, 1964.
[21] Ross, J. G., Christic, C., Halliday, W.G. and Jones, R. M., 1978, Hematological and blood chemistry (comparison Values) for clinical pathology in Poult. Vet. Rec., 102, 29-31. [22] Ali, S. H., 2008, A manual of Laboratory Training in Hospital.
College of Pharmacy, University of Baghdad, Iraq.
[23] SPSS, Statistical Package of Soc. Sci., Ver.18. Appl. Guide. Copy right by SPSS Inc.USA, 2009.
[24] Hauptmanova, K., Maly, M., and Literak, I., 2006, Changes of hematological parameters in common pheasant throughout the year. Vet. Med., 51, 29-34.
[25] Kececi, T., and Col, R., 2011, Hematological and biochemical values of the blood pheasants (Phasianus colchicus) of different ages. Turk. J. Anim. Sci., 35, 149-156.
[26] Onbasilar, E. E., Poyraz, O., Erdem, E., and Zturk, H. 2008, Influence of lighting periods and stocking densities on performance, carcass characteristics and some stress parameters in broilers. Arch. Geflugelk., 72, 193–200. [27] Simon J., 1984, Effects of daily corticosterone injections
upon plasma glucose, insulin, uric acid and electrolytes and food intake pattern in the chicken. DiabeteMetab., 10,211-217.
[28] Al-Attar, A.H., and Rashd, M.A., 1985, Electrophoretic serum protein fraction in dwarf and normal layer hens and their correlation with productive traits. Anim. Breed. Abst., 53, 6710.
[29] Halevy, O., Biran, I., and Rozenboim, I., 1998, Various light source treatments affect body and skeletal muscle growth by affecting skeletal muscle satellite cell proliferation in broilers. Comparat. Biochem. and Physiol., 120, 317-323. [30] Capaccio, J. A., Kurowski, T. T., Czerwinski, S. M.,
Chatterton, R. T., and Hickson, R. C., 1987, Testosterone fails to prevent skeletal muscle atrophy from glucocorticoids. J. Appl. Physiol., 63,328–334.
[31] Rozenboim, I., Biran, I., Uni, Z., and Halevy, O., 1999, The Effect of monochromatic light on broiler growth and development. Poult. Sci. 78,135-138.
[32] Lewis, P.D. and Morris, T.R., 2000, Poultry and coloured light, World's Poult. Sci. J., 56, 189-207.
[33] Xie D., Wang, Z. X., Dong, Y. L., Cao, J., Wang, J. F., Chen, J. L., and Chen, Y. X., 2008, Effects of Monochromatic Light on Immune Response of Broilers. Poult. Sci., 87, 1535-1539.
[34] Cao, J., Liu, W., Wang, Z., Xie, D., Chen, Y., 2008, Green and blue monochromatic lights promote growth and development of broilers via stimulating testosterone secretion and microfiber growth. J. Appl. Poult. Res., 17,211-218.
[35] El-Deek A.A. and Al-Harthi, M.A., 2004, Response of modern broiler chicks to stocking density, green tea, commercial multi enzymes and their interactions on productive performance, carcass characteristics, liver composition and plasma constituents. Int. J. Poult. Sci., 3, 635-645.
[36] Iheukwumere, F.C. and Herber, U., 2003, Physiological response of broiler chickens to quantitative water restrictions: Hematology and serum Biochemistry. Int. J. Poult. Sci., 2,117-119.
[38] El -Husseiny, O., S. M. Hashish, S. M. Arafa and A. H. H. Madian, 2000. Response of poultry performance to environmental light colour. Egypt. Poult. Sci., 20: 385. [39] Onbasilar, E. E., Erol, H., Cantekin, Z., and Kaya, U., 2007,
Influence of intermittent lighting on broiler performance, incidence oftibial dyschondroplasia, tonic immobility, some blood parameters and antibody production. Asian-australas. J. Anim. Sci., 20,550–555.
[40] Sturkie, P.D., Avian physiology4th Ed. Springer- Verlag, Newyork, Berlin, Heidelberg, Tokyo, 1986.
[41] Hassan, M. R., Sultana, S., Choe H.S., and Ryu, K.S., 2013, Effect of monochromatic and combined light colour on performance, blood parameters, ovarian morphology and
reproductive hormones in laying hens. Ital. J. Anim. Sci., 12, 359-364.
[42] Guo, Y.Y., Song, Z.G., Jiao, H.C., Song, Q.Q. and Lin, H., 2012, The effect of group size and stocking density on the welfare and performance of hens housed in furnished ages during summer. Anim. Welf., 21, 41-49.
[43] Onbasilar, E. E. and Aksoy, T. 2005, Stress parameters and immune response of layers under different cage floor and density conditions. Livest. Prod. Sci., 95,255–263.